
Why MNI
MNI is the leading provider
of intelligence and analysis on the Global Fixed Income, Foreign Exchange and Energy markets. We use an innovative combination of real-time analysis, deep fundamental research and journalism to provide unique and actionable insights for traders and investors. Our "All signal, no noise" approach drives an intelligence service that is succinct and timely, which is highly regarded by our time constrained client base.Our Head Office is in London with offices in Chicago, Washington and Beijing, as well as an on the ground presence in other major financial centres across the world.
Market Sentiment Remains Shaky, But Little Readthrough for FX So Far
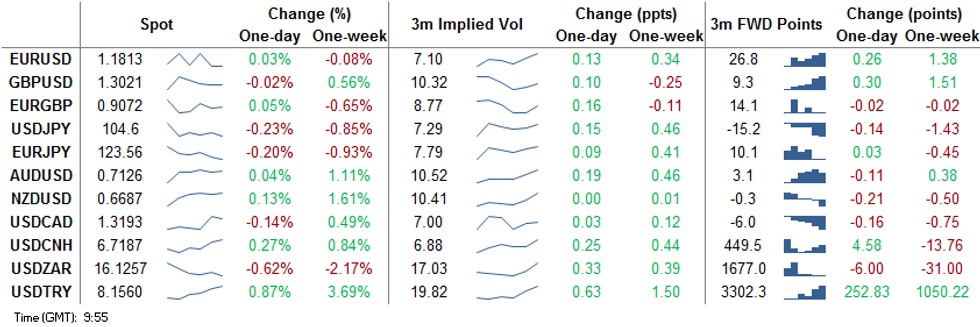
EUR/USD inched through the Monday low in early Tuesday trade, with a poor open for European equity markets leaving stock market sentiment fragile. While US futures volumes sit well below average for this time of day, prices have stabilised slightly, with some support coming from better European bank earnings, with HSBC and Santander reports in focus. It appears this support is already beginning to fade however, which may keep markets concerned over a return to the week's lows.
The greenback is mixed/lower, with the likelihood of a pre-election stimulus package dwindling close to zero as the Senate take their pre-election break. NOK, CAD slightly outperform on better oil prices.
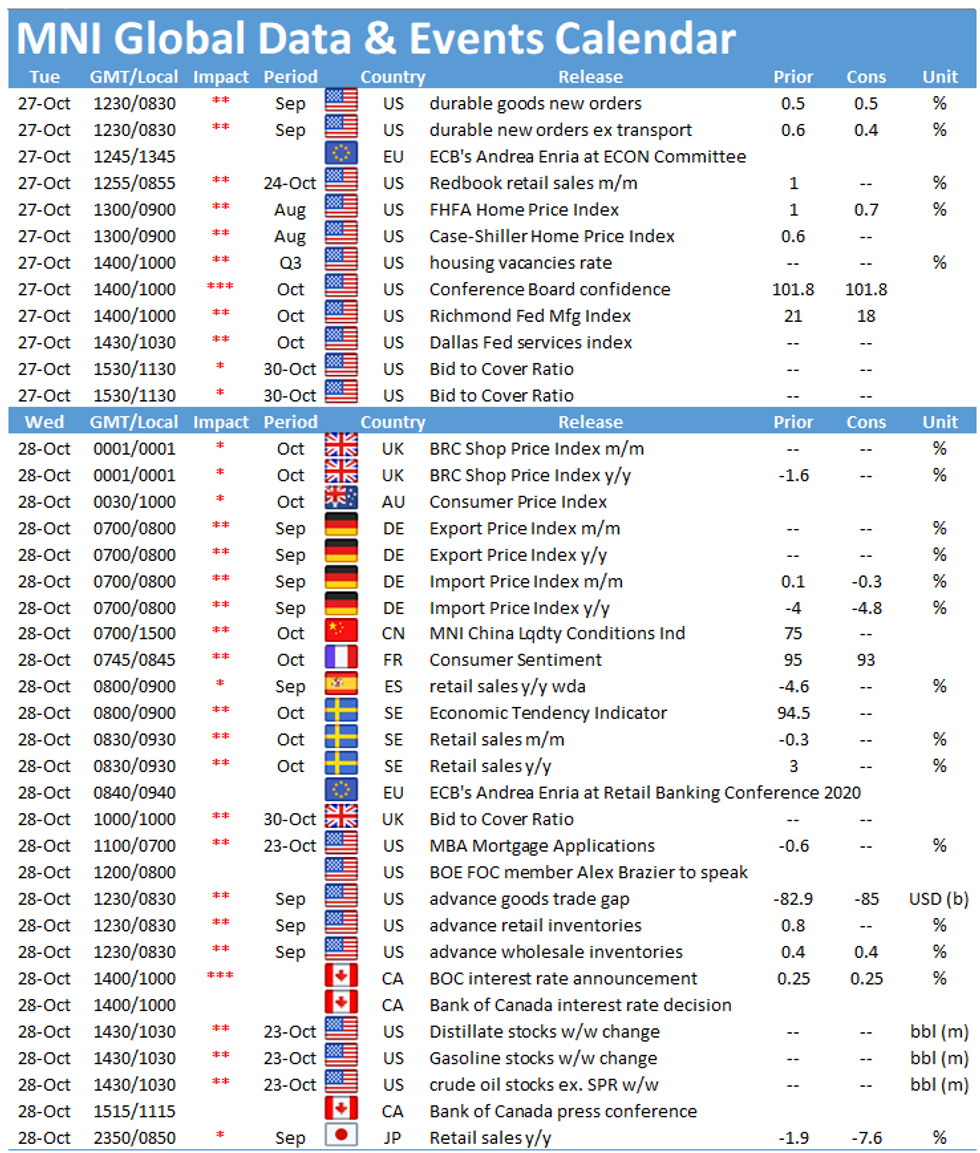
It's a relatively quiet data day, with just US durable goods, consumer confidence due. FOMC still in pre-decision blackout period. Caterpillar, Merck & Pfizer are due ahead of the bell, with Microsoft reporting after the close.
EUR/USD TECHS: Bullish Trend Structure Remains Intact
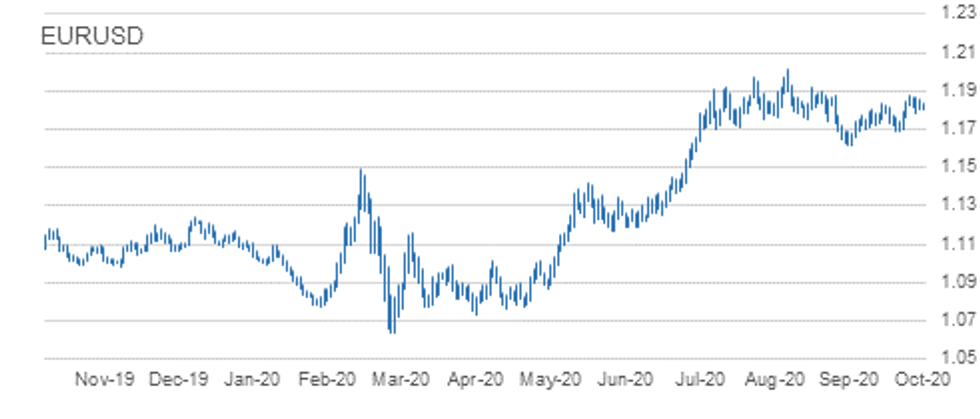
- RES 4: 1.2011 High Sep and key resistance
- RES 3: 1.1917 Sep 10 high / 76.4% of the Sep 1 - 25 sell-off
- RES 2: 1.1904 1.0% 10-dma envelope
- RES 1: 1.1881 High Oct 21 and the bull trigger
- PRICE: 1.1813 @ 09:28 GMT Oct 27
- SUP 1: 1.1787/60 Low Oct 23 / Oct 20
- SUP 2: 1.1749 50-day EMA
- SUP 3: 1.1735 Trendline support drawn off the Sep 28 low
- SUP 4: 1.1689 Low Oct 15 and a key support
EURUSD is still trading below last week's high of 1.1881. Despite the recent shallow pullback, the outlook remains positive and the move lower is considered corrective. The recent breach of 1.1831, Oct 9 high reinforced the current bullish price structure and signals scope for 1.1917 next, a retracement level with the major resistance and hurdle for bulls at 1.2011, Sep 1 high. Key short-term trendline support is at 1.1735.
GBP/USD TECHS: Pullback Considered A Correction
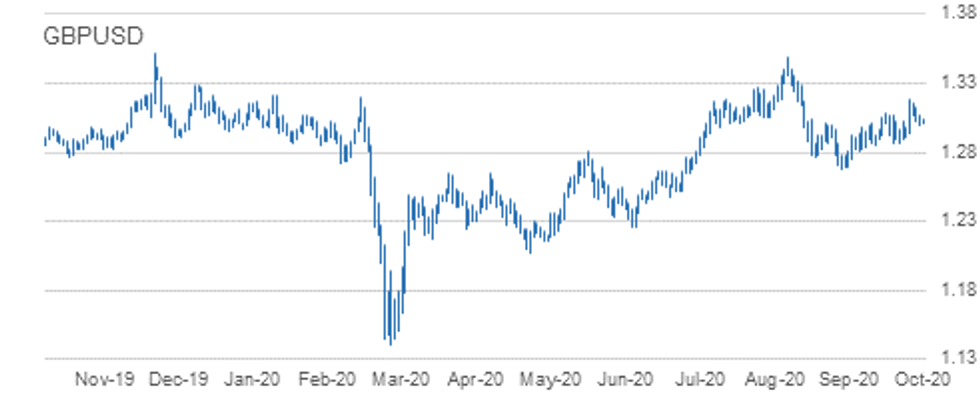
- RES 4: 1.3292 76.4% retracement of the Sep 1 - 23 sell-off
- RES 3: 1.3256 2.0% 10-dma envelope
- RES 2: 1.3257 Former trendline support drawn off the Mar 20 low
- RES 1: 1.3177 High Oct 21
- PRICE: 1.3020 @ 09:37 GMT Oct 27
- SUP 1: 1.2983 20-day EMA
- SUP 2: 1.2940 Low Oct 21
- SUP 3: 1.2863 Low Oct 14 and key near-term support
- SUP 4: 1.2806 Low Sep 30
GBPUSD is retracing the Oct 21 rally. The move lower is likely a correction though with the short-term bullish structure intact. The Oct 21 climb reinforced a bullish theme, confirming a resumption of the upleg that started Sep 23. Attention is on 1.3257, the former trendline support drawn off the Mar 20 low. The trendline was breached on Sep 9. Firm support is at 1.2940, Oct 21 low. The reversal trigger lies at 1.2863, Oct 14 low.
EUR/GBP TECHS: Choppy And Trading Above Support
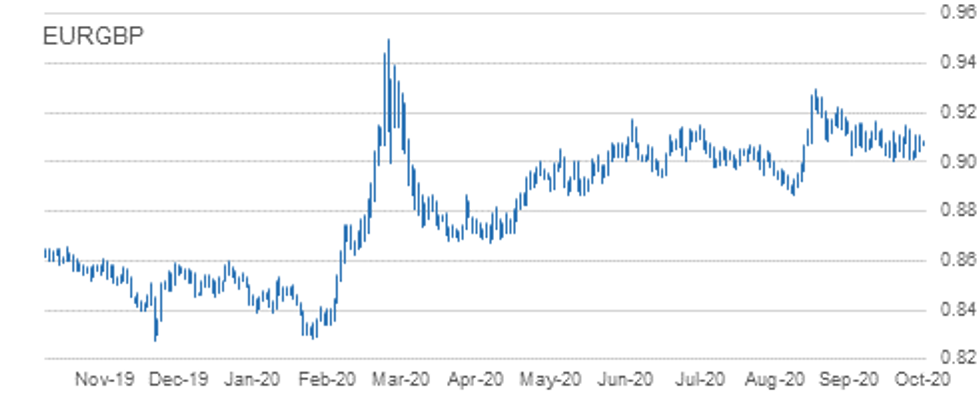
- RES 4: 0.9220 High Sep 22
- RES 3: 0.9160/62 1.0% 10-dma envelope / High Oct 7
- RES 2: 0.9149 Oct 20 high
- RES 1: 0.9107 High Oct 23
- PRICE: 0.9071 @ 09:41 GMT Oct 27
- SUP 1: 0.9012 Low Oct 21
- SUP 2: 0.9007 Low Oct 14 and the bear trigger
- SUP 3: 0.8967 76.4% retracement of the Sep 3 - 11 rally
- SUP 4: 0.8925 Low Sep 7
EURGBP maintains a choppy tone. The outlook is still bearish though following the sharp sell-off on Oct 21. Attention is on support at 0.9007, Oct 14 low and the near-term bear trigger. A break of 0.9007 would confirm a resumption of the downtrend that started Sep 11 and expose 0.8967, a retracement point. Key S/T resistance has been defined at 0.9149, Oct 20 high. Clearance of this level would undermine bearish conditions.
USD/JPY TECHS: Consolidating But Outlook Remains Bearish
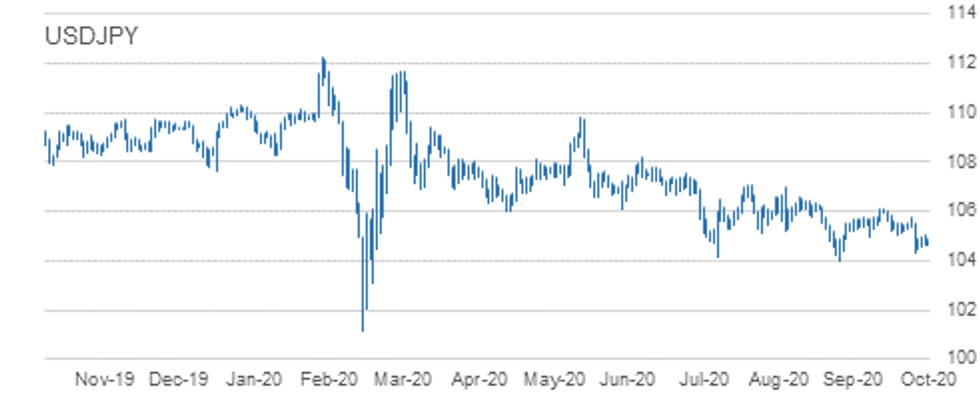
- RES 4: 106.11 High Oct 7 and key resistance
- RES 3: 105.75 High Oct 20
- RES 2: 105.53/60 High Oct 21 / 50-dma
- RES 1: 105.06 Yesterday's high
- PRICE: 104.61 @ 09:43 GMT Oct 27
- SUP 1: 104.34 Low Oct 21
- SUP 2: 104.00 Low Sep 21 and the bear trigger
- SUP 3: 103.67 76.4% retracement of the Mar 9 - 24 rally
- SUP 4: 103.09 Low Mar 12
USDJPY is still trading within its recent range. The outlook remains bearish though following the Oct 21 sell-off and the resumption of the downleg from 106.11, Oct 7 high. A number of important supports have been cleared exposing the key 104.00 handle, Sep 21 low. A break of 104.00 would suggest scope for a deeper USD depreciation within the bear channel drawn off the Mar 24 high. Initial resistance is at 105.04.
EUR/JPY TECHS: Key near-Term Supports Remain Intact
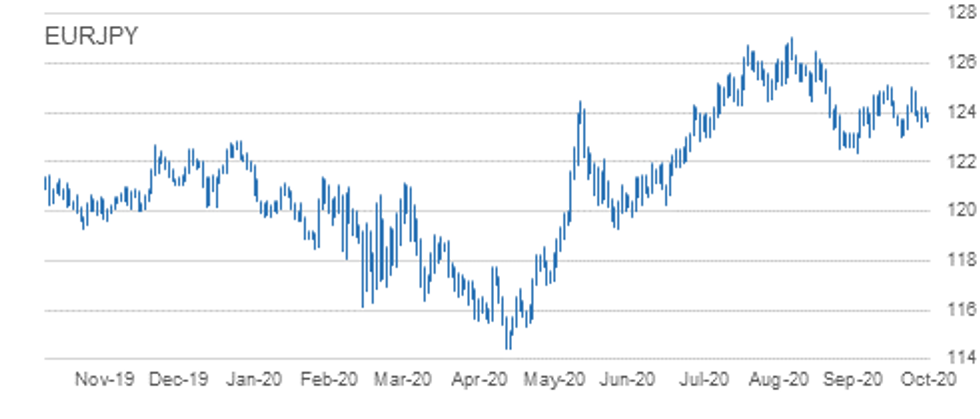
- RES 4: 125.97 76.4% retracement of the Sep 1 - 28 sell-off
- RES 3: 125.28 61.8% of the Sep 1 - 28 sell-off
- RES 2: 125.00/09 High Oct 20 and Oct 9
- RES 1: 124.23 High Oct 23 and 26
- PRICE: 123.56 @ 09:47 GMT Oct 27
- SUP 1: 123.41 Low Oct 23
- SUP 2: 123.03/02 Low Sep 29 and Oct 2 / Low Oct 15
- SUP 3: 122.38/28 Low Sep 28 / 61.8% of the Jun 22 - Sep 1 rally
- SUP 4: 122.25 38.2% retracement of the May - Sep rally
EURJPY is still trading below recent highs. Attention is on support at 123.03/02, low prints between Sep 29 and Oct 15. A break of this level would undermine the recent bullish outlook and instead signal scope for a deeper sell-off towards 122.38, Sep 28 low and the bear trigger. Moving average studies are in a neutral position. To strengthen a bullish argument, price needs to clear key resistance at 125.09, Oct 9 high.
AUD/USD TECHS: Focus Is On Trendline Resistance
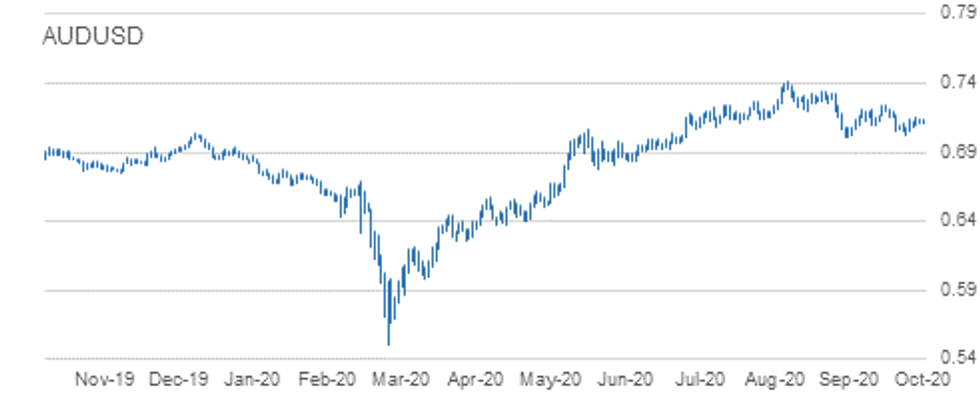
- RES 4: 0.7324 High Sep 21
- RES 3: 0.7243 High Oct 10 and the intraday bull trigger
- RES 2: 0.7163/70 Trendline drawn off the Sep 1 high / High Oct 15
- RES 1: 0.7158 High Oct 23
- PRICE: 0.7127 @ 09:48 GMT Oct 27
- SUP 1: 0.7085 Low Oct 22
- SUP 2: 0.7021 Low Oct 20
- SUP 3: 0.7006 Low Sep 25 and the bear trigger
- SUP 4: 0.6965 23.6% retracement of the Mar - Sep rally
AUDUSD outlook remains bearish although the pair is holding onto recent gains. The Aussie continues to trade below trendline resistance drawn off the Sep 1 high. The line intersects at 0.7163 and the recent failure at the trendline highlights a bearish risk. Attention is on the primary support and bear trigger at 0.7006, Sep 25 low. A trendline break however would alter the picture and signal a stronger reversal. This would open 0.7243, Oct 10 high.
USD/CAD TECHS: Corrective Bounce
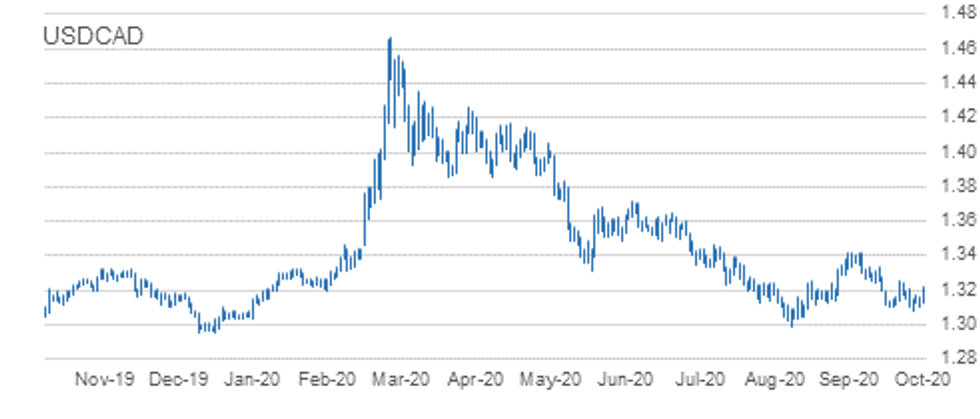
- RES 4: 1.3421 High Sep 30 and primary resistance
- RES 3: 1.3341 High Oct 7
- RES 2: 1.3240/59 50-day EMA / High Oct 15 and the bull trigger
- RES 1: 1.3219 High Oct 26
- PRICE: 1.3192 @ 09:53 GMT Oct 27
- SUP 1: 1.3109/3081 Low Oct 23 / Low Oct 21 and the bear trigger
- SUP 2: 1.3047 Low Sep 7
- SUP 3: 1.3038 Low Sep 2
- SUP 4: 1.2994 Low Sep 1 and the major support
USDCAD started the week on a firm note, rallying Monday. Despite recent gains, the outlook remains bearish though. The pair last week breached key support at 1.3099, Oct 13 low. The move lower confirms a resumption of the current downtrend that started Sep 30. Moving average studies are bearish too, reinforcing current conditions. Scope exists for a move towards the major support at 1.2994, Sep 1 low. Key resistance is at 1.3259, Oct 15 high.
EUR/USD: MNI KEY LEVELS
- *$1.2029/32 Upper 2.0% 10-dma env/May02-2018 high
- *$1.2009/11 May03-2018 high/YTD Sep01 high
- *$1.1996 May14-2018 high
- *$1.1938 May15-2018 high
- *$1.1922 Upper Bollinger Band (3%)
- *$1.1911 Upper 1.0% 10-dma envelope
- *$1.1874 Upper Bollinger Band (2%)
- *$1.1857 100-mma
- *$1.1848/51 Cloud top/Jun14-2018 high
- *$1.1834/36 100-hma/Intraday high
- *$1.1819 ***CURRENT MARKET PRICE 07:37GMT TUESDAY***
- *$1.1815 Sep24-2018 high
- *$1.1807 Intraday low
- *$1.1800/95 55-dma/50-dma
- *$1.1794 200-hma
- *$1.1775 21-dma
- *$1.1757 Sep27-2018 high
- *$1.1736 Fibo 38.2% 1.3993-1.0341
- *$1.1680/75 Lower Boll Band (2%)/Lower 1.0% 10-dma env
- *$1.1651 Sep28-2018 high
- *$1.1643 100-dma
GBP/USD: MNI KEY LEVELS
- *$1.3191/93 Apr04-2019 high/Upper Boll Band (3%)
- *$1.3185 May06-2019 high
- *$1.3144 Fibo 38.2% 1.4377-1.2382
- *$1.3131/33/34 May07-2019 high/Apr12-2019 high/Upper 1.0% 10-dma env
- *$1.3121 Upper Bollinger Band (2%)
- *$1.3109 Fibo 50% 1.1841-1.4377
- *$1.3080 May08-2019 high
- *$1.3069 100-hma
- *$1.3041/45 May13-2019 high/Intraday high
- *$1.3017 55-dma
- *$1.3014 ***CURRENT MARKET PRICE 07:37GMT TUESDAY***
- *$1.3011/10/08 Cloud top/Intraday low/50-dma
- *$1.3005 200-hma
- *$1.2999 Fibo 61.8% 1.3381-1.2382
- *$1.2991 May10-2019 low
- *$1.2981 Cloud base
- *$1.2972/70 21-dma/May14-2019 high
- *$1.2952/47 50-mma/200-wma
- *$1.2904 May14-2019 low
- *$1.2882 Fibo 50% 1.3381-1.2382
- *$1.2874 Lower 1.0% 10-dma envelope
EUR/GBP: MNI KEY LEVELS
- *Gbp0.9412/15 Oct13-2009 high/Oct07-2016 high
- *Gbp0.9342/46 Upper3.0% 10-dma env/Oct15-2009 high
- *Gbp0.9307 Aug29-2017 high
- *Gbp0.9251 Upper 2.0% 10-dma envelope
- *Gbp0.9226 Sep04-2017 high
- *Gbp0.9203 Sep08-2017 high
- *Gbp0.9160/64 Upper 1.0% 10-dma env/Upper Boll Band (3%)
- *Gbp0.9129/34 Cloud top/Upper Boll Band (2%), Sep11-2017 high
- *Gbp0.9108 Jan03-2019 high
- *Gbp0.9084 Intraday high
- *Gbp0.9082 ***CURRENT MARKET PRICE 07:37GMT TUESDAY***
- *Gbp0.9079/78 Cloud base/21-dma
- *Gbp0.9068/66 50-dma, 200-hma/Intraday low, 55-dma
- *Gbp0.9062 Jan11-2019 high
- *Gbp0.9055/51/50 100-hma/Jul17-2019 high/100-dma
- *Gbp0.9048 Jul16-2019 high
- *Gbp0.9039 Jul18-2019 high
- *Gbp0.9017 Lower Bollinger Band (2%)
- *Gbp0.9010 Jul10-2019 high
- *Gbp0.9005/00 Jul23-2019 high/Jul22-2019 high
- *Gbp0.8987 Lower Bollinger Band (3%)
USD/JPY: MNI KEY LEVELS
- *Y106.12 Upper 1.0% 10-dma envelope
- *Y105.77 Cloud top
- *Y105.65 55-dma
- *Y105.57 50-dma
- *Y105.36 21-dma
- *Y105.31 Cloud base
- *Y105.23 Cloud Kijun Sen
- *Y105.08 200-hma
- *Y105.05 Cloud Tenkan Sen
- *Y104.87/89 Jan03-2019 low/Intraday high
- *Y104.77 ***CURRENT MARKET PRICE 07:37GMT TUESDAY***
- *Y104.75 100-hma
- *Y104.67 Intraday low
- *Y104.56 Mar26-2018 low
- *Y104.53 Lower Bollinger Band (2%)
- *Y104.12 Lower Bollinger Band (3%)
- *Y104.02 Lower 1.0% 10-dma envelope
- *Y104.00 YTD low
- *Y103.94 200-mma
- *Y102.97 Lower 2.0% 10-dma envelope
- *Y101.92 Lower 3.0% 10-dma envelope
EUR/JPY: MNI KEY LEVELS
- *Y124.52 50-dma
- *Y124.51 Fibo 61.8% 126.81-120.78
- *Y124.34 Apr01-2019 low
- *Y124.25 May07-2019 high
- *Y124.22 Fibo 38.2% 133.13-118.71
- *Y124.14 Fibo 38.2% 118.71-127.50
- *Y124.06 21-dma
- *Y124.01 Cloud Tenkan Sen
- *Y124.00 Intraday high
- *Y123.93/97 200-hma/100-hma
- *Y123.83 ***CURRENT MARKET PRICE 07:37GMT TUESDAY***
- *Y123.80 Fibo 50% 126.81-120.78
- *Y123.74 May21-2019 high, Cloud Kijun Sen
- *Y123.72 Fibo 61.8% 115.21-137.50
- *Y123.69 Intraday low
- *Y123.68 Cloud base
- *Y123.56 100-dma
- *Y123.54 Fibo 50% 109.57-137.50
- *Y123.51 May22-2019 high
- *Y123.18 Jun11-2019 high
- *Y123.13 Lower Bollinger Band (2%)
AUD/USD: MNI KEY LEVELS
- *$0.7263 50-mma
- *$0.7251 Upper 2.0% 10-dma envelope
- *$0.7244 200-wma
- *$0.7234 Upper Bollinger Band (2%)
- *$0.7206/07 Apr17-2019 high/Feb21-2019 high
- *$0.7194/95 55-dma/50-dma
- *$0.7179 Upper 1.0% 10-dma envelope
- *$0.7168 Cloud base
- *$0.7153 Apr17-2019 low
- *$0.7139/40/42 21-dma/Apr16-2019 low/Intraday high
- *$0.7128 ***CURRENT MARKET PRICE 07:37GMT TUESDAY***
- *$0.7119/16 100-hma/Apr12-2019 low, Intraday low
- *$0.7110 Apr10-2019 low, 100-dma
- *$0.7097 200-hma
- *$0.7088 Apr08-2019 low
- *$0.7073/69 Mar29-2019 low/Apr30-2019 high
- *$0.7057/53 Jul22-2019 high/Apr02-2019 low
- *$0.7048/45 Jul04-2019 high, May07-2019 high/Lower Boll Band (2%)
- *$0.7044 Jul16-2019 high
- *$0.7037 Lower 1.0% 10-dma envelope
- *$0.6998 Lower Bollinger Band (3%)
USD/CAD: MNI KEY LEVELS
- *C$1.3337/39 100-dma/Upper Boll Band (2%)
- *C$1.3328 Fibo 38.2% 1.2783-1.3665
- *C$1.3320 Cloud top
- *C$1.3309 Fibo 38.2% 1.3565-1.3151
- *C$1.3300 Upper 1.0% 10-dma env, Jun13-2019 low
- *C$1.3286 Jun20-2019 high
- *C$1.3224/26 50% 1.2783-1.3665/Jun10-2019 low
- *C$1.3209/12 21-dma/Intraday high
- *C$1.3199/01 50-dma/55-dma
- *C$1.3188 Cloud base
- *C$1.3184 ***CURRENT MARKET PRICE 07:37GMT TUESDAY***
- *C$1.3176/72 50-mma/Intraday low
- *C$1.3168/64/63 200-hma/Jul23-2019 high/Feb21-2019 low
- *C$1.3160 200-wma
- *C$1.3154/51/50 100-hma/Jun20-2019 low/Feb20-2019 low
- *C$1.3120/16 61.8% 1.2783-1.3665/Jul23-2019 low
- *C$1.3113 Feb25-2019 low
- *C$1.3107 Jun26-2019 low
- *C$1.3066 Fibo 38.2% 1.4690-1.2062
- *C$1.3060 Lower Bollinger Band (2%)
- *C$1.3053 Fibo 38.2% 1.2062-1.3665
Expiries for Oct27 NY cut 1000ET (Source DTCC)
- EUR/USD: $1.1775-85(E765mln), $1.1800-05(E1.2bln), $1.1850(E469mln)
- USD/JPY: Y104.25-30($1.1bln-USD puts), Y105.00($1.8bln), Y105.25($1.2bln), Y106.00-05($1.2bln)
- EUR/GBP: Gbp0.9135-45(E910mln)
- AUD/USD: $0.6680(A$1.1bln)
- AUD/NZD: N$1.0809-20(A$2.5bln)
Larger Option Pipeline
- EUR/USD: Oct28 $1.1745-60(E1.3bln), $1.1800-05(E1.6bln), $1.2000(E2.7bln); Oct30 $1.1800(E1.7bln), $1.1850(E1.4bln), $1.1950(E1.7bln-EUR calls), $1.2000(E1.3bln); Nov03 $1.1900-05(E1.3bln)
- USD/JPY: Oct28 Y104.85-00($2.9bln), Y105.30-40($1.8bln); Oct29 Y103.20-25($1.6bln), Y104.00($1.6bln), Y105.25($1.3bln), Y105.55-65($2.4bln), Y106.00($1.2bln); Oct30 Y104.00($1.2bln), Y104.50($2.2bln), Y104.80-85($1.4bln), Y104.95-105.00($1.0bln), Y106.00-05($2.2bln); Nov03 Y105.45-49($1.3bln); Nov04 Y105.00($1.1bln); Nov05 Y106.06-09($1.6bln)
- EUR/JPY: Nov05 Y124.50(E1.0bln)
- GBP/USD: Nov02 $1.3100(Gbp1.1bln), $1.3150(Gbp842mln)
- EUR/GBP: Nov02 Gbp0.8900(E1.8bln-EUR puts), Gbp0.9000(E1.0bln)
- AUD/USD: Oct30 $0.7180-00(A$1.4bln); Nov02 $0.7140-45(A$1.7bln)
- AUD/JPY: Oct29 Y73.20(A$1.0bln-AUD puts), Y76.35-40(A$2.4bln-AUD calls); Oct30 Y77.45(A$1.2bln)
- AUD/NZD: Oct30 N$1.0750(A$1.2bln)
- USD/CAD: Oct30 C$1.3025($1.1bln), C$1.3150($1.2bln)
- USD/CNY: Nov03 Cny6.5334($1.2bln); Nov05 Cny6.75($1.0bln), Cny6.80($1.9bln), Cny6.85($1.3bln)
Why MNI
MNI is the leading provider
of intelligence and analysis on the Global Fixed Income, Foreign Exchange and Energy markets. We use an innovative combination of real-time analysis, deep fundamental research and journalism to provide unique and actionable insights for traders and investors. Our "All signal, no noise" approach drives an intelligence service that is succinct and timely, which is highly regarded by our time constrained client base.Our Head Office is in London with offices in Chicago, Washington and Beijing, as well as an on the ground presence in other major financial centres across the world.