
Why MNI
MNI is the leading provider
of intelligence and analysis on the Global Fixed Income, Foreign Exchange and Energy markets. We use an innovative combination of real-time analysis, deep fundamental research and journalism to provide unique and actionable insights for traders and investors. Our "All signal, no noise" approach drives an intelligence service that is succinct and timely, which is highly regarded by our time constrained client base.Our Head Office is in London with offices in Chicago, Washington and Beijing, as well as an on the ground presence in other major financial centres across the world.
Highlights:
- JPY dive deepens, USD/JPY at highest level since 2002
- Equity consolidation could mark a bull flag
- Light data docket keeps rate hike expectations broadly unchanged

US TSYS SUMMARY: Treasuries Cheapen Ahead Of A Light Docket
- Cash Tsys have steadily cheapened through both Asian and European sessions but outperform core Europe where yields have increased to new cycle highs ahead of tomorrow’s ECB rate decision.
- Today’s milder bear steepening comes after yesterday’s sizeable bull flattening (partly on growth fears, as evidenced by the Atlanta Fed GDP tracker falling below 1% annualized in Q2). This sees front end yields back near recent highs whilst the rest of the major benchmark tenors are off highs but sit above 3% across the curve.
- 2YY +2.3bps at 2.749%, 5YY +3.3bps at 3.018%, 10YY +4.2bps at 3.016%, 30YY +3.8bps at 3.161%.
- TYU2 trade 10 ticks lower at 118-03+ but well within ranges of the past two days, with average volumes. Yesterday’s low of 117-22+ forms initial support after which it could ultimately open a bear trigger at 116-21 (May 9 low).
- Bond issuance: US Tsy $33B 10Y note CMB auction (91282CEP2) – 1300ET
- Bill issuance: US Tsy $30B 119D bill auction – 1130ET
- Data limited to weekly MBA mortgage applications plus wholesale finalised inventories and sales for April.
STIR FUTURES: Fed Hike Expectations In Wait And See Mode
- Fed hike expectations sit little changed from yesterday, with the 202bps over the five meetings to year-end showing little reaction to equivalent ECB-dated OIS firming to 131bps (between 124-128bp for much of yesterday) on the way to 199bps with the May’23 meeting.
- Nearer-term meetings sit at a familiar 51bp for Jun, 102bp for Jul and 143bp for Sep, the latter cooling from highs of 145bps yesterday but within the range of the past five days.
- Data limited to MBA mortgage apps and whole inventories today before tomorrow’s ECB decision and Friday’s US CPI.
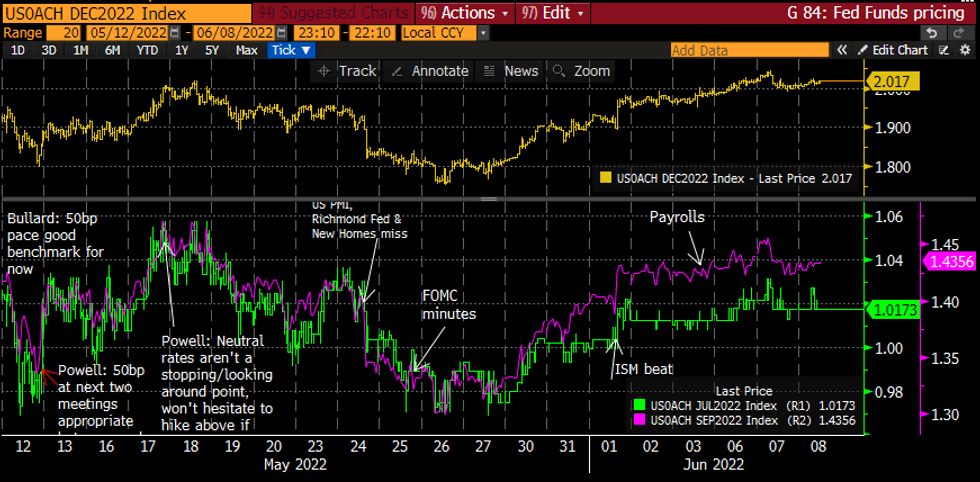 Cumulative hikes implied by FOMC-dated Fed Funds futuresSource: Bloomberg
EGB/GILT SUMMARY: Weaker Trading Ahead of ECB Meeting Tomorrow
European government bonds have traded weaker this morning while equities have inched lower and the dollar has made incremental gains against G10 FX.
- Gilts have traded lower with yields up 3-4bp on the day.
- Bund yields have pushed up 4-5bp and are trading near the highs of the morning.
- It is a similar story for OATs where yields are now up 4-6bp and the belly of the curve marginally underperforming.
- BTPs have underperformed core EGBs, particularly in the belly of the curve. Yields are up 5-8bp now.
- The final estimate of Q1 GDP for the euro area was revised higher from the previous reading (5.4% Y/Y vs 5.1% expected, 0.6% Q/Q vs 0.3%).
- Supply this morning came from the UK (Gilt, GBP2.5bn), Germany (Bund, EUR3.266bn allotted) and Portugal (OT, EUR750mn).
- Italy conducted a buyback of BTP Italia bonds.
- Focus turns to the ECB tomorrow with President Lagarde expected to announce the end of net purchases under the APP in early July and indicate that rate lift-off will occur later that month, in line with her recent blog post. With the policy direction well telegraphed at this point, markets will be looking for any indication of a potential 50bp hike.
EUROPE ISSUANCE UPDATE
Gilt auction results
GBP2.50bln of the 1.00% Jan-32 gilt. Avg yield 2.296% (bid-to-cover 2.85x, tail 0.2bp)
Italy buyback results
E536mln of the BTP Italia 0.25% Nov-23 at 104.126. Requested: E772mln
E511mln of the BTP Italia 0.40% Apr-24 at 103.618. Requested: E751mln
E1.953bln of the BTP Italia 1.40% May-25 at 105.305. Requested: E3.316bln
German auction results
E4bln (E3.267bln allotted) of the 0% Feb-32 Bund Avg yield 1.33% (bid-to-cover 1.37x)
Portugal auction results
E750mln of the 0.30% Oct-31 OT Avg yield 2.33% (bid-to-cover 2.68x)
EUROPE OPTION FLOW SUMMARY
Eurozone:
RXN2 153.5c, bought for 8 in 3k
RXQ2 150.50/151.00 cs, sold at 19.5 in 2k
RXQ2 149/146/143p fly, bought for 55 in 2k
RXU2 142.5/140.5/138.5p fly, bought for 9.5 in 5k
Large bobl rolling down Combo:
OEN2 124/128 RR, sold the put at 56.5/57 in 25k
OEN2 123/125 RR, bought the put for 7 in 12.5k
OEN2 123/126 RR, bought the put for 20 in 18.75k
SX7E 17th June 93/95cs, bought for 0.40 and 0.45 in 12k
FOREX: JPY Dive Deepens, 2002 Lows in View
- USD/JPY trades markedly higher for the seventh session in eight, with the pair narrowing in on the Y134 handle as well as the next key upside level at the 2002 highs of Y135.15. The focus in the near-term is on 134.48, a Fibonacci projection. The JPY is weaker against all others in G10, with the EUR/JPY also notable: the cross is nearing Y143.00 and is trading at levels last seen in 2015.
- The latest leg lower for JPY comes as the BoJ governor acknowledged some of the outcry around the weaker currency, but pledged that the BoJ will firmly support the economy with the current monetary easing strategy. He also added that "stable" JPY weakness is a positive for the Japanese economy.
- Aided by the JPY's decline, the greenback is the firmest currency in G10 ahead of the NY crossover, reversing the weakness seen through NY hours on Tuesday. For the USD Index, a rise through 102.84 would mark the strongest USD since May 23rd. The single currency also trades well, rising against most others and receiving a minor tailwind from an unexpected revision higher in Q1 GDP, which doubled to 0.6% on the quarter vs. Exp. 0.3%.
- Data and central speakers are few and far between Wednesday, with the Fed and the ECB both in their respective media blackout periods. US wholesale inventories and trade sales data are the sole highlight at 1500BST/1000ET.
FX OPTIONS: Expiries for Jun08 NY cut 1000ET (Source DTCC)
- EUR/USD: $1.0600(E606mln), $1.0650(E658mln), $1.0680-85(E510mln), $1.0750-60(E880mln), $1.0800(E880mln)
- USD/JPY: Y130.00-15($709mln)
- GBP/USD: $1.2450(Gbp702mln)
- EUR/GBP: Gbp0.8585-95(E662mln)
- NZD/USD: $0.6315(A$1.1bln)
Price Signal Summary - S&P 500 Consolidation Appears To Be A Bull Flag
- In the equity space, S&P E-Minis continue to trade inside its recent range and the current consolidation still appears to be a bull flag formation. If correct, this is a bullish continuation pattern and reinforces current trend conditions. Attention is on the 50-day EMA that intersects at 4178.15 today. A clear break of this average would strengthen a bullish outlook, confirm the bull flag pattern and open 4303.50, the Apr 26/28 high. First key support to watch is 3960.50, May 26 low. EUROSTOXX 50 futures continue to consolidate but are trading closer to recent highs. The S/T outlook remains bullish. A positive theme follows the recent break of the 50-day EMA and scope is seen for a climb towards 3883.00, Apr 21 high and the key resistance at 3944.00, Mar 29 high. S/T support has been defined at 3576.00, May 19 low. Initial support is at 3743.00, the 20-day EMA.
- In FX, EURUSD is unchanged and continues to trade just ahead of resistance marked by the bear channel top, drawn from the Feb 10 high. The resistance intersects at 1.0751 today and remains a key short-term hurdle for bulls. A break would highlight a stronger bullish outlook. A reversal lower would instead open support at 1.0533 initially, May 20 low. Initial support to watch lies at 1.0627, Jun 1 low. GBPUSD found support Tuesday at 1.2431 and this level represents a key short-term level. Attention is still on the key resistance highlighted by the 50-day EMA, at 1.2686 today. A break would strengthen bullish conditions. A reversal lower would expose 1.2317, the May 17 low, if instead 1.2431 is breached. USDJPY continues to climb and extend this week’s rally that has confirmed a resumption of the primary uptrend. The focus is on an extension towards 134.48, 1.236 projection of the Feb 24 - Mar 28 - 31 price swing.
- On the commodity front, Gold is in consolidation mode. Firm resistance is still seen at the 50-day EMA, which intersects at $1873.4 today. A break of this average is required to suggest scope for a stronger recovery. For bears, a reversal lower would refocus attention on the key support and bear trigger at $1787.0, May 16 low. Initial support to watch is unchanged at $1828.6, Jun 1 low. In the Oil space, WTI futures remain bullish and the contract is holding on to its recent gains. Price is back above the $120.00 handle, a continuation higher would open $122.00.
- In the FI space, Bund futures remain soft following recent weakness and the breach of support at 150.97, May 9 low. The contract has also traded through 150.00. The focus is on 148.23, the Jun 10, 2015 low (cont). Gilts remains in a clear downtrend and further downside is likely near-term. The focus is on 114.08, 2.236 projection of the May 19 - 24 - 26 price swing.
EQUITIES: Mixed European Performance After Asia Closes Stronger
- Asian stocks closed higher: Japan's NIKKEI closed up 290.34 pts or +1.04% at 28234.29 and the TOPIX ended 22.95 pts higher or +1.18% at 1969.98. China's SHANGHAI closed up 22.03 pts or +0.68% at 3263.793 and the HANG SENG ended 482.92 pts higher or +2.24% at 22014.59.
- European equities are mixed, with few discernable themes (Energy and Tech are leading, Financials and Consumer Staples lagging): the German Dax down 28.14 pts or -0.19% at 14530.97, FTSE 100 up 3.8 pts or +0.05% at 7601.13, CAC 40 down 13.01 pts or -0.2% at 6486.79 and Euro Stoxx 50 up 3.23 pts or +0.08% at 3810.79.
- U.S. futures are a little weaker, with the Dow Jones mini down 130 pts or -0.39% at 33034, S&P 500 mini down 15 pts or -0.36% at 4143.75, NASDAQ mini down 32.25 pts or -0.25% at 12680.
COMMODITIES: WTI Edges Back Above $120
- WTI Crude up $0.9 or +0.75% at $120.22
- Natural Gas up $0.06 or +0.61% at $9.343
- Gold spot down $5.03 or -0.27% at $1847.48
- Copper down $1.85 or -0.42% at $441.75
- Silver down $0.24 or -1.06% at $22.0009
- Platinum down $4.95 or -0.49% at $1009.56
LOOK AHEAD:
| Date | GMT/Local | Impact | Flag | Country | Event |
| 08/06/2022 | 1100/0700 | ** |  | US | MBA Weekly Applications Index |
| 08/06/2022 | 1400/1000 | ** | | US | Wholesale Trade |
| 08/06/2022 | 1430/1030 | ** | | US | DOE weekly crude oil stocks |
| 08/06/2022 | 1530/1130 | * | | US | US Treasury Auction Result for Cash Management Bill |
| 08/06/2022 | 1700/1300 | ** | | US | US Note 10 Year Treasury Auction Result |
| 09/06/2022 | 2301/0001 | * |  | UK | RICS House Prices |
| 09/06/2022 | 0600/0800 | ** |  | SE | Private Sector Production |
| 09/06/2022 | 1145/1345 | *** |  | EU | ECB Deposit Rate |
| 09/06/2022 | 1145/1345 | *** | | EU | ECB Main Refi Rate |
| 09/06/2022 | 1145/1345 | *** | | EU | ECB Marginal Lending Rate |
| 09/06/2022 | - | *** |  | CN | Trade |
| 09/06/2022 | 1230/0830 | ** | | US | WASDE Weekly Import/Export |
| 09/06/2022 | 1230/0830 | ** | | US | Jobless Claims |
| 09/06/2022 | 1230/1430 | | EU | ECB Press Conference Following Governing Council Meeting | |
| 09/06/2022 | 1400/1000 |  | CA | BOC Financial System Review | |
| 09/06/2022 | 1430/1030 | ** | | US | Natural Gas Stocks |
| 09/06/2022 | 1500/1100 | | CA | BOC Governor press conference | |
| 09/06/2022 | 1530/1130 | * | | US | US Bill 08 Week Treasury Auction Result |
| 09/06/2022 | 1530/1130 | ** | | US | US Bill 04 Week Treasury Auction Result |
| 09/06/2022 | 1700/1300 | *** | | US | US Treasury Auction Result for 30 Year Bond |
Why MNI
MNI is the leading provider
of intelligence and analysis on the Global Fixed Income, Foreign Exchange and Energy markets. We use an innovative combination of real-time analysis, deep fundamental research and journalism to provide unique and actionable insights for traders and investors. Our "All signal, no noise" approach drives an intelligence service that is succinct and timely, which is highly regarded by our time constrained client base.Our Head Office is in London with offices in Chicago, Washington and Beijing, as well as an on the ground presence in other major financial centres across the world.