
Free Trial
Why MNI
MNI is the leading provider
of intelligence and analysis on the Global Fixed Income, Foreign Exchange and Energy markets. We use an innovative combination of real-time analysis, deep fundamental research and journalism to provide unique and actionable insights for traders and investors. Our "All signal, no noise" approach drives an intelligence service that is succinct and timely, which is highly regarded by our time constrained client base.Our Head Office is in London with offices in Chicago, Washington and Beijing, as well as an on the ground presence in other major financial centres across the world.
AUSTRALIA DATA
Australia's May monthly CPI was stronger than expected. It printed at 4.0% y/y, versus 3.8% forecast and 3.66% prior. This is the firmest y/y print since Nov last year. Base effects played a role given the May y/y 2023 read eased to 5.5% from 6.7%. Still, underlying inflation trends aren't favorable for a near term dovish RBA policy pivot. Indeed, the market will remain wary of renewed tightening risks. We get the full Q2 CPI print at the end of July ahead of the next RBA meeting on Aug 6.
- The chart below plots the headline monthly CPI, the core CPI, which the ABS defines as excluding volatile items and holiday travel, as well as the trimmed mean.
- Whilst one month data point doesn't make a trend, as the chart suggests, underlying trends aren't gravitating towards the RBA's 2-3% target band.
- In terms of the detail, the ABS noted: "The most significant contributors to the annual rise to May were Housing (+5.2 per cent), Food and non-alcoholic beverages (+3.3 per cent), Transport (+4.9 per cent), and Alcohol and tobacco (+6.7 per cent)."
- The only negative category was household furnishings at -1.1%y/y (versus -0.8% in April).
Fig 1: Australian Monthly CPI Trends - Y/Y
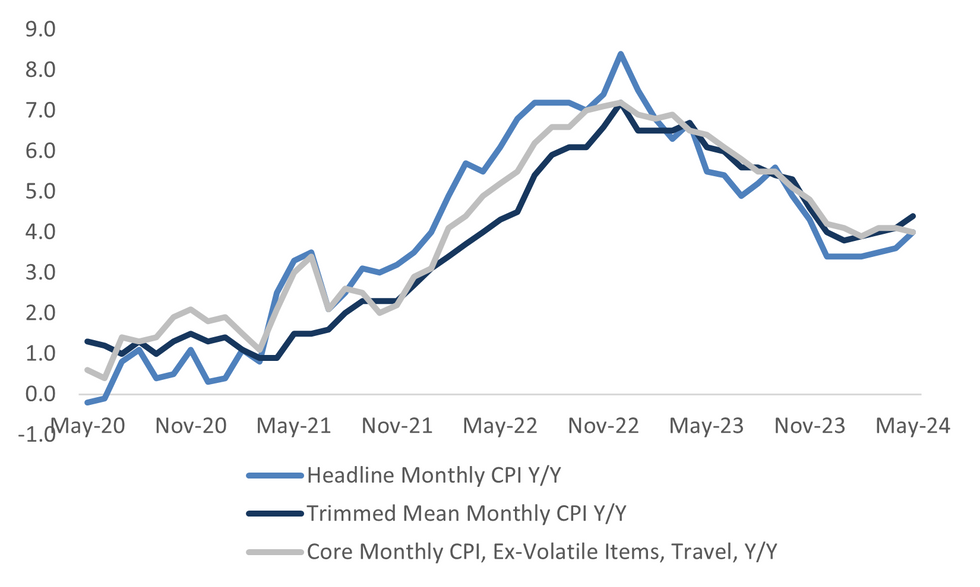
Source: ABS/MNI - Market News
Why MNI
MNI is the leading provider
of intelligence and analysis on the Global Fixed Income, Foreign Exchange and Energy markets. We use an innovative combination of real-time analysis, deep fundamental research and journalism to provide unique and actionable insights for traders and investors. Our "All signal, no noise" approach drives an intelligence service that is succinct and timely, which is highly regarded by our time constrained client base.Our Head Office is in London with offices in Chicago, Washington and Beijing, as well as an on the ground presence in other major financial centres across the world.
We are facing technical issues, please contact our team.
ok
Your request was sent sucessfully! Our team will contact you soon.
ok