
Free Trial
Why MNI
MNI is the leading provider
of intelligence and analysis on the Global Fixed Income, Foreign Exchange and Energy markets. We use an innovative combination of real-time analysis, deep fundamental research and journalism to provide unique and actionable insights for traders and investors. Our "All signal, no noise" approach drives an intelligence service that is succinct and timely, which is highly regarded by our time constrained client base.Our Head Office is in London with offices in Chicago, Washington and Beijing, as well as an on the ground presence in other major financial centres across the world.
US OUTLOOK/OPINION
The stark divergence between June's main Services activity barometers has raised the question of which is the "true" indicator of what is happening in the services sector: is it the S&P Global PMI which came in at a 2+ year high 55.3 in the final data, or the ISM Services PMI which at 48.8 was the weakest in 4+ years (May 2020).
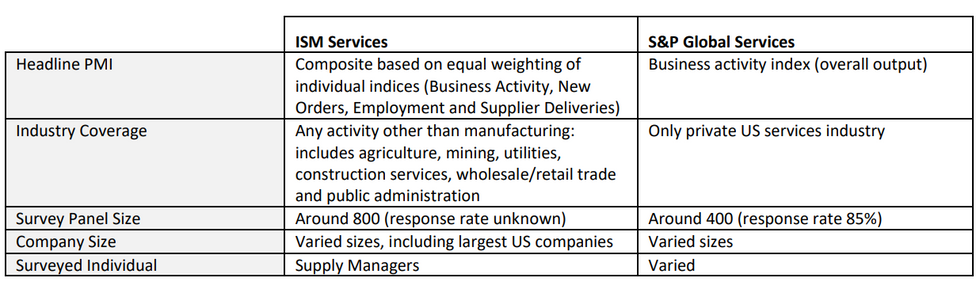
- We looked at the divergence between the two surveys back in 2022, in a different context: then, as has been the case for most of the pandemic reopening period, the S&P PMI painted a weaker picture of the services sector than the ISM index. Our report on the differing methodologies is here. A few key differences in the two reports (as of 2022 when we published our note):
- Industry coverage: The ISM comprises any activity other than manufacturing: agriculture, mining, utilities, construction services, wholesale/retail trade and public administration. This is significantly broader than the S&P index, which incorporates solely the private US services industry. This may well be a big factor in the ISM/PMI difference, as note the ISM report showed growth in the following sectors: "Other Services; Management of Companies & Support Services; Health Care & Social Assistance; Construction; Utilities; Finance & Insurance; Educational Services; and Professional, Scientific & Technical Services" with decreases in "Agriculture, Forestry, Fishing & Hunting; Real Estate, Rental & Leasing; Mining; Retail Trade; Public Administration; Wholesale Trade; Transportation & Warehousing; and Information".
- Company Size: Both reports express that they ensure that small, medium and large businesses are weighted and represented appropriately. Anecdotal evidence suggests that the ISM index is more weighted towards large companies.
- Index definition: The S&P Global index is a business activity (output) index alone vs ISM’s weighted approach. That said, the ISM's activity/production reading was very weak at 49.6, an 11.6 point drop, so that's probably not a point of divergence between the two reports.
- Survey panel: The ISM survey looks at a panel of around 800, whilst S&P Global has a panel of 400. As the ISM does not publish the response rate, these are not distinctly comparable and data quality cannot easily be commented on. Both indexes stress having balanced geographical representation. The individuals surveyed at each firm also vary. The ISM solely queries purchasing managers, who are largely focused on stock inflows and production levels, whilst the broader interviewing process by S&P Global includes responses from finance / c-level roles.
 Source: MNI
Why MNI
MNI is the leading provider
of intelligence and analysis on the Global Fixed Income, Foreign Exchange and Energy markets. We use an innovative combination of real-time analysis, deep fundamental research and journalism to provide unique and actionable insights for traders and investors. Our "All signal, no noise" approach drives an intelligence service that is succinct and timely, which is highly regarded by our time constrained client base.Our Head Office is in London with offices in Chicago, Washington and Beijing, as well as an on the ground presence in other major financial centres across the world.
We are facing technical issues, please contact our team.
ok
Your request was sent sucessfully! Our team will contact you soon.
ok