-
Policy
Policy
Exclusive interviews with leading policymakers that convey the true policy message that impacts markets.
LATEST FROM POLICY: -
EM Policy
EM Policy
Exclusive interviews with leading policymakers that convey the true policy message that impacts markets.
LATEST FROM EM POLICY: -
G10 Markets
G10 Markets
Real-time insight on key fixed income and fx markets.
Launch MNI PodcastsFixed IncomeFI Markets AnalysisCentral Bank PreviewsFI PiFixed Income Technical AnalysisUS$ Credit Supply PipelineGilt Week AheadGlobal IssuanceEurozoneUKUSDeep DiveGlobal Issuance CalendarsEZ/UK Bond Auction CalendarEZ/UK T-bill Auction CalendarUS Treasury Auction CalendarPolitical RiskMNI Political Risk AnalysisMNI Political Risk - US Daily BriefMNI Political Risk - The week AheadElection Previews -
Emerging Markets
Emerging Markets
Real-time insight of emerging markets in CEMEA, Asia and LatAm region
-
Commodities
-
Credit
Credit
Real time insight of credit markets
-
Data
-
Global Macro
Global Macro
Actionable insight on monetary policy, balance sheet and inflation with focus on global issuance. Analysis on key political risk impacting the global markets.
Global MacroDM Central Bank PreviewsDM Central Bank ReviewsEM Central Bank PreviewsEM Central Bank ReviewsBalance Sheet AnalysisData AnalysisEurozone DataUK DataUS DataAPAC DataInflation InsightEmployment InsightGlobal IssuanceEurozoneUKUSDeep DiveGlobal Issuance Calendars EZ/UK Bond Auction Calendar EZ/UK T-bill Auction Calendar US Treasury Auction Calendar Global Macro Weekly -
About Us
To read the full story
Sign up now for free trial access to this content.
Please enter your details below.
Why MNI
MNI is the leading provider
of intelligence and analysis on the Global Fixed Income, Foreign Exchange and Energy markets. We use an innovative combination of real-time analysis, deep fundamental research and journalism to provide unique and actionable insights for traders and investors. Our "All signal, no noise" approach drives an intelligence service that is succinct and timely, which is highly regarded by our time constrained client base.Our Head Office is in London with offices in Chicago, Washington and Beijing, as well as an on the ground presence in other major financial centres across the world.
Real-time Actionable Insight
Get the latest on Central Bank Policy and FX & FI Markets to help inform both your strategic and tactical decision-making.
Free AccessPowell Aside, A Shift Up In FOMC's Longer-Run Dot Is Already Underway (1/2)
As noted in our Jackson Hole preview, r-star doesn’t seem like a topic Powell would want to bring up in his keynote today in any amount of depth. The general path of market-implied rates is probably closely aligned enough with the FOMC’s guidance that he won’t want to risk stirring up uncertainty by suddenly guiding to a higher longer-run estimate. In general Powell has been open to countenancing the possibility of a higher r-star but has been reluctant to put much stock in r-star estimates (“you can't estimate it with great precision”).
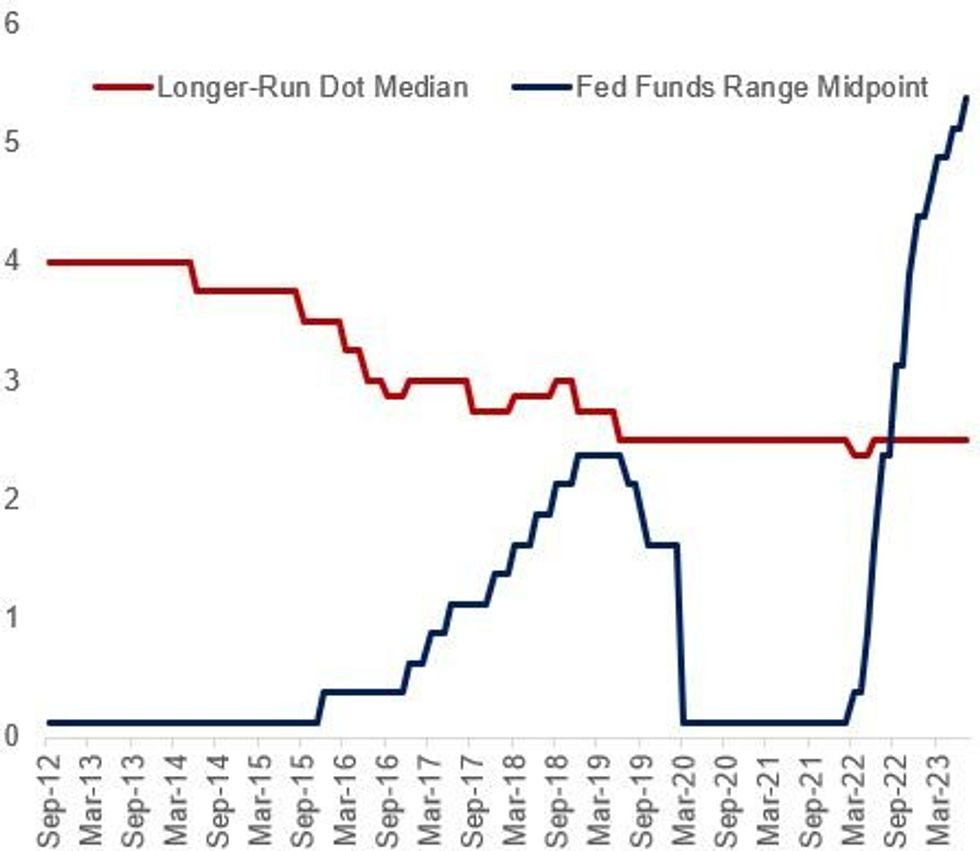
- His 2018 experience is something of a cautionary tale - his Jackson Hole address that year pointed out that “Guiding policy by the stars in practice...has been quite challenging of late because our best assessments of the location of the stars have been changing significantly.” He followed this up in October 2018 by saying that the Fed is “a long way from neutral” at a time when the Fed funds rate was 2-2.25% vs a 3% long-range estimate. The market took this very hawkishly and the Fed would only achieve one more rate hike in the cycle before starting to cut in H2 2019.
- There doesn’t seem to be near enough consensus on this topic within the FOMC. Even NY Fed Pres Williams - whose name is actually on the benchmark Williams-Laubach r-star estimate - has little strong conviction in where the neutral rate lies, though while he thinks it's on the low side and is roughly the same as pre-pandemic (and 0.5% in Q1 2023), estimates "are very imprecise and subject to real-time measurement error."
- The FOMC median longer-run Fed funds rate in the quarterly Dot Plot since mid-2019 has been 2.5% - or roughly 0.5% r-star plus 2% inflation. Some current and ex-FOMC members have opined on the topic in the past couple of years, mainly to suggest that r-star has risen for various structural factors. The distribution of the dots has risen - as of June's SEP there are now only 3 participants who now have their longer-run Dot below 2.5% - in March there were 5. Above 2.50% are 7 dots, vs just 4 in March.
- So the FOMC is headed in that direction - but we doubt it will be the centerpiece of Powell's speech (though have included a relevant "Instant Answers" question, just in case).
- Per MNI's interview with him yesterday at Jackson Hole, Philadelphia Fed Pres Harker is unlikely to be among those raising their dots in coming meetings: asked whether r-star has risen, he said "At this point we still think it’s around 0.5%, adding 2% inflation, in the long run you get to 2.5%...has [the pandemic] fundamentally shifted r-star. I don’t know the answer to that but at this point I’m leaning toward saying, not a lot."

To read the full story
Sign up now for free trial access to this content.
Please enter your details below.
Why MNI
MNI is the leading provider
of intelligence and analysis on the Global Fixed Income, Foreign Exchange and Energy markets. We use an innovative combination of real-time analysis, deep fundamental research and journalism to provide unique and actionable insights for traders and investors. Our "All signal, no noise" approach drives an intelligence service that is succinct and timely, which is highly regarded by our time constrained client base.Our Head Office is in London with offices in Chicago, Washington and Beijing, as well as an on the ground presence in other major financial centres across the world.
