
Free Trial
Why MNI
MNI is the leading provider
of intelligence and analysis on the Global Fixed Income, Foreign Exchange and Energy markets. We use an innovative combination of real-time analysis, deep fundamental research and journalism to provide unique and actionable insights for traders and investors. Our "All signal, no noise" approach drives an intelligence service that is succinct and timely, which is highly regarded by our time constrained client base.Our Head Office is in London with offices in Chicago, Washington and Beijing, as well as an on the ground presence in other major financial centres across the world.
CHINA DATA
China Q2 GDP was weaker than forecast. Rising 0.7% q/q, versus 0.9% forecast (prior was 1.6%). The y/y print was 4.7%, versus 5.1% forecast and 5.3% prior.
- The q/q rise of 0.7% was the weakest since the 2.1% dip in Q2 2022 (last year we saw a 0.8%q/q rise). The y/y pace was the slowest since the start of 2023. This is likely to keep stimulus calls alive, particularly in light of recent credit/inflation data outcomes.
- In terms of the June monthly activity data it was a familiar trend in terms of outcomes. The weak point came in terms of retail sales, which rose 2.0% y/y, versus 3.4% forecast, 3.7% was the prior outcome. Retail spend is back to the late 2022 pace.
- IP growth was 5.3% y/y, versus 5.0% forecast and 5.6% prior. Fixed asset investment was 3.9% ytd y/y, in line with forecasts.
- Property investment was -10.1% ytd y/y, slightly better than forecast but in line with the May outcome. Sale were -26.9% ytd y/y, versus -30.5% in May, so some slight improvement as eased purchased restrictions has spurred more positive transactions in some cities.
- Earlier data showed house prices still falling but at a reduced pace, but we remain some distance from turning positive.
Fig 1: China Industrial Production & Retail Sales Y/Y
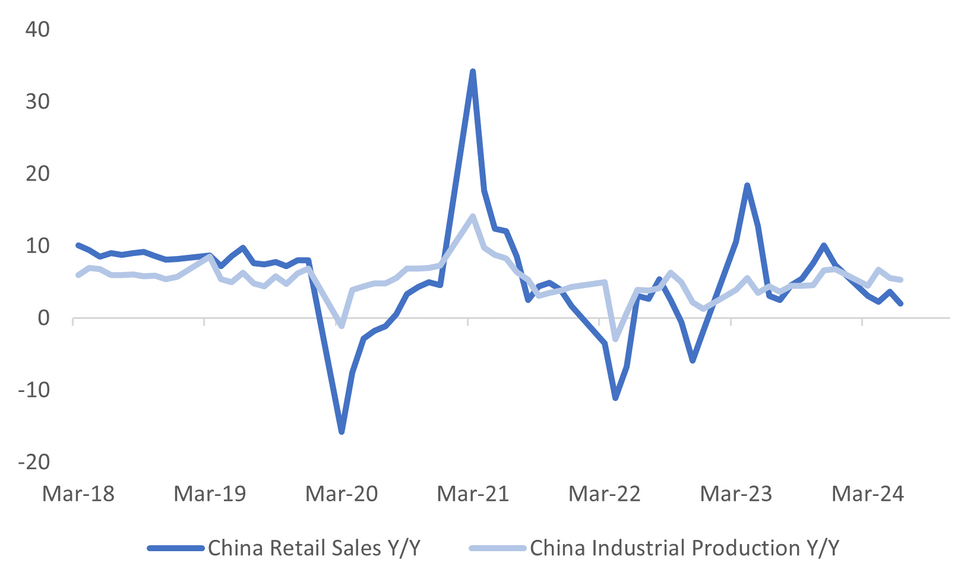
Source: MNI - Market News/Bloomberg
Why MNI
MNI is the leading provider
of intelligence and analysis on the Global Fixed Income, Foreign Exchange and Energy markets. We use an innovative combination of real-time analysis, deep fundamental research and journalism to provide unique and actionable insights for traders and investors. Our "All signal, no noise" approach drives an intelligence service that is succinct and timely, which is highly regarded by our time constrained client base.Our Head Office is in London with offices in Chicago, Washington and Beijing, as well as an on the ground presence in other major financial centres across the world.
We are facing technical issues, please contact our team.
ok
Your request was sent sucessfully! Our team will contact you soon.
ok