
Free Trial
Why MNI
MNI is the leading provider
of intelligence and analysis on the Global Fixed Income, Foreign Exchange and Energy markets. We use an innovative combination of real-time analysis, deep fundamental research and journalism to provide unique and actionable insights for traders and investors. Our "All signal, no noise" approach drives an intelligence service that is succinct and timely, which is highly regarded by our time constrained client base.Our Head Office is in London with offices in Chicago, Washington and Beijing, as well as an on the ground presence in other major financial centres across the world.
Executive summary:
- S&P E-minis faced strong selling pressure Monday. However the contract has recovered from its 4293.75 low.
- The bear cycle is currently 11 trading days old and the recent move lower highlights a number of key technical developments that signal the potential for a deeper retracement.
- It is also possible however that we will again see a relatively shallow correction unfold ahead of a resumption of the primary bull trend - this has occurred on a number of occasions this year.
S&P E-minis faced strong selling pressure Monday. However the contract has recovered from its 4293.75 low. The bear cycle is currently 11 trading days old and the recent move lower highlights a number of key technical developments that signal the potential for a deeper retracement. It is also possible however that we will again see a relatively shallow correction unfold ahead of a resumption of the primary bull trend - this has occurred on a number of occasions this year. The key technical points to note are:
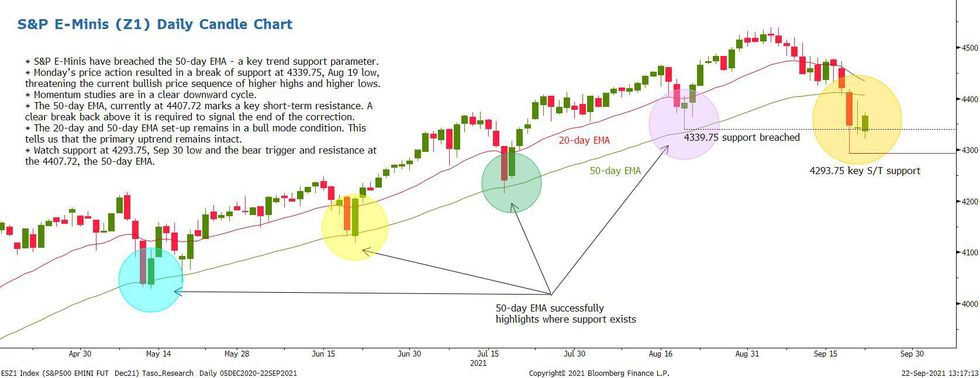
- Monday's weakness resulted in a break of the key 50-day EMA. We have discussed this average before given that it has played a key role in determining where support likely exists in this contract once a corrective pullback unfolds. The chart highlights recent phases where this EMA has successfully halted a corrective pullback.
- Monday's price action also resulted in a clear break of support at 4339.75, Aug 19 low. This highlights a threat to the current bullish price sequence of higher highs and higher lows.
- Furthermore, momentum studies are currently in a clear downward cycle, reinforcing a bearish risk.
- The 50-day EMA, currently at 4407.72 marks a key short-term resistance and while price remains below it, a bearish risk remains present.
- A clear break back above the EMA and an ability to hold above it, would provide a strong short-term signal that Monday's low is not just a key support but also a reversal point marking the end of the recent corrective sell-off. Attention would shift to the all-time high of 4539.50, Sep 3 hig. A break of this hurdle would confirm a resumption of the primary uptrend.
- It is worth noting that the 20-day and 50-day EMA set-up remains in a bull mode condition despite the recent move lower. This tells us that the primary uptrend remains intact.
- Watch support at 4293.75 and resistance at the 4407.72 EMA level.
MNI London Bureau | +44 203-865-3809 | edward.hardy@marketnews.com
Why MNI
MNI is the leading provider
of intelligence and analysis on the Global Fixed Income, Foreign Exchange and Energy markets. We use an innovative combination of real-time analysis, deep fundamental research and journalism to provide unique and actionable insights for traders and investors. Our "All signal, no noise" approach drives an intelligence service that is succinct and timely, which is highly regarded by our time constrained client base.Our Head Office is in London with offices in Chicago, Washington and Beijing, as well as an on the ground presence in other major financial centres across the world.
We are facing technical issues, please contact our team.
ok
Your request was sent sucessfully! Our team will contact you soon.
ok