
Free Trial
Why MNI
MNI is the leading provider
of intelligence and analysis on the Global Fixed Income, Foreign Exchange and Energy markets. We use an innovative combination of real-time analysis, deep fundamental research and journalism to provide unique and actionable insights for traders and investors. Our "All signal, no noise" approach drives an intelligence service that is succinct and timely, which is highly regarded by our time constrained client base.Our Head Office is in London with offices in Chicago, Washington and Beijing, as well as an on the ground presence in other major financial centres across the world.
EQUITIES
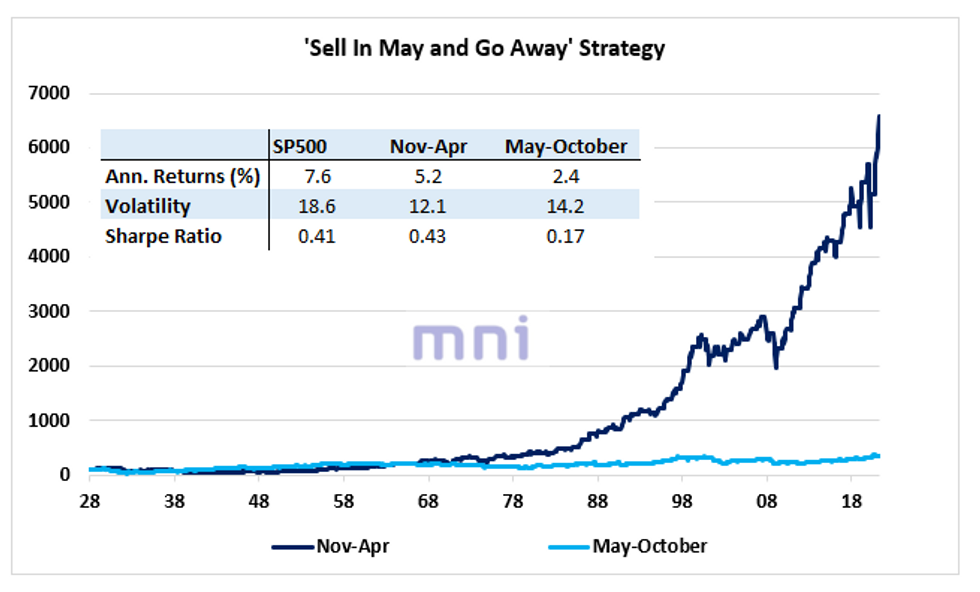
- Historically, the 'Sell in May and Go Away' has been a popular Wall Street adage that refers to a period between May and October when the market on average underperforms the prior six months.
- The chart below shows the equity curve of the performance of US equities (since January 1928) during the Summer period, which runs from May to October, and the Winter period, which runs from November to April.
- The divergence is striking; while the SP500 has averaged annual returns of 5.2% during the Winter period for a volatility of 12.1%, US stocks 'only' averaged a 2.2% annual return during the Summer period (annualized return of the SP500 during the whole periods is 7.6% for a Sharpe ratio of 0.41).
- The difference is even bigger for Japanese and European equities, which both average negative annualized returns during the Summer period (the times series are much shorter for both markets).
- Will the rise in global liquidity offset the traditional slower momentum in equities this summer?
Source: Bloomberg
Why MNI
MNI is the leading provider
of intelligence and analysis on the Global Fixed Income, Foreign Exchange and Energy markets. We use an innovative combination of real-time analysis, deep fundamental research and journalism to provide unique and actionable insights for traders and investors. Our "All signal, no noise" approach drives an intelligence service that is succinct and timely, which is highly regarded by our time constrained client base.Our Head Office is in London with offices in Chicago, Washington and Beijing, as well as an on the ground presence in other major financial centres across the world.
We are facing technical issues, please contact our team.
ok
Your request was sent sucessfully! Our team will contact you soon.
ok