
Free Trial
Why MNI
MNI is the leading provider
of intelligence and analysis on the Global Fixed Income, Foreign Exchange and Energy markets. We use an innovative combination of real-time analysis, deep fundamental research and journalism to provide unique and actionable insights for traders and investors. Our "All signal, no noise" approach drives an intelligence service that is succinct and timely, which is highly regarded by our time constrained client base.Our Head Office is in London with offices in Chicago, Washington and Beijing, as well as an on the ground presence in other major financial centres across the world.
US TSYS
Bloomberg’s U.S. Tsy liquidity index warrants attention.
- While operating off multi-year peaks, the index sits above levels seen around the time of the initial COVID outbreak in ’20, hardly a sign of a well-functioning market.
- Fallout from the sharper-than-expected QT tapering announcement at yesterday’s FOMC decision ($35bn reduction in the monthly cap for Tsy sales vs. $30bn that was widely expected) will be in focus during the coming months.
- What guided the Fed’s decision to provide a more aggressive QT taper than almost everyone expected? We don’t know, the post-meeting line of questioning on the topic was weak to non-existent.
- Meanwhile, there was a lack of detail/further explanation surrounding Fed deliberations and any guidance from the SOMA desk.
- We would point to the liquidity measure flagged above as a potential ‘tell’ for at least some of the Fed's thinking.
- This also comes after the Treasury recently formalised its buyback schedule with a focus on liquidity management.
- Note that some sell-side names have tweaked their calls re: the length of the QT scheme, seeing yesterday’s move as a step towards prolonging the Fed’s balance sheet rundown.
Fig .1: Bloomberg U.S. Tsy Liquidity Index
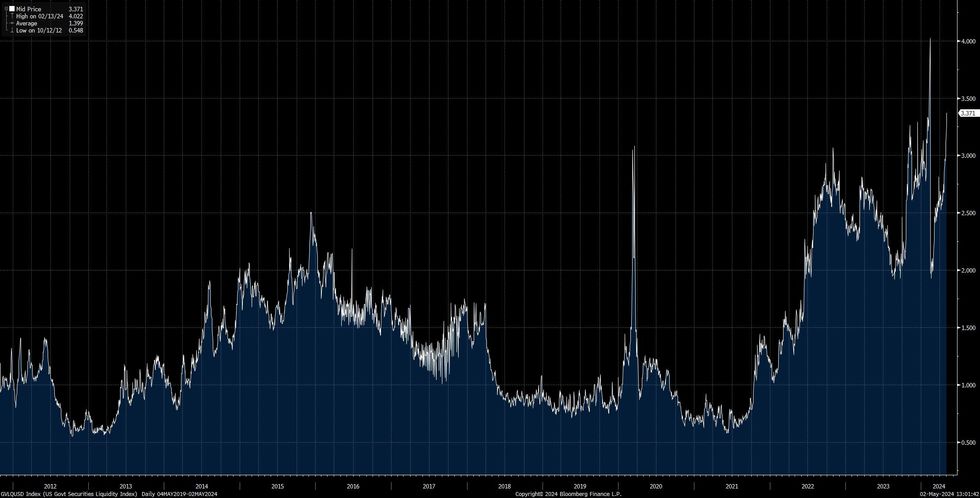 Source: MNI - Market News/Bloomberg
MNI London Bureau | +44 0203-865-3809 | anthony.barton@marketnews.com
Why MNI
MNI is the leading provider
of intelligence and analysis on the Global Fixed Income, Foreign Exchange and Energy markets. We use an innovative combination of real-time analysis, deep fundamental research and journalism to provide unique and actionable insights for traders and investors. Our "All signal, no noise" approach drives an intelligence service that is succinct and timely, which is highly regarded by our time constrained client base.Our Head Office is in London with offices in Chicago, Washington and Beijing, as well as an on the ground presence in other major financial centres across the world.
We are facing technical issues, please contact our team.
ok
Your request was sent sucessfully! Our team will contact you soon.
ok