
Why MNI
MNI is the leading provider
of intelligence and analysis on the Global Fixed Income, Foreign Exchange and Energy markets. We use an innovative combination of real-time analysis, deep fundamental research and journalism to provide unique and actionable insights for traders and investors. Our "All signal, no noise" approach drives an intelligence service that is succinct and timely, which is highly regarded by our time constrained client base.Our Head Office is in London with offices in Chicago, Washington and Beijing, as well as an on the ground presence in other major financial centres across the world.
FI markets remain in a clear downtrend. Trend conditions are oversold though - this is clearly displayed by a 14- day RSI. Moving average studies are also effective in assessing the position of price relative to its trend and how overstretched that trend is.
- A 20-day and a 50-day EMA highlights; the direction of the trend, where strong support and resistance might exist and how oversold/overbought the trend is.
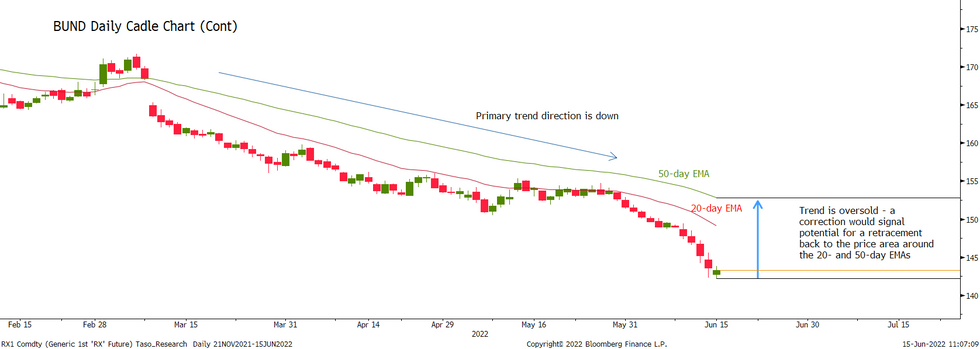
The chart above - daily Bund continuation candle chart - displays the following important technical trend features and note, these conditions appear across a number of FI contracts.
- The trend is clearly bearish. The position of the two EMAs - 20 day below the 50 day - confirm a negative sloping trend and therefore a bearish one.
- Resistance is important in a downtrend. The 20 day and 50 day EMAs highlight potential resistance in the trend. Furthermore, the area between the two averages is regarded as a firm trend resistance zone.
- Finally the averages also highlight the point where the ‘rational’ component of the trend exists, in price terms. Price doesn't deviate from the averages for very long periods, before correcting back towards its 20- and 50-day EMAs. This correction allows an oversold reading to unwind before the trend can again resume.
Current price levels suggest the deviation from the EMAs is significant and therefore the trend is oversold. The risk is that price volatility may increase and a sudden reaction higher towards the two EMAs would not be a surprise. If this occurs, it would represent a healthy correction. This is worth bearing in mind ahead of today’s risk events.
With FI markets oversold, the following resistance levels are important:
- BUND (U2):
- RES 1: 147.22 38.2% retracement of the May 26 - Jun 15 range
- RES 2: 149.98 20-day EMA and the first key trendline resistance
- Gilts (U2):
- RES 1: 114.09 38.2% retracement of the May 24 - Jun 14 range
- RES 2: 115.38 20-day EMA and a key resistance
- Treasuries (U2):
- RES 1: 116-21+ 38.2% retracement of the May 26 - Jun 14 low range
- RES 2: 117-30+ 20-day EMA and a key trendline resistance
Why MNI
MNI is the leading provider
of intelligence and analysis on the Global Fixed Income, Foreign Exchange and Energy markets. We use an innovative combination of real-time analysis, deep fundamental research and journalism to provide unique and actionable insights for traders and investors. Our "All signal, no noise" approach drives an intelligence service that is succinct and timely, which is highly regarded by our time constrained client base.Our Head Office is in London with offices in Chicago, Washington and Beijing, as well as an on the ground presence in other major financial centres across the world.