
Why MNI
MNI is the leading provider
of intelligence and analysis on the Global Fixed Income, Foreign Exchange and Energy markets. We use an innovative combination of real-time analysis, deep fundamental research and journalism to provide unique and actionable insights for traders and investors. Our "All signal, no noise" approach drives an intelligence service that is succinct and timely, which is highly regarded by our time constrained client base.Our Head Office is in London with offices in Chicago, Washington and Beijing, as well as an on the ground presence in other major financial centres across the world.
Executive Summary:
- The USD has continued to appreciate this year and technical trend signals suggest the bull cycle is likely extend over the medium-term.
- Recent important breakouts in the USD Index and USDJPY and a bearish channel in EURUSD, highlight some important technical features that reinforce the current uptrend in the USD.
- Recent price activity and a look at various charts, highlight a number of potential USD price objectives that are possible in the current cycle.
The USD remains in a clear uptrend and indications are that the path of least resistance remains up and that the USD will continue to appreciate over the medium-term. Recent gains highlight a number of potential price objectives for the USD. This analysis will focus on the USD Index (DXY), EURUSD and USDJPY, discussing price objectives and evaluating a number of important technical factors that highlight and reinforce the current uptrend in the USD.
Major breakout in the USD Index (DXY)
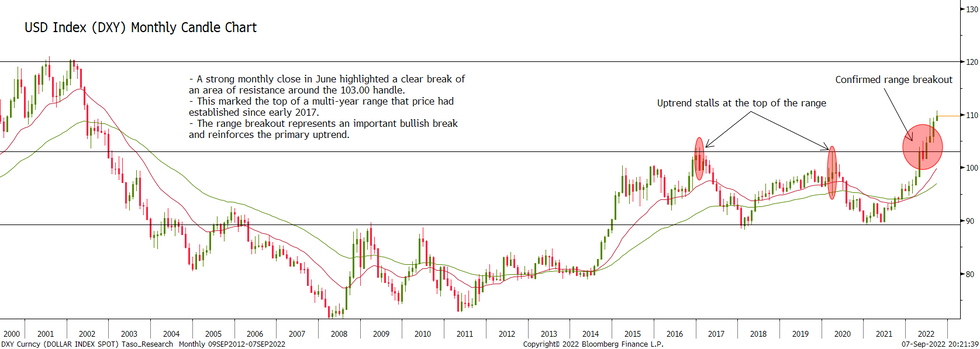
An important technical break occurred in June.
- A strong monthly close in June highlighted a clear break of an area of resistance around the 103.00 handle.
- This marked the top of a multi-year range that price had established since early 2017.
- The range breakout represents an important bullish break and reinforces the primary uptrend.
- Range breakouts allow us to calculate a price objective, once a break is confirmed.
- The height of the range is projected from the breakout to identify, in this case, a long-term objective.
- The projection is 117.00. Note that the range breakout also raises the possibility of an appreciation to the 120.00 handle that was last tested in 2001 and 2002.
To summarise, the DXY has broken out of a multi-year range and this suggests potential for a climb towards 117.00 and 120.00 over the long-term.
A look at the daily trend components
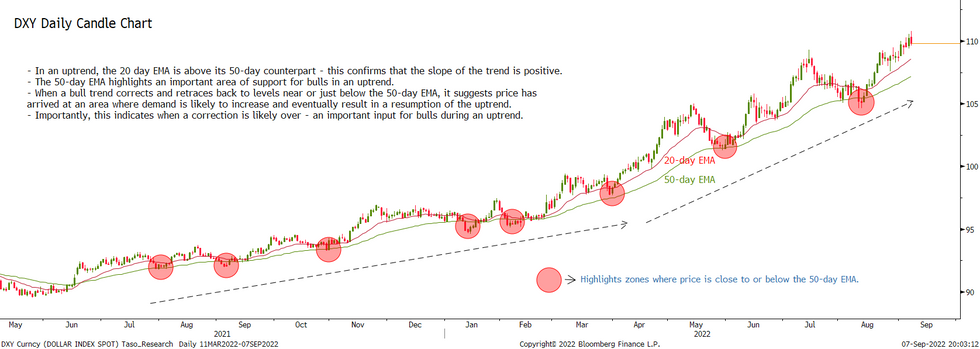
The current uptrend in the DXY started in January 2021 , however, technical trend indicators confirmed a bull cycle in June 2021. A trend tool we monitor is the relationship between the 20- and 50-day EMAs. This indicator highlights the following:
- In an uptrend, the 20 day EMA is above its 50-day counterpart - this confirms that the slope of the trend is positive.
- The 50-day EMA represents an important area of support for bulls in an uptrend.
- When a bull trend corrects and retraces back to levels near or just below the 50-day EMA, it suggests price has arrived at an area where demand is likely to increase and eventually result in a resumption of the uptrend.
- Importantly, this indicates when a correction is likely over - an important input for bulls during an uptrend.
- As long as the 20- and 50-day EMAs remain in a bull mode set-up (the 20-day above the 50-day) and price finds support near the 50-day EMA, the primary uptrend remains firmly intact.
The trend in EURUSD
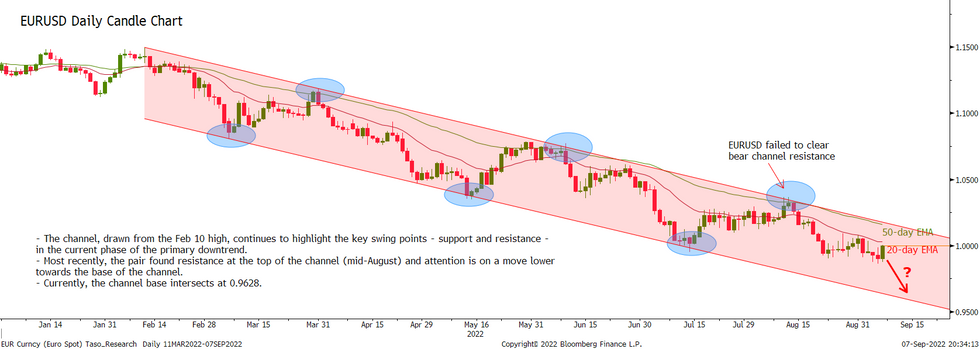
- The immediate trend outlook in EURUSD is unsurprisingly bearish. We’ve recently highlighted a bear channel drawn from the Feb 10 high:
- The channel continues to effectively highlight key swing points - support and resistance - in the current phase of the primary downtrend.
- Recently, the pair found resistance at the top of the channel (mid-August) and attention is on a move lower towards the base of the channel.
- Currently, the channel intersects at 0.9628 and represents the next objective.
- A bullish breakout of the channel would highlight a short-term base. Until then, the current bear cycle remains intact.
A note on the long-term EURUSD chart
Looking at monthly data, the EUR has breached a key Fibonacci retracement - 76.4% of the 2000 - 2008 bull leg, at 1.0073. This suggests that the pair may be on course for an extension lower towards 0.9000.
EURUSD and the point and figure chart (P&F)
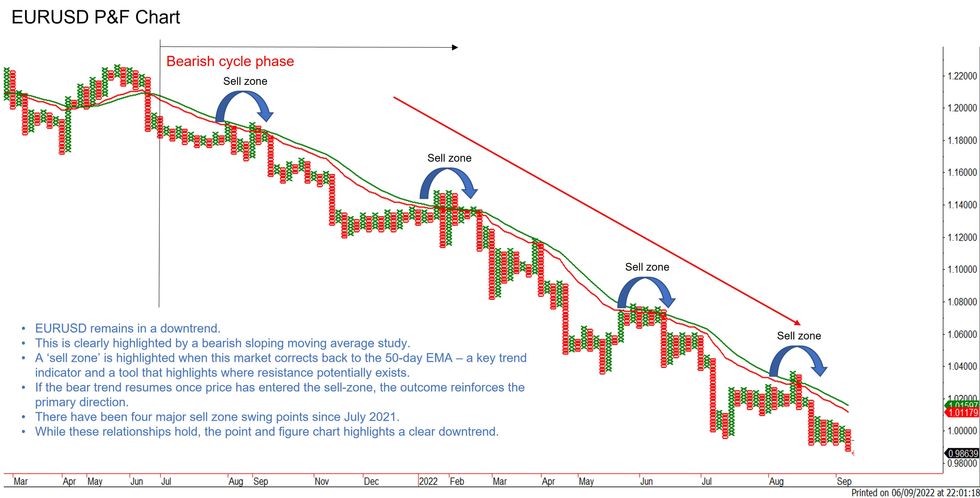
The P&F chart is effective in analysing broader trend conditions once a direction has been established. The following points are relevant:
- EURUSD remains in a downtrend.
- This is clearly highlighted by a bearish sloping moving average study.
- A ‘sell zone’ is highlighted when this market corrects back to the 50-day EMA - a key trend indicator and a tool that highlights where resistance potentially exists.
- If the bear trend resumes once price has entered the sell-zone, the outcome reinforces the primary direction.
- There have been four major sell zone swing points since July 2021.
- While these relationships hold, the point and figure chart highlights a clear downtrend.
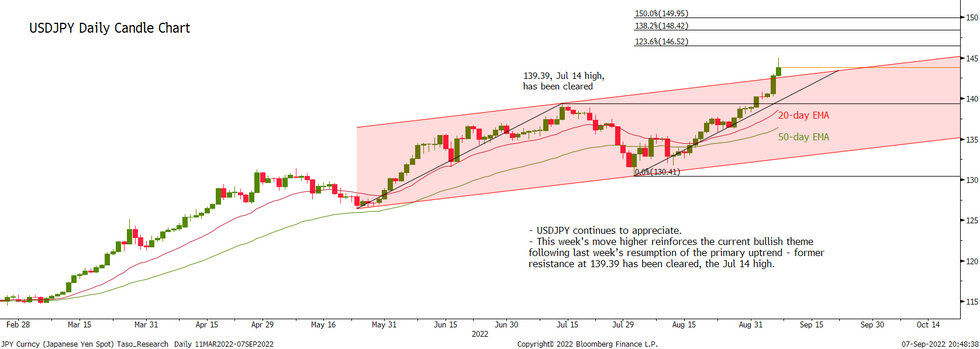
USDJPY primary uptrend extends
This week has seen USDJPY resume its uptrend, extending the bullish breakout that occurred last week - price cleared resistance at 139.39, the Jul 14 high, to confirm a resumption of the primary uptrend. The USD has cleared a number of major resistance points this year and attention is on the 145.00 handle. A breach of this level would strengthen current conditions and looking at Fibonacci projections, would open:
- 146.52 1.236 projection of the May 24 - Jul 14 - Aug 2 price swing
- 148.42 1.382 projection of the May 24 - Jul 14 - Aug 2 price swing
- 150.00 Key psychological resistance
- Note that 147.66 is the August 1998 high and represents an important hurdle for bulls.
Why MNI
MNI is the leading provider
of intelligence and analysis on the Global Fixed Income, Foreign Exchange and Energy markets. We use an innovative combination of real-time analysis, deep fundamental research and journalism to provide unique and actionable insights for traders and investors. Our "All signal, no noise" approach drives an intelligence service that is succinct and timely, which is highly regarded by our time constrained client base.Our Head Office is in London with offices in Chicago, Washington and Beijing, as well as an on the ground presence in other major financial centres across the world.