
Free Trial
Why MNI
MNI is the leading provider
of intelligence and analysis on the Global Fixed Income, Foreign Exchange and Energy markets. We use an innovative combination of real-time analysis, deep fundamental research and journalism to provide unique and actionable insights for traders and investors. Our "All signal, no noise" approach drives an intelligence service that is succinct and timely, which is highly regarded by our time constrained client base.Our Head Office is in London with offices in Chicago, Washington and Beijing, as well as an on the ground presence in other major financial centres across the world.
JPY
In assessing intervention risks for USD/JPY, the authorities may be able to point to the pair's divergence from US-JP yield differentials, as a shift away from fundamentals for the yen. This has been evident in recent weeks, particularly in terms of 10yr nominal government bond yield differentials (see our bullet from earlier). Still other metrics, like rate of change over a short term period, remain below recent extremes, likewise in terms of implied vol levels.
- USD/JPY is still within striking distance of yesterday's fresh cycle high, only around 50pips off, last 161.50/55 in recent dealings. Earlier lows were at 161.14.
- There has been some speculation the upcoming 4th July holiday could prompt a fresh round of intervention during US hours. Liquidity will be lighter during this period, and we did see the authorities likely intervene early in May late during US trading hours (when liquidity was lighter).
- The chart below though shows USD/JPY's rate of change over a 2 week period is only around +1% though, which is sub late April levels,, which were above 2.6%, and we saw higher levels in 2022 during those intervention episodes.
- The other line on the chart, the 1 month rate of change is closer to recent highs, but only marginally. The run up in USD/JPY compared with early June lows is also below the moves we saw in April both in terms of order of magnitude and time spent to achieve the moves, (I.e. >5.5% rally from mid April lows, see this link, which occurred in less than a month).
- Overnight USD/JPY vols are up around +12.54% currently, comfortably off late April highs, although this metric started moving ahead of the BoJ meeting, which was also around that time.
- Of course, intervention risks can't be completely discounted in the near term, the JPY trade weighted index continues to make fresh lows, as another warning post for markets. The Deutsche Bank JPY TWI is a further 2.6% sub late April levels (which occurred prior to that intervention round).
Fig 1: USD/JPY Rolling 2 week and 4 week Changes
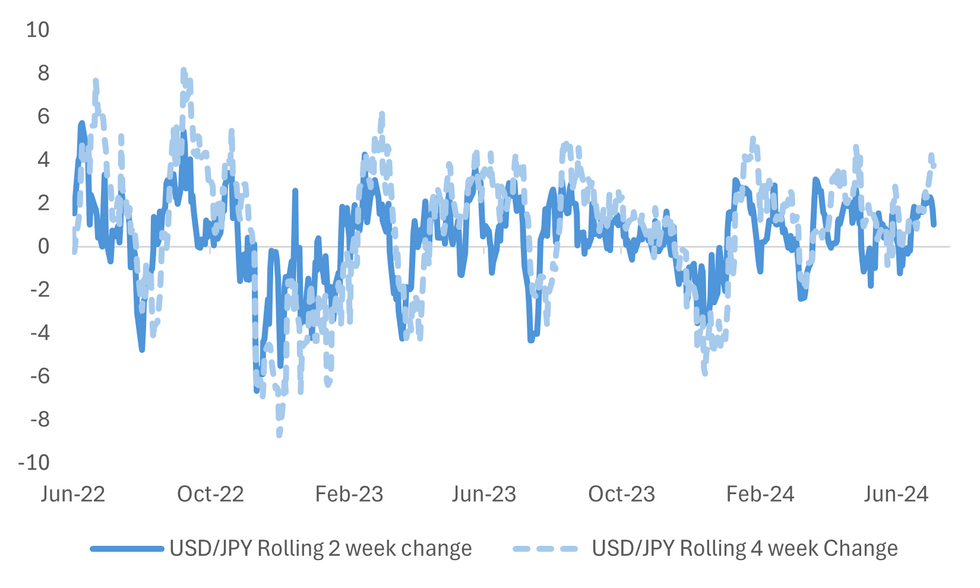
Source: MNI - Market News/Bloomberg
Why MNI
MNI is the leading provider
of intelligence and analysis on the Global Fixed Income, Foreign Exchange and Energy markets. We use an innovative combination of real-time analysis, deep fundamental research and journalism to provide unique and actionable insights for traders and investors. Our "All signal, no noise" approach drives an intelligence service that is succinct and timely, which is highly regarded by our time constrained client base.Our Head Office is in London with offices in Chicago, Washington and Beijing, as well as an on the ground presence in other major financial centres across the world.
We are facing technical issues, please contact our team.
ok
Your request was sent sucessfully! Our team will contact you soon.
ok