
Free Trial
Why MNI
MNI is the leading provider
of intelligence and analysis on the Global Fixed Income, Foreign Exchange and Energy markets. We use an innovative combination of real-time analysis, deep fundamental research and journalism to provide unique and actionable insights for traders and investors. Our "All signal, no noise" approach drives an intelligence service that is succinct and timely, which is highly regarded by our time constrained client base.Our Head Office is in London with offices in Chicago, Washington and Beijing, as well as an on the ground presence in other major financial centres across the world.
JAPAN DATA
May Tokyo CPI was close to expectations, both the headline and ex fresh food y/y outcomes, at 2.2%y/y and 1.9%y/y respectively, were in line with market expectations. The showed sequential improvement on the April outcomes as well. The core measure which excludes fresh food and energy was 1.7%y/y down from April's 1.8% outcome. The measure which excludes all food and energy was 1.2% y/y, versus 1.4% in April.
- In terms of m/m outcomes, the headline measures also saw a pick up compared to April's drop. This was led by goods prices rising 0.9% m/m, versus April's +0.4%. Services prices were -0.1%m/m, paring April's -0.9% drop.
- By sub-categories, education fell 0.4%m/m, compared to April's -9.4%, which was impacted by subsidies. transport was -0.2%m/m, while entertainment fell -0.4%. On the plus side utilities rose 3.5% m/m, after a +0.6% rise in April.
- Outside of the utilities rise there wasn't much sign of firmer inflation pressures, particularly in the services sector. At the margin this shouldn't add any hawkishness to the BoJ outlook.
Fig 1: Tokyo CPI Y/Y Trends
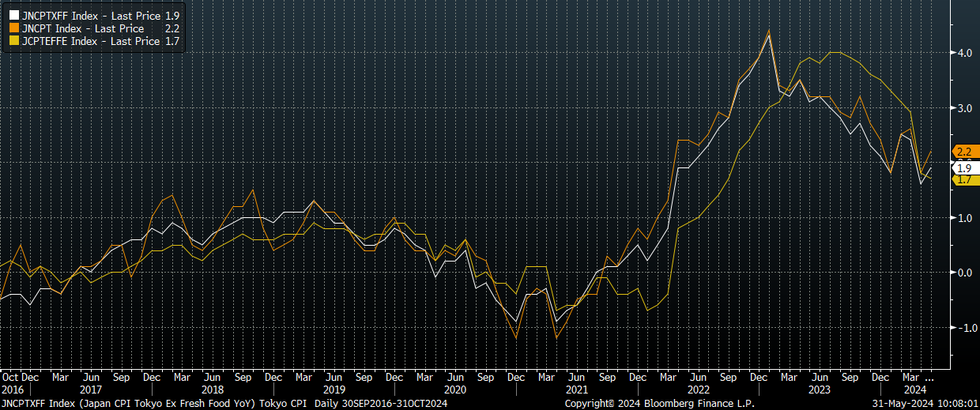
Source: MNI - Market News/Bloomberg
Why MNI
MNI is the leading provider
of intelligence and analysis on the Global Fixed Income, Foreign Exchange and Energy markets. We use an innovative combination of real-time analysis, deep fundamental research and journalism to provide unique and actionable insights for traders and investors. Our "All signal, no noise" approach drives an intelligence service that is succinct and timely, which is highly regarded by our time constrained client base.Our Head Office is in London with offices in Chicago, Washington and Beijing, as well as an on the ground presence in other major financial centres across the world.
We are facing technical issues, please contact our team.
ok
Your request was sent sucessfully! Our team will contact you soon.
ok