
Free Trial
Why MNI
MNI is the leading provider
of intelligence and analysis on the Global Fixed Income, Foreign Exchange and Energy markets. We use an innovative combination of real-time analysis, deep fundamental research and journalism to provide unique and actionable insights for traders and investors. Our "All signal, no noise" approach drives an intelligence service that is succinct and timely, which is highly regarded by our time constrained client base.Our Head Office is in London with offices in Chicago, Washington and Beijing, as well as an on the ground presence in other major financial centres across the world.
EQUITIES
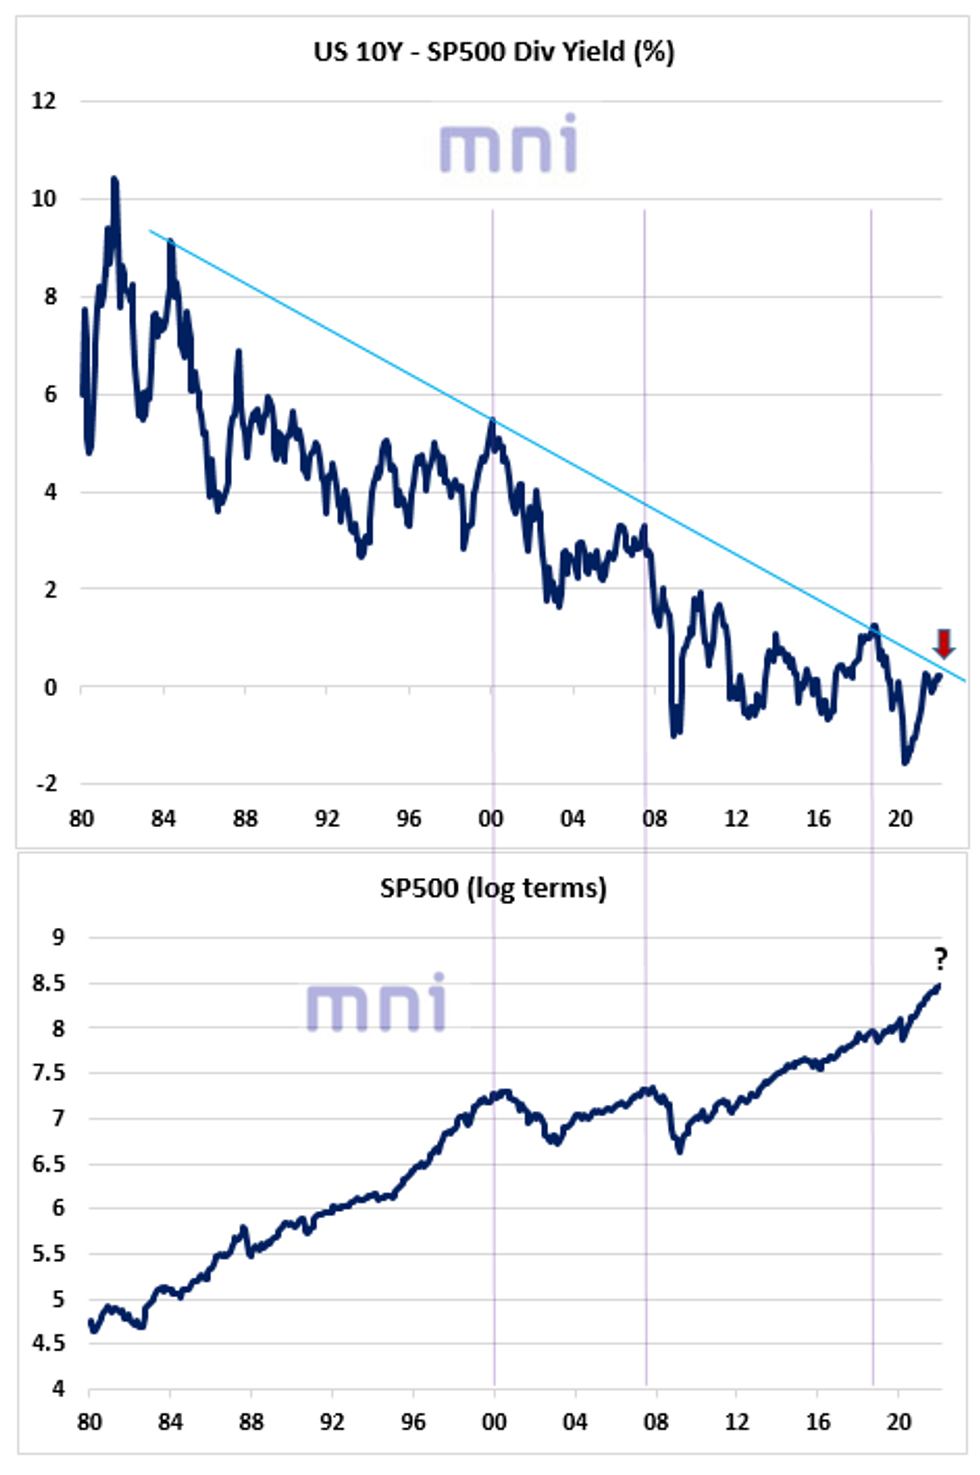
- Using monthly data of Robert Shiller, the top chart shows the dynamics of the US 10Y yield vs. SP500 dividend yield (DY) spread in the past few decades.
- The 30-year bull market in the bond market has led to a gradual decline of the excess premium of the 10Y yield over the SP500 DY, which fell from over 10% in the early 80s to an average of 0 percent in the past cycle.
- As investors have ‘classified’ LT bonds in the ‘safe-haven’ category, periods of market frictions are generally associated with a sharp decline in the 10Y yield – SP500 DY spread.
- Interestingly, we can notice the appearance of a robust LT downward trending resistance line in the chart below, which indicates that each time the 10Y yield – SP500 DY spread approaches the resistance line, it marks the end of a LT or ST trend in US equities.
- The past three times when the spread hit or flirted with the downward trending line were in early 2000 (before the tech bubble burst), in Q4 2007 (before the Financial Crisis) and in early Q4 2018 (before stocks consolidated by 20%).
- The surge in the 10Y yield in the past few months has been levitating the spread close to the LT downward trending resistance line.
- Is the market about to experience another selloff in the medium term?
Source: Bloomberg/MNI
Why MNI
MNI is the leading provider
of intelligence and analysis on the Global Fixed Income, Foreign Exchange and Energy markets. We use an innovative combination of real-time analysis, deep fundamental research and journalism to provide unique and actionable insights for traders and investors. Our "All signal, no noise" approach drives an intelligence service that is succinct and timely, which is highly regarded by our time constrained client base.Our Head Office is in London with offices in Chicago, Washington and Beijing, as well as an on the ground presence in other major financial centres across the world.
We are facing technical issues, please contact our team.
ok
Your request was sent sucessfully! Our team will contact you soon.
ok