
April 29, 2024 02:55 GMT
Away From Earlier +160.00 Highs, Rolling Monthly Rate Of Change Still Sub 2022 Highs
JPY
USD/JPY remains off earlier highs, last around 159.20/30. Earlier we saw a surge through 160.00 (highs of 160.17 per BBG), levels we haven't seen since April 1990. Indeed, the April 1990 high was 160.20.
- A clean break above 160 could see the market targeting 164.50, highs from late 1986.
- Post the 160.00 break, dips back to 159.05/10 have been supported. Liquidity is no doubt lower with Japan markets out today.
- In terms of rolling monthly rate of change, current spot levels put us a little above 5% compared to levels from a month ago for USD/JPY. The chart below plots the historical rolling 1 month changes back to 2000. Current levels of 5% are elevated by historical standards but not at extremes.
- The last observation on the chart rolls forward to the start next week and assumes we are trading above 164.00 by then (basically USD/JPY gains 100pips per day between now and then).
- If such a scenario unfolds the 1-month rate of change would be above 8%, which would be near levels we saw in September 2022. This period did coincide with intervention by the authorities, so may be a watch point for markets if we continue to see firm gains in USD/JPY levels over coming sessions.
Fig 1: USD/JPY Rolling Monthly Rate Of Change (Above 8% If We Breach 164.00 Early Next Week)
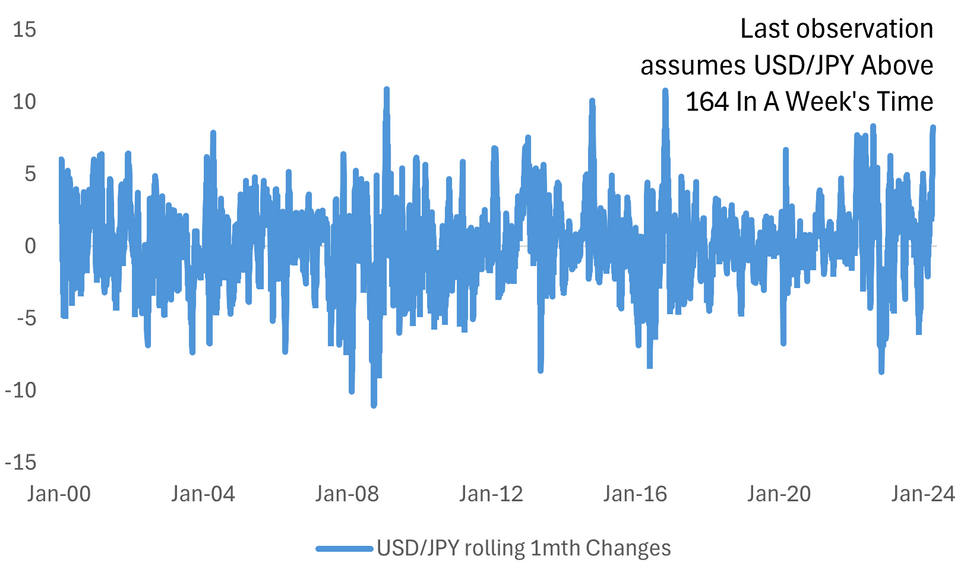
Source: MNI - Market News/Bloomberg
Keep reading...Show less
240 words