
Free Trial
Why MNI
MNI is the leading provider
of intelligence and analysis on the Global Fixed Income, Foreign Exchange and Energy markets. We use an innovative combination of real-time analysis, deep fundamental research and journalism to provide unique and actionable insights for traders and investors. Our "All signal, no noise" approach drives an intelligence service that is succinct and timely, which is highly regarded by our time constrained client base.Our Head Office is in London with offices in Chicago, Washington and Beijing, as well as an on the ground presence in other major financial centres across the world.
COMMODITIES
- In the past few weeks, we have seen that the rise in uncertainty over the 'Delta variant', the deceleration in the economic activity in Asia and the contraction in Chinese 'liquidity' have been weighing on a diversity of risky assets, including industrial metals such as copper.
- However, the tight supply combined with the accommodative monetary policies run by the major central banks keep pushing oil prices higher, currently trading at its highest level since July.
- In addition, investors have historically used oil as an inflation hedge (oil and nat gas are the two best performing commodities when inflation accelerates above 2%).
- The chart below (monthly candlestick chart) shows that Brent is currently testing its key LT downward trending resistance line; a break above that level could signal the start of a new bullish ST trend on oil.
- Next level to watch on the topside stands at 80, followed by 82.80 (October 2018 highs).
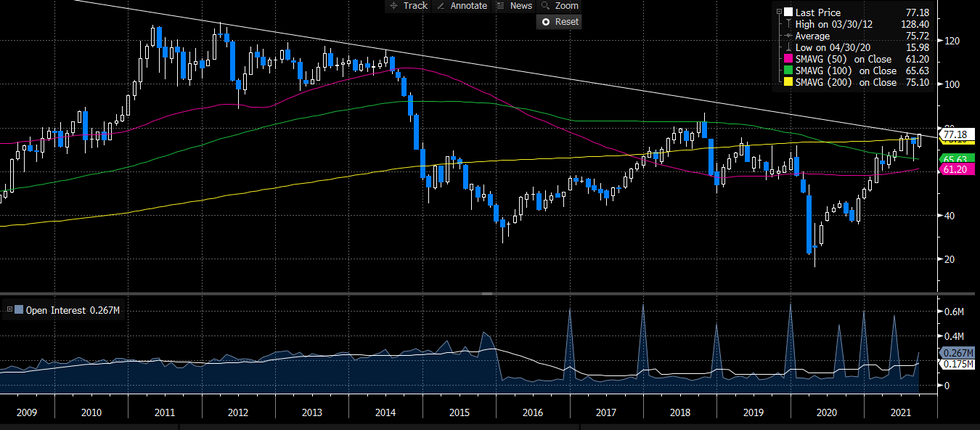
Source: Bloomberg/MNI
Why MNI
MNI is the leading provider
of intelligence and analysis on the Global Fixed Income, Foreign Exchange and Energy markets. We use an innovative combination of real-time analysis, deep fundamental research and journalism to provide unique and actionable insights for traders and investors. Our "All signal, no noise" approach drives an intelligence service that is succinct and timely, which is highly regarded by our time constrained client base.Our Head Office is in London with offices in Chicago, Washington and Beijing, as well as an on the ground presence in other major financial centres across the world.
We are facing technical issues, please contact our team.
ok
Your request was sent sucessfully! Our team will contact you soon.
ok