
Free Trial
Why MNI
MNI is the leading provider
of intelligence and analysis on the Global Fixed Income, Foreign Exchange and Energy markets. We use an innovative combination of real-time analysis, deep fundamental research and journalism to provide unique and actionable insights for traders and investors. Our "All signal, no noise" approach drives an intelligence service that is succinct and timely, which is highly regarded by our time constrained client base.Our Head Office is in London with offices in Chicago, Washington and Beijing, as well as an on the ground presence in other major financial centres across the world.
CZECHIA
- EURCZK has been moving sideways in the past three days, trading within a tight range between 25.85 and 26. ST resistances to watch on the topside stand at 26.04 (50D SMA), followed by 26.11 (100D SMA). On the downside, first support stands at 25.79, followed by 25.64.
- CZKJPY: the pair has been trending slightly lower in the past few days, currently flirting with the 5.0 psychological support; next levels to watch on the downside stand at 4.96 (50D SMA), followed by 4.89 (100D SMA). On the topside, first ST resistance stands at 5.06 (April 7 high); a break through that level would open the door for a move up to 5.22 (Sep 2018 high).
- CZKPLN has been gradually retracing lower in the past few days following last week's rally (April 13); the pair is currently testing its 50D SMA at 0.1750, next support to watch on the downside stands at 0.1736 (100D SMA). On the topside, first resistance stands at 0.1770, followed by 0.1790 (March 30 high).
- CZKHUF has been trending higher in the past week after finding support at 13.66 on last Monday (January lows); first resistance to watch on the topside stands at 14, followed by 14.15 (key ST resistance, March 22 high). On the downside, important support to watch stands at 13.81 (100D SMA).
- GBPCZK found support at its 100D SMA on Friday and has retraced higher, currently trading slightly below the 30 level. First resistance to watch on the topside stands at 30.19 (50D SMA), followed by 30.36 (April 7 high). On the downside, key support stands at 29.70 (100D SMA), followed by 29.58 (200D SMA).
- USDCZK continues to trend gradually lower; the pair broke below its 100D SMA support line at 21.65 and us currently approaching its next support level at 21.50; a broke below that level would open the door for a move down to 21.25. On the topside, first resistance stands at 21.77 (50D SMA), followed by 22.
- USDCZK Chart: The chart below also shows that the pair broke below its 21.59 support this morning, which corresponds to the 61.8% Fibonacci retracement of the 2021 high/low range (21.11 – 22.35). Based on this chart another ST support to watch is 21.41 (23.6% Fibo).
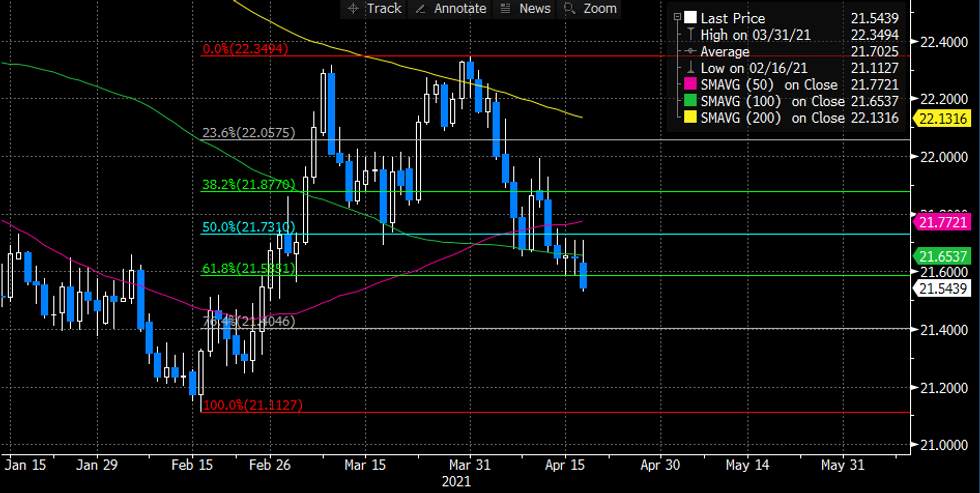
Source: Bloomberg/MNI
Why MNI
MNI is the leading provider
of intelligence and analysis on the Global Fixed Income, Foreign Exchange and Energy markets. We use an innovative combination of real-time analysis, deep fundamental research and journalism to provide unique and actionable insights for traders and investors. Our "All signal, no noise" approach drives an intelligence service that is succinct and timely, which is highly regarded by our time constrained client base.Our Head Office is in London with offices in Chicago, Washington and Beijing, as well as an on the ground presence in other major financial centres across the world.
We are facing technical issues, please contact our team.
ok
Your request was sent sucessfully! Our team will contact you soon.
ok