
Why MNI
MNI is the leading provider
of intelligence and analysis on the Global Fixed Income, Foreign Exchange and Energy markets. We use an innovative combination of real-time analysis, deep fundamental research and journalism to provide unique and actionable insights for traders and investors. Our "All signal, no noise" approach drives an intelligence service that is succinct and timely, which is highly regarded by our time constrained client base.Our Head Office is in London with offices in Chicago, Washington and Beijing, as well as an on the ground presence in other major financial centres across the world.
Fisheries Optimism Not Enough to Prop Up Pound
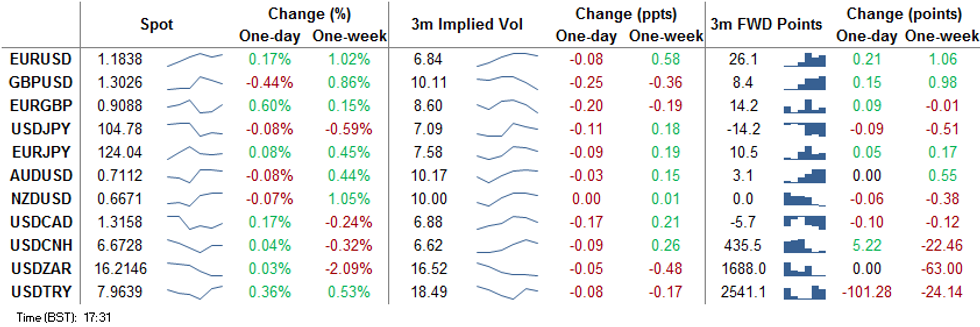
Hopes of progress for one of the last few sticking points for a Brexit deal were raised Friday, but GBP failed to sustain the rally into the close. The currency held its place as the poorest performer in G10.
Reports citing a French fishing industry source suggested the French government were preparing domestic industry groups for more restricted access to British fishing waters - signs that the EU could be open to making concessions to secure a deal.
The EUR outperformed, with the move starting in earnest after better-than-expected PMI data - manufacturing continues to outstrip services, which helped tip the Eurozone composite just above expectations. JPY rose alongside the greenback as US equities turned lower. Sticking points clearly remain between the White House Admin and House Speaker Pelosi, leading markets to knock back the chances of a stimulus package pre-election.
Focus in the coming week turns to the ECB, BoJ & BoC rate decisions, Australian inflation and French, German & Canadian GDP. Earnings season in the US continues with the busiest week of the quarter. 46% of the S&P500 by market cap are due to report.
Next Week By Far the Busiest of the Quarter for US Earnings
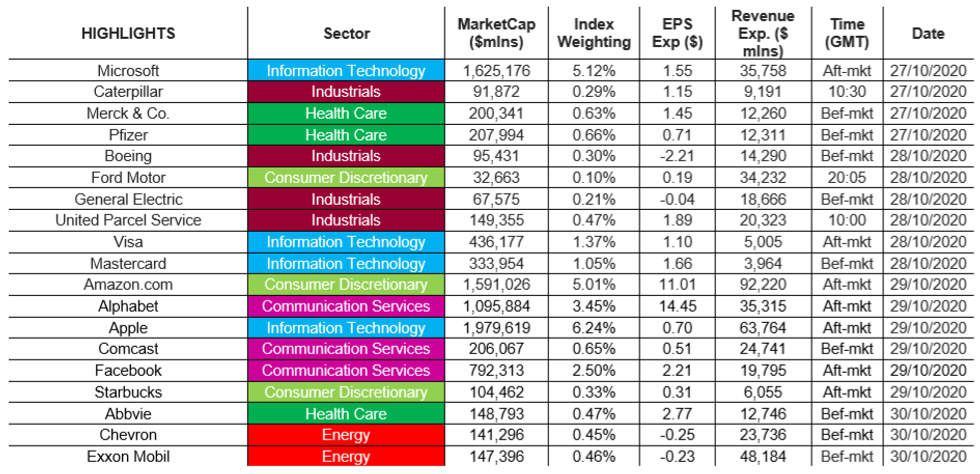
Next week is by far the busiest of the quarter for US earnings, with 46% of the S&P500 by market cap reporting. Four $trillion companies are reporting, with Microsoft, Amazon, Alphabet, Apple, Facebook and Visa among the highlights.
So far, reports have firmly beaten expectations, with the vast majority of releases beating on both EPS and sales forecasts. The healthcare sector is reporting well, beating on EPS by 40% on average. Utilities and energy names are lagging.
Full earnings schedule w/ timings and expectations here.
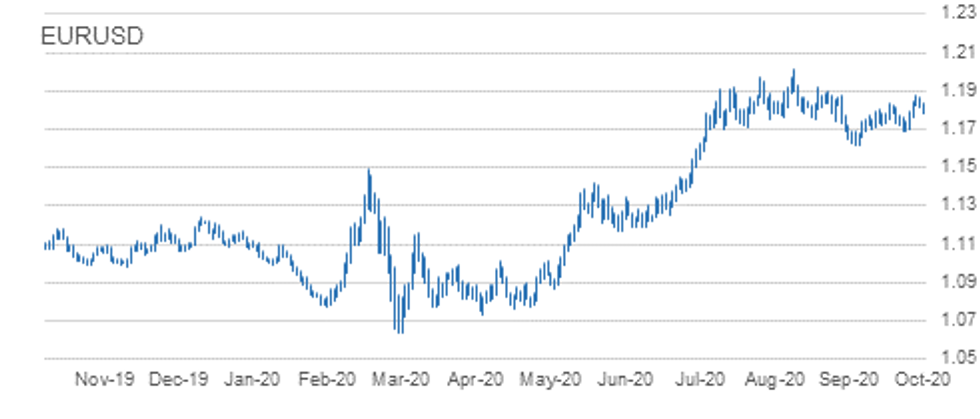
EUR/USD TECHS: Recovers Well Off Day's Low Friday
- RES 4: 1.2011 High Sep and key resistance
- RES 3: 1.1917 Sep 10 high / 76.4% of the Sep 1 - 25 sell-off
- RES 2: 1.1901 1.0% 10-dma envelope
- RES 1: 1.1881 High Oct 21
- PRICE: 1.1829 @ 15:39 BST Oct 23
- SUP 1: 1.1787/60 Low Oct 23 / Oct 20
- SUP 2: 1.1739 50-day EMA
- SUP 3: 1.1723 Trendline support drawn off the Sep 28 low
- SUP 4: 1.1689 Low Oct 15 and a key support
EURUSD recovered off the Friday low ahead of the close. The outlook is positive and pullbacks considered corrective. This week's bullish theme has been reinforced by the break of the former bull trigger at 1.1831, Oct 9 high. The breach signals scope for gains towards 1.1917 next, a Fibonacci retracement level with the major resistance and hurdle for bulls at 1.2011, Sep 1 high. On the downside, initial firm support lies at 1.1760, the Tuesday low.
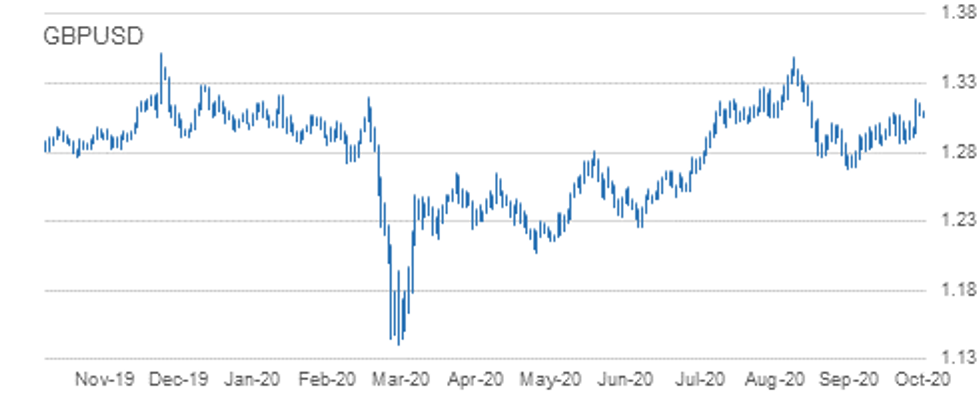
GBP/USD TECHS: Corrective Pullback
- RES 4: 1.3292 76.4% retracement of the Sep 1 - 23 sell-off
- RES 3: 1.3260 2.0% 10-dma envelope
- RES 2: 1.3233 Former trendline support drawn off the Mar 20 low
- RES 1: 1.3177 High Oct 21
- PRICE: 1.3037 @ 15:42 BST Oct 23
- SUP 1: 1.3010 High Oct 23
- SUP 2: 1.2940 Low Oct 21
- SUP 3: 1.2863 Low Oct 14 and key near-term support
- SUP 4: 1.2806 Low Sep 30
GBPUSD finished off the week's highs Friday. The recent gains reinforced the near-term bullish tone after the pair rallied sharply Wednesday to breach 1.3083, Oct 12 high. This confirmed a resumption of the upleg that started on Sep 23. Attention is on 1.3233, the former trendline support drawn off the Mar 20 low. The trendline was breached on Sep 9 and a return above it is required to strengthen a bullish theme. Firm support is at 1.2940, Oct 21 low.
EUR/GBP TECHS: Solid End of Week Bounce
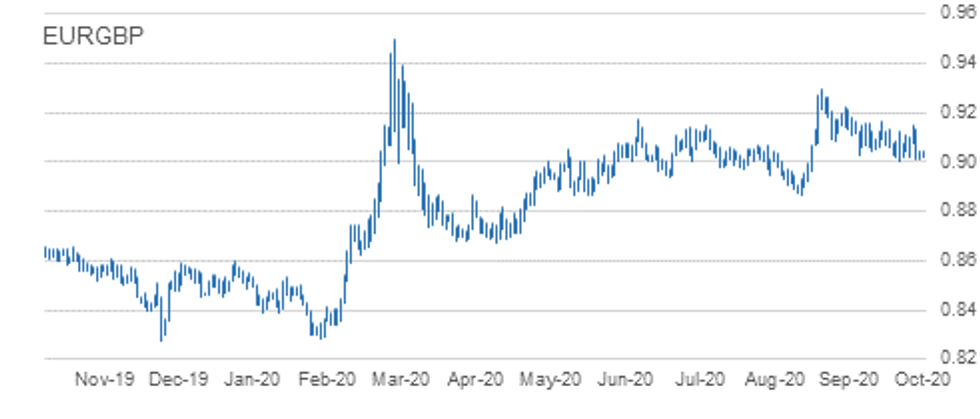
- RES 4: 0.9162 High Oct 7
- RES 3: 0.9155 1.0% 10-dma envelope
- RES 2: 0.9149 Oct 20 high
- RES 1: 0.9085 High Oct 23
- PRICE: 0.9077 @ 10:33 BST Oct 23
- SUP 1: 0.9012 Low Oct 21
- SUP 2: 0.9007 Low Oct 14 and the bear trigger
- SUP 3: 0.8967 76.4% retracement of the Sep 3 - 11 rally
- SUP 4: 0.8925 Low Sep 7
EURGBP appeared vulnerable earlier in the week following Wednesday's sharp move lower, but there was a decent bounce into the close Friday. Earlier in the week, the cross fell below the 50-day EMA, keeping attention on support at 0.9007, Oct 14 low and the near-term bear trigger. A break of 0.9007 would confirm a resumption of the downtrend that started Sep11 and open 0.8967, a retracement point. Key resistance has been defined at 0.9149, the Tuesday high. The outlook is bearish below this level.
USD/JPY TECHS: Vulnerable
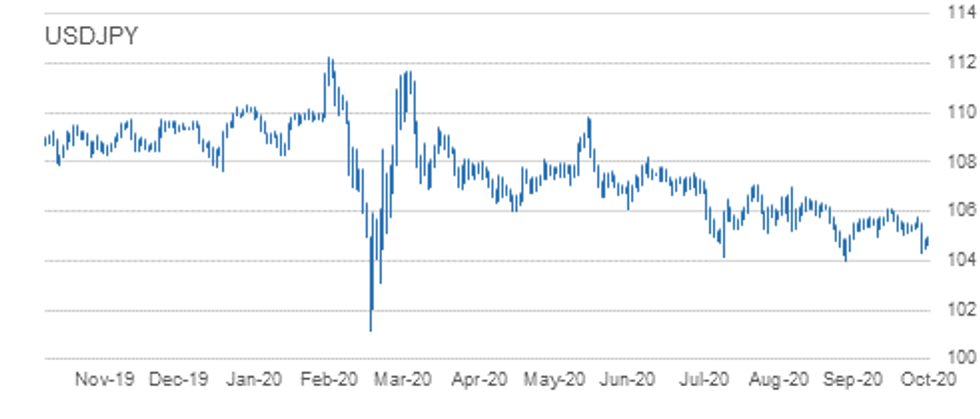
- RES 4: 106.11 High Oct 7 and key resistance
- RES 3: 105.75 High Oct 20
- RES 2: 105.53/65 High Oct 21 / 50-dma
- RES 1: 105.04 Low Oct 4 and a recent breakout level
- PRICE: 104.84 @ 16:03 BST Oct 23
- SUP 1: 104.34 Low Oct 21
- SUP 2: 104.00 Low Sep 21 and the bear trigger
- SUP 3: 103.67 76.4% retracement of the Mar 9 - 24 rally
- SUP 4: 103.09 Low Mar 12
USDJPY maintains a weaker outlook following the mid-week sell-off and the resumption of the downleg from 106.11, Oct 7 high. A number of important supports were cleared signalling scope for a deeper pullback towards the key 104.00 handle, Sep 21 low. A break of 104.00 would signal scope for further USD depreciation within the bear channel drawn off the Mar 24 high. Initial resistance is at 105.04.
EUR/JPY TECHS: Trading Below Recent Highs
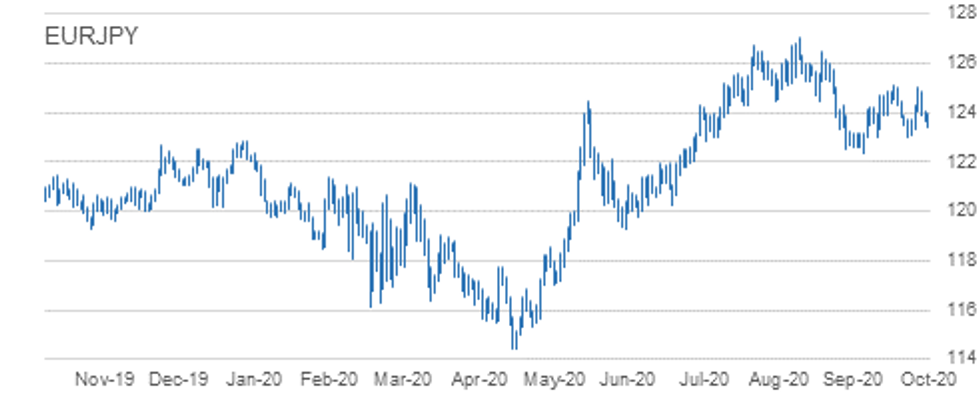
- RES 4: 125.97 76.4% retracement of the Sep 1 - 28 sell-off
- RES 3: 125.28 61.8% of the Sep 1 - 28 sell-off
- RES 2: 125.00/09 High Oct 20 and Oct 9
- RES 1: 124.21 Oct 23 high
- PRICE: 124.07 @ 16:05 BST Oct 23
- SUP 1: 123.42 Intraday low
- SUP 2: 123.03/02 Low Sep 29 and Oct 2 / Low Oct 15
- SUP 3: 122.38/28 Low Sep 28 / 61.8% of the Jun 22 - Sep 1 rally
- SUP 4: 122.25 38.2% retracement of the May - Sep rally
EURJPY is still trading below recent highs. Attention is on support at 123.03/02, low prints between Sep 29 and Oct 15 following this week's pullback. A break of this level would undermine the recent bullish outlook and instead highlight risk for a deeper sell-off towards 122.38, Sep 28 low and the bear trigger. Moving average studies are in a neutral position. To strengthen a bullish argument, price needs to clear key resistance at 125.09, Oct 9 high.
AUD/USD TECHS: Bearish Below Trendline Resistance
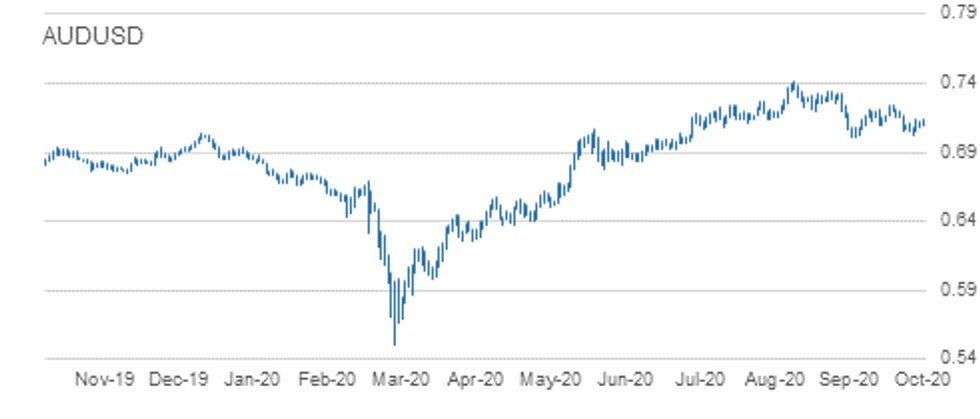
- RES 4: 0.7243 High Oct 10 and the intraday bull trigger
- RES 3: 0.7176 Trendline resistance drawn off the Sep 1 high
- RES 2: 0.7170 High Oct 15
- RES 1: 0.7158 High Oct 23
- PRICE: 0.7107 @ 16:07 BST Oct 23
- SUP 1: 0.7021 Low Oct 20
- SUP 2: 0.7006 Low Sep 25 and the bear trigger
- SUP 3: 0.6965 23.6% retracement of the Mar - Sep rally
- SUP 4: 0.6931 0.764 projection of Sep 1 - 25 sell-off from Oct 9 high
AUDUSD outlook remains bearish despite this week's recovery. The pair continues to trade below trendline resistance drawn off the Sep 1 high. The line intersects at 0.7176 and the recent failure at the trendline highlights bearish risk. Attention is on the primary support and bear trigger at 0.7006, Sep 25 low. A trendline resistance break is needed to alter the picture and signal a stronger reversal. This would open 0.7243, Oct 10 high.
USD/CAD TECHS: Bearish Conditions Dominate
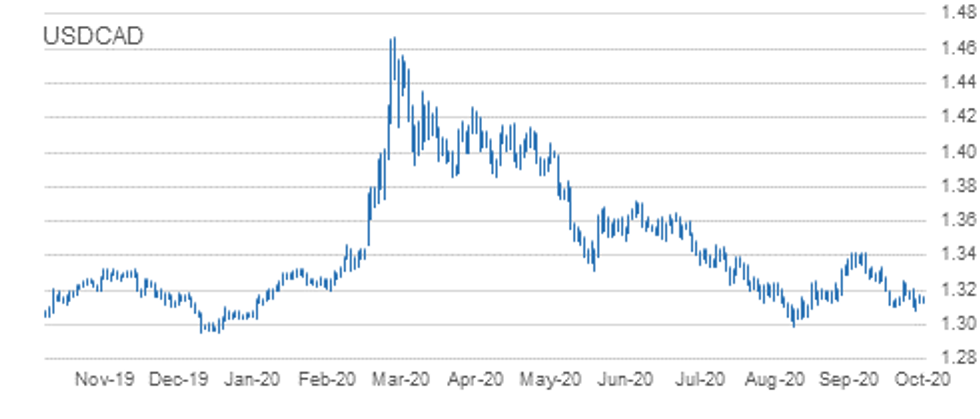
- RES 4: 1.3421 High Sep 30 and primary resistance
- RES 3: 1.3341 High Oct 7
- RES 2: 1.3246/59 50-day EMA / High Oct 15 and the bull trigger
- RES 1: 1. 3197 20-day EMA
- PRICE: 1.3147 @ 16:08 BST Oct 23
- SUP 1: 1.3081 Low Oct 21 and the intraday bear trigger
- SUP 2: 1.3047 Low Sep 7
- SUP 3: 1.3038 Low Sep 2
- SUP 4: 1.2994 Low Sep 1 and the major support
USDCAD bearish conditions continue to dominate. The pair has traded below key support at 1.3099 this week, Oct 13 low. The move lower confirms a resumption of the current downtrend that started Sep 30. Moving average studies are bearish too, reinforcing the current climate. Scope exists for a move towards the major support at 1.2994, Sep 1 low. Key resistance has been defined at 1.3259, Oct 15 high.
EUR/USD: MNI KEY LEVELS
- *$1.2032 May02-2018 high
- *$1.2020 Upper 2.0% 10-dma envelope
- *$1.2009/11 May03-2018 high/YTD Sep01 high
- *$1.1996 May14-2018 high
- *$1.1938 May15-2018 high
- *$1.1918 Upper Bollinger Band (3%)
- *$1.1902 Upper 1.0% 10-dma envelope
- *$1.1867 Upper Bollinger Band (2%)
- *$1.1857/60 100-mma/Intraday high
- *$1.1851 Cloud top, Jun14-2018 high
- *$1.1840 ***CURRENT MARKET PRICE 17:40BST FRIDAY***
- *$1.1824 100-hma
- *$1.1815 Sep24-2018 high
- *$1.1798/96 50-dma/55-dma
- *$1.1787 Intraday low
- *$1.1777 200-hma
- *$1.1759/57 21-dma/Sep27-2018 high
- *$1.1736 Fibo 38.2% 1.3993-1.0341
- *$1.1666/63 Lower 1.0% 10-dma env/Lower Boll Band (2%)
- *$1.1651 Sep28-2018 high
- *$1.1633 Cloud base, 100-dma
GBP/USD: MNI KEY LEVELS
- *$1.3196/99 Apr03-2019 high/Upper Boll Band (3%)
- *$1.3191 Apr04-2019 high
- *$1.3185 May06-2019 high
- *$1.3144 Fibo 38.2% 1.4377-1.2382
- *$1.3129/31/33 Upper 1.0% 10-dma env/May07-2019 high/Apr12-2019 high
- *$1.3119/22 Upper Boll Band (2%)/Intraday high
- *$1.3109 Fibo 50% 1.1841-1.4377
- *$1.3080 May08-2019 high
- *$1.3072 Cloud top
- *$1.3038/41 100-hma/May13-2019 high
- *$1.3029 ***CURRENT MARKET PRICE 17:40BST FRIDAY***
- *$1.3019/18 Intraday low/55-dma
- *$1.3014 50-dma
- *$1.2999 Fibo 61.8% 1.3381-1.2382
- *$1.2993/91 200-hma/May10-2019 low
- *$1.2981 Cloud base
- *$1.2970 May14-2019 high
- *$1.2952/49/47 50-mma/21-dma/200-wma
- *$1.2904 May14-2019 low
- *$1.2882 Fibo 50% 1.3381-1.2382
- *$1.2869 Lower 1.0% 10-dma envelope
EUR/GBP: MNI KEY LEVELS
- *Gbp0.9307 Aug29-2017 high
- *Gbp0.9247 Upper 2.0% 10-dma envelope
- *Gbp0.9226 Sep04-2017 high
- *Gbp0.9203 Sep08-2017 high
- *Gbp0.9174 Upper Bollinger Band (3%)
- *Gbp0.9157 Upper 1.0% 10-dma envelope
- *Gbp0.9142 Upper Bollinger Band (2%)
- *Gbp0.9134 Sep11-2017 high
- *Gbp0.9108 Jan03-2019 high
- *Gbp0.9090/94 Intraday high/Cloud top
- *Gbp0.9088 ***CURRENT MARKET PRICE 17:40BST FRIDAY***
- *Gbp0.9081/79 21-dma/Cloud base
- *Gbp0.9069/66 100-hma/50-dma
- *Gbp0.9064/63/62 200-hma/55-dma/Jan11-2019 high
- *Gbp0.9051/48 Jul17-2019 high/Jul16-2019 high
- *Gbp0.9046 100-dma
- *Gbp0.9039 Jul18-2019 high
- *Gbp0.9021 Intraday low
- *Gbp0.9015/10 Lower Boll Band (2%)/Jul10-2019 high
- *Gbp0.9005/00 Jul23-2019 high/Jul22-2019 high
- *Gbp0.8984 Lower Bollinger Band (3%)
USD/JPY: MNI KEY LEVELS
- *Y105.70 55-dma
- *Y105.62 Cloud base
- *Y105.61 50-dma
- *Y105.43 21-dma
- *Y105.19 200-hma
- *Y105.06 Cloud Kijun Sen
- *Y105.05 Cloud Tenkan Sen
- *Y105.03 100-hma
- *Y104.94 Intraday high
- *Y104.87 Jan03-2019 low
- *Y104.78 ***CURRENT MARKET PRICE 17:40BST FRIDAY***
- *Y104.70 Lower Bollinger Band (2%)
- *Y104.56 Mar26-2018 low
- *Y104.55 Intraday low
- *Y104.34 Lower Bollinger Band (3%)
- *Y104.15 Lower 1.0% 10-dma envelope
- *Y103.94 200-mma
- *Y103.10 Lower 2.0% 10-dma envelope
- *Y103.09 YTD low
- *Y102.04 Lower 3.0% 10-dma envelope
- *Y101.20 Nov09-2016 low
EUR/JPY: MNI KEY LEVELS
- *Y124.93 Fibo 38.2% 149.78-109.57
- *Y124.79 50-mma
- *Y124.69 55-dma
- *Y124.60 50-dma
- *Y124.51 Fibo 61.8% 126.81-120.78
- *Y124.34 Apr01-2019 low
- *Y124.25 May07-2019 high
- *Y124.22 Fibo 38.2% 133.13-118.71
- *Y124.21 Intraday high
- *Y124.14/19 38.2% 118.71-127.50/100-hma
- *Y124.06 ***CURRENT MARKET PRICE 17:40BST FRIDAY***
- *Y124.01/98 Cloud Tenkan Sen/21-dma
- *Y123.88 200-hma
- *Y123.80 Fibo 50% 126.81-120.78
- *Y123.74 May21-2019 high, Cloud Kijun Sen
- *Y123.72 Fibo 61.8% 115.21-137.50
- *Y123.68 Cloud base
- *Y123.54 Fibo 50% 109.57-137.50
- *Y123.53 100-dma
- *Y123.51 May22-2019 high
- *Y123.41 Intraday low
AUD/USD: MNI KEY LEVELS
- *$0.7260/62 Upper 2.0% 10-dma env/50-mma
- *$0.7244 200-wma
- *$0.7235 Upper Bollinger Band (2%)
- *$0.7206/07 Apr17-2019 high/Feb21-2019 high
- *$0.7195/98 55-dma/50-dma
- *$0.7189 Upper 1.0% 10-dma envelope
- *$0.7168 Cloud base
- *$0.7153/58 Apr17-2019 low/Intraday high
- *$0.7140 Apr16-2019 low
- *$0.7131 21-dma
- *$0.7117 ***CURRENT MARKET PRICE 17:40BST FRIDAY***
- *$0.7116 Apr12-2019 low
- *$0.7110/07 Apr10-2019 low/100-dma
- *$0.7104/01 200-hma/Intraday low
- *$0.7090/88 100-hma/Apr08-2019 low
- *$0.7073/69 Mar29-2019 low/Apr30-2019 high
- *$0.7057/53 Jul22-2019 high/Apr02-2019 low
- *$0.7048/47 Jul04-2019 high, May07-2019 high/Lower 1.0% 10-dma env
- *$0.7044 Jul16-2019 high
- *$0.7037 Lower Bollinger Band (2%)
- *$0.6987/85 Lower Boll Band (3%)/Jan03-2019 low
USD/CAD: MNI KEY LEVELS
- *C$1.3309 Fibo 38.2% 1.3565-1.3151
- *C$1.3300 Jun13-2019 low
- *C$1.3286/88 Jun20-2019 high/Upper 1.0% 10-dma env
- *C$1.3224/26/27 50% 1.2783-1.3665/Jun10-2019 low/21-dma
- *C$1.3206 55-dma
- *C$1.3199 50-dma
- *C$1.3175 50-mma
- *C$1.3164 Jul23-2019 high
- *C$1.3160/61/63 Intraday high, 200-wma/200-hma/Feb21-2019 low
- *C$1.3150/51 Feb20-2019 low/Jun20-2019 low
- *C$1.3150 ***CURRENT MARKET PRICE 17:40BST FRIDAY***
- *C$1.3145/43 100-hma/Cloud base
- *C$1.3120/16 61.8% 1.2783-1.3665/Jul23-2019 low
- *C$1.3113/09 Feb25-2019 low/Intraday low
- *C$1.3107 Jun26-2019 low
- *C$1.3066 Fibo 38.2% 1.4690-1.2062
- *C$1.3053 Fibo 38.2% 1.2062-1.3665
- *C$1.3044 Lower Bollinger Band (2%)
- *C$1.3025 Lower 1.0% 10-dma envelope
- *C$1.3015 Oct25-2018 low
- *C$1.2970/69 Oct24-2018 low/YTD Jan02 low
Expiries for Oct26 NY cut 1000ET (Source DTCC)
EUR/USD: $1.1500(E1.8bln), $1.1630-35(E559mln), $1.1650-60(E1.6bln), $1.1750(E651mln), $1.1800(E524mln), $1.1830-45(E1.1bln)
USD/JPY: Y103.95-104.00($2.5bln-USD puts), Y104.20-25($583mln), Y105.00($898mln), Y105.30-40($1.7bln), Y105.60-75($1.2bln), Y106.95-107.00($1.6bln)
EUR/JPY: Y122.80(E1.2bln), Y123.10(E717mln)
EUR/GBP: Gbp0.8900(E880mln), Gbp0.9000(E2.2bln-EUR puts)
AUD/USD: $0.7100(A$609mln)
AUD/NZD: N$1.0809-10(A$560mln), N$1.0815(A$1.7bln)
Larger Option Pipeline
EUR/USD: Oct28 $1.1745-60(E1.1bln), $1.1800-05(E1.5bln), $1.2000(E2.7bln); Oct30 $1.1800(E1.1bln), $1.1850(E1.2bln), $1.1950(E1.7bln-EUR calls), $1.2000(E1.1bln); Nov03 $1.1900-05(E1.1bln)
USD/JPY: Oct27 Y105.00($1.3bln), Y105.25-35($1.0bln), Y106.00-05($1.2bln); Oct28 Y104.85-90($1.2bln), Y105.00($1.5bln), Y105.30-40($1.4bln); Oct29 Y103.20-25($1.6bln), Y104.00($1.6bln), Y105.25($1.3bln), Y105.55-65($2.2bln), Y106.00($1.2bln); Oct30 Y104.50($1.9bln), Y104.80-85($1.1bln), Y106.00-05($2.2bln); Nov03 Y105.45-49($1.3bln); Nov04 Y105.00($1.1bln); Nov05 Y106.06-09($1.6bln)
EUR/JPY: Nov05 Y124.50(E1.0bln)
EUR/GBP: Nov02 Gbp0.8900(E1.6bln-EUR puts)
AUD/USD: Oct27 $0.6680(A$1.1bln); Nov02 $0.7140-45(A$1.5bln)
AUD/JPY: Oct29 Y73.20(A$1.0bln-AUD puts), Y76.35-40(A$2.4bln-AUD calls)
AUD/NZD: Oct27 N$1.0809-20(A$2.5bln); Oct30 N$1.0750(A$1.2bln)
USD/CNY: Nov03 Cny6.5334($1.1bln); Nov05 Cny6.75($1.0bln), Cny6.80($1.9bln), Cny6.85($1.3bln)
Why MNI
MNI is the leading provider
of intelligence and analysis on the Global Fixed Income, Foreign Exchange and Energy markets. We use an innovative combination of real-time analysis, deep fundamental research and journalism to provide unique and actionable insights for traders and investors. Our "All signal, no noise" approach drives an intelligence service that is succinct and timely, which is highly regarded by our time constrained client base.Our Head Office is in London with offices in Chicago, Washington and Beijing, as well as an on the ground presence in other major financial centres across the world.