
Why MNI
MNI is the leading provider
of intelligence and analysis on the Global Fixed Income, Foreign Exchange and Energy markets. We use an innovative combination of real-time analysis, deep fundamental research and journalism to provide unique and actionable insights for traders and investors. Our "All signal, no noise" approach drives an intelligence service that is succinct and timely, which is highly regarded by our time constrained client base.Our Head Office is in London with offices in Chicago, Washington and Beijing, as well as an on the ground presence in other major financial centres across the world.
Signs of Deal Progression Ahead of Pelosi's Deadline
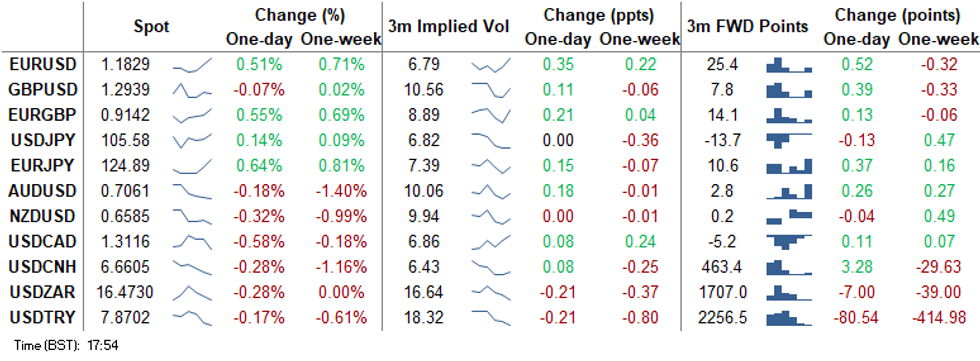
US equities got a late bid as House Speaker Pelosi talked up the chances of a COVID-19 aid package by the end of play Tuesday, with markets particularly enjoying her statement that the administration has "come a long way" toward an agreement. This helped keep the greenback under pressure across the board, which fell most notably against the CAD, EUR and Scandi currencies.
GBP remains volatile in a range, with some late support emerging in GBP/USD as Telegraph sources reported that EU negotiator Barnier could be making a surprise visit to London as soon as Thursday. GBP/USD failed to cement the gains, however, returning lower just after the London close.
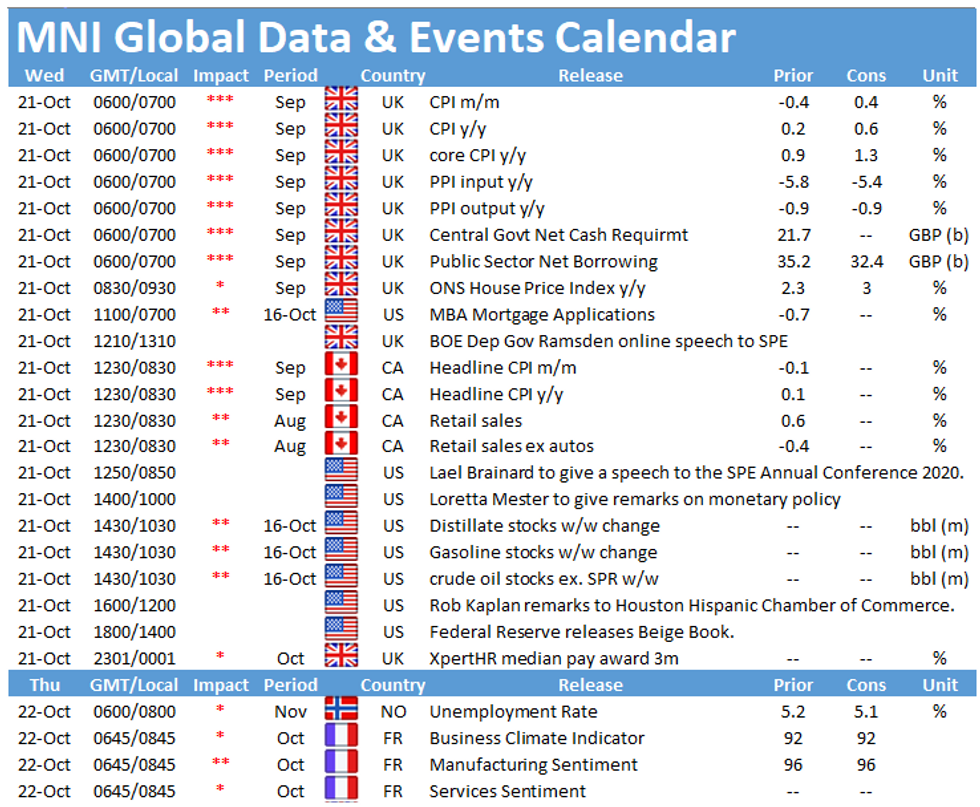
UK inflation, Canadian retail sales and the Westpac Leading Index for Australia are the calendar highlights Wednesday, which may leave more focus on the central bank speaker slate - ECB's Lagarde & Lane, BoE's Ramsden, RBA's Debelle and Fed's Mester, Kaplan, Kashkari and Bullard are all due.
EUR/USD TECHS: Bull Trigger Hit
- RES 4: 1.1885 1.0% 10-dma envelope
- RES 3: 1.1872 High Sep 21
- RES 2: 1.1859 61.8% retracement of the Sep 1 - 25 sell-off
- RES 1: 1.1841 High Oct 20
- PRICE: 1.1827 @ 16:45 BST Oct 20
- SUP 1: 1.1730 50-day EMA
- SUP 2: 1.1685 Low Sep 30
- SUP 3: 1.1612/1581 Low Sep 25 and the bear trigger / Low Jul 24
- SUP 4: 1.1526 0.764 proj of Sep 1 - Sep 25 sell-off from Oct 9 high
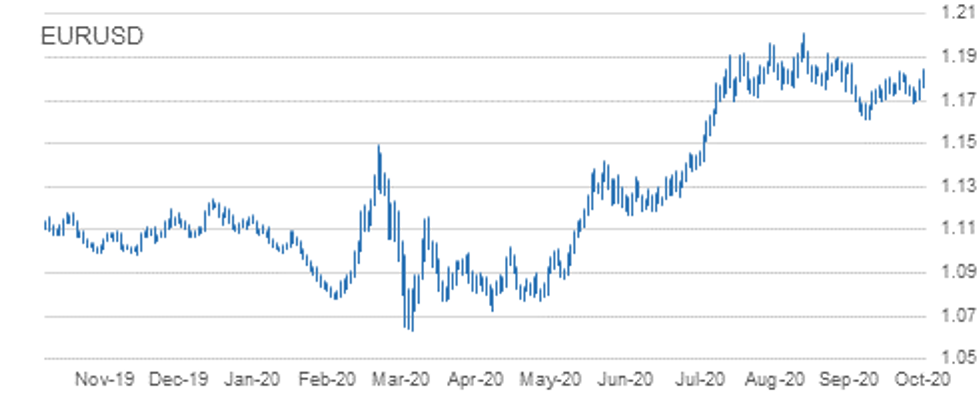
EURUSD continues to pushed higher Tuesday, hitting the best levels since late September as the pair recovers off last week's low of 1.1689 on Oct 15. A fairly strong close Monday strengthens the intraday reversal and this outlook firmed on the break of key near-term resistance at 1.1831, Oct 12 high. This level was a trigger for a resumption of the bullish reversal that occurred on Sep 25 and opens 1.1859 initially, a retracement level. Sub 1.1684 levels, Sep 30 low, is required to reinstate a bearish threat.
GBP/USD TECHS: Resistance Remains Intact
- RES 4: 1.3198 Former trendline support drawn off the Mar 20 low
- RES 3: 1.3174 61.8% retracement of the Sep 1 - 23 sell-off
- RES 2: 1.3083 High Oct 12
- RES 1: 1.3030 High Oct 15
- PRICE: 1.2950 @ 16:50 BST Oct 20
- SUP 1: 1.2863 Low Oct 14
- SUP 2: 1.2846 Low Oct 7 and key near-term support
- SUP 3: 1.2806 Low Sep 30
- SUP 4: 1.2745 Low Sep 28
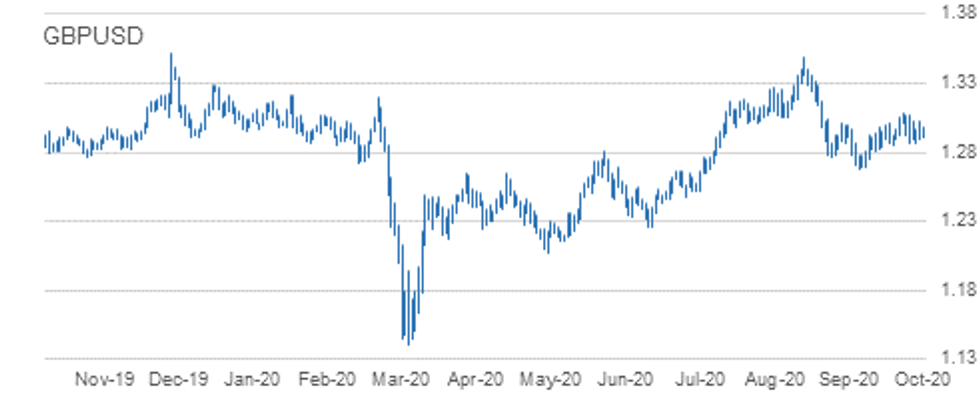
GBPUSD remains below the Oct 12 high of 1.3083. A break is needed to resume the recent uptrend that would open 1.3000 and 1.3198. The latter is the former trendline support drawn off the Mar 20 low. The trendline was breached on Sep 9. A break of 1.3198 is required to strengthen a bullish theme. Firm near-term support lies at 1.2846. A breach would instead signal scope for a deeper pullback and possibly a bearish resumption.
EUR/GBP TECHS: Rally Through Trendline Counters Bearish Outlook
- RES 4: 0.9190 61.8% retracement of the Sep 11 - 28 sell-off
- RES 3: 0.9169 1.0% 10-dma envelope
- RES 2: 0.9162 High Oct 7 and the bull trigger
- RES 1: 0.9148 Oct 20 high
- PRICE: 0.9133 @ 16:53 BST Oct 20
- SUP 1: 0.9007 Low Oct 14
- SUP 2: 0.9000 Round number support
- SUP 3: 0.8967 76.4% retracement of the Sep 3 - 11 rally
- SUP 4: 0.8808 Low May 13
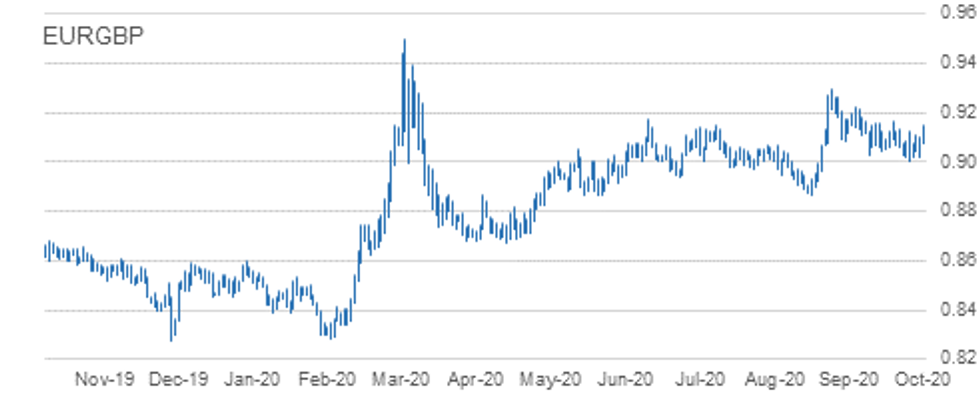
EURGBP countered the bearish tone as the cross extended its rally from the Monday low. This confirms a clear break of trendline resistance as well as the Oct 14 high at 0.9122, turning the outlook more positive for now. For bears to regain any momentum, markets need to break through the bear trigger at 0.9007, Oct 14 low. A break would open 0.9000 and below towards 0.8967, a retracement level.
USD/JPY TECHS: One Week High, But Focus Still On Key Support
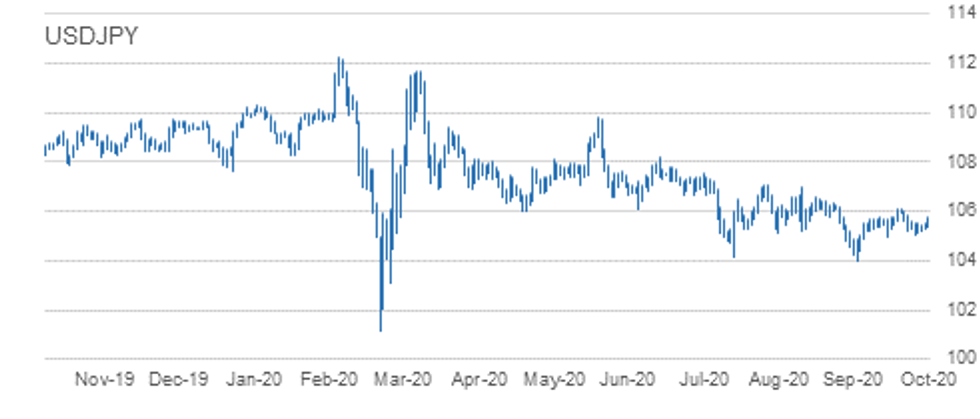
- RES 4: 106.95 High Sep 28
- RES 3: 106.48 Channel resistance drawn off Mar 24 high
- RES 2: 106.11/38 High Oct 7 and the bull trigger / High Sep 8
- RES 1: 105.75 High Oct 20
- PRICE: 105.56 @ 17:07 BST Oct 20
- SUP 1: 105.04 Low Oct 14
- SUP 2: 104.94 Low Oct 2 and key near-term support
- SUP 3: 104.41 Low Sep 22
- SUP 4: 104.00 Low Sep 21 and the bear trigger
USDJPY is trading above recent lows. Despite this, the pair continues to display a softer tone. Intraday momentum studies still point south however to strengthen a bearish theme, price needs to trade below 104.94, Oct 2 low. This would open 104.00, Sep 21 low. The bull trigger is at 106.11, Oct 7 high where a break would instead resume bullish pressure. Initial resistance is at 105.74, the 50-dma.
EUR/JPY TECHS: Firmer, With Support Intact
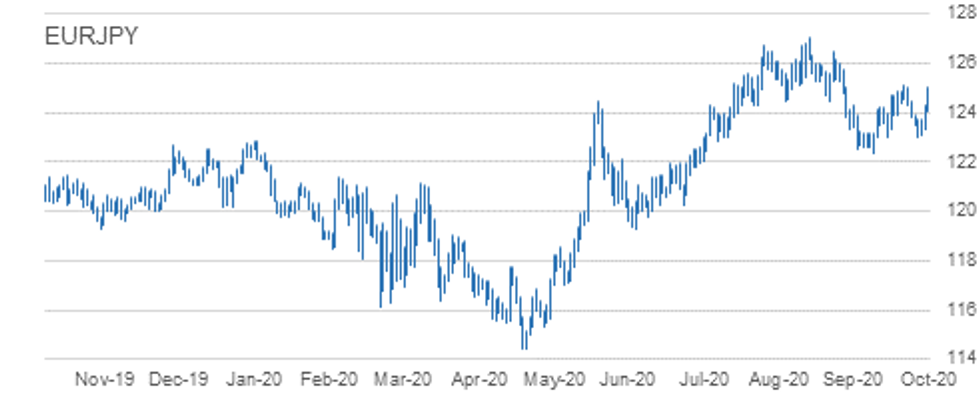
- RES 4: 126.46 High Sep 10
- RES 3: 125.97 76.4% retracement of the Sep 1 - 28 sell-off
- RES 2: 125.77 High Sep 15
- RES 1: 125.09/28 High Oct 9 / 61.8% of the Sep 1 - 28 sell-off
- PRICE: 124.83 @ 17:09 BST Oct 20
- SUP 1: 124.03 Intraday low
- SUP 2: 123.03/02 Low Sep 29 and Oct 2 / Low Oct 15
- SUP 3: 122.38/28 Low Sep 28 / 61.8% of the Jun 22 - Sep 1 rally
- SUP 4: 122.25 38.2% retracement of the May - Sep rally
EURJPY remains firm as the cross pulls away from support at 123.03/02, low prints between Sep 29 and Oct 15. Stronger gains through the 124.00 handle signal potential for an extension higher towards 125.09, Oct 9 high and the bull trigger. A break of 125.09 would open 125.28 and 125.97, both retracement levels. On the downside, a 123.03/02 breach is needed to trigger bearish pressure and open 122.38, Sep 28 low.
AUD/USD TECHS: Heavy And Approaching Key Support
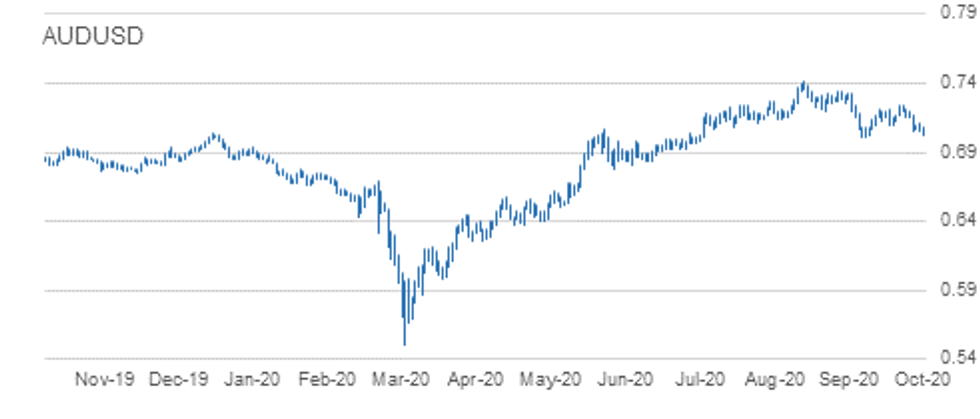
- RES 4: 0.7243 High Oct 10 and the intraday bull trigger
- RES 3: 0.7194 Trendline resistance drawn off the Sep 1 high
- RES 2: 0.7170 High Oct 15
- RES 1: 0.7115 High Oct 19
- PRICE: 0.7055 @ 17:10 BST Oct 20
- SUP 1: 0.7021 Low Oct 20
- SUP 2: 0.7006 Low Sep 25 and the bear trigger
- SUP 3: 0.6965 23.6% retracement of the Mar - Sep rally
- SUP 4: 0.6931 0.764 projection of Sep 1 - 25 sell-off from Oct 9 high
AUDUSD remains vulnerable and traded lower again Tuesday. On Oct 9, the pair cleared resistance at 0.7209, Oct 1 and 6 high resulting in a test of trendline resistance drawn off the Sep 1 high. The line intersects at 0.7194. The failure at the trendline is weighing on the Aussie and the scene is set for a deeper pullback. Attention is on the primary support and bear trigger at 0.7006, Sep 25 low. A trendline resistance break would alter the picture.
USD/CAD TECHS: Pullback Counters Bullish Outlook
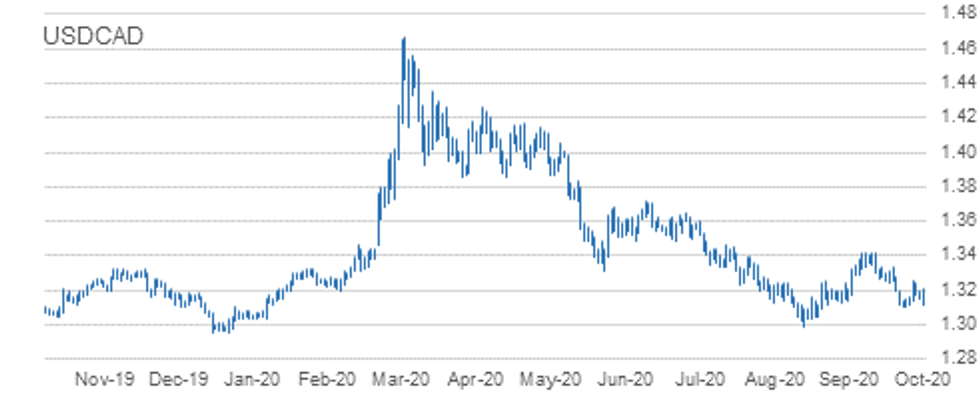
- RES 4: 1.3421 High Sep 30 and primary resistance
- RES 3: 1.3341 High Oct 7 and a reversal trigger
- RES 2: 1.3260/68 50-day EMA / High Oct 7
- RES 1: 1.3259 High Oct 15
- PRICE: 1.3120 @ 17:12 BST Oct 20
- SUP 1: 1.3113 Low Oct 20
- SUP 2: 1.3099 Low Oct 13 and the bear trigger
- SUP 3: 1.3095 76.4% retracement of the Sep 1 - 30 rally
- SUP 4: 1.3038 Low Sep 2
Despite the short-term bullish outlook, USDCAD dropped further Tuesday, taking out initial support at 1.3143, which undermines the recent recovery. The bear trigger at 1.3099 rests as next support which, if broken, would open a more protracted move lower. To the upside, a clear breach of the 50 EMA at 1.3260 would strengthen a bullish case.
EUR/USD: MNI KEY LEVELS
*$1.2032 May02-2018 high
*$1.2009/11 May03-2018 high/YTD Sep01 high
*$1.2003 Upper 2.0% 10-dma envelope
*$1.1996 May14-2018 high
*$1.1938 May15-2018 high
*$1.1900 Upper Bollinger Band (3%)
*$1.1886 Upper 1.0% 10-dma envelope
*$1.1857 100-mma
*$1.1846/51 Upper Boll Band (2%)/Cloud top, Jun14-2018 high
*$1.1841 Intraday high
*$1.1830 ***CURRENT MARKET PRICE 17:50BST TUESDAY***
*$1.1815 Sep24-2018 high
*$1.1797/96 55-dma/50-dma
*$1.1763/60 200-hma/Intraday low
*$1.1757 Sep27-2018 high
*$1.1742 100-hma
*$1.1736 38.2% 1.3993-1.0341, 21-dma
*$1.1651/50 Sep28-2018 high/Lower 1.0% 10-dma env
*$1.1630 Lower Bollinger Band (2%)
*$1.1623/21 Down Trendline from Jul18-2008/Oct16-2018 high
*$1.1616/15/13 100-dma/Cloud base/161.8% swing $1.1497-1.1309
GBP/USD: MNI KEY LEVELS
*$1.3041 May13-2019 high
*$1.3019 55-dma
*$1.3012 50-dma
*$1.2999 Fibo 61.8% 1.3381-1.2382
*$1.2991 May10-2019 low
*$1.2979 Intraday high
*$1.2970/72 May14-2019 high/200-hma
*$1.2960 Cloud base
*$1.2950 50-mma
*$1.2943/48 200-wma/100-hma
*$1.2936 ***CURRENT MARKET PRICE 17:50BST TUESDAY***
*$1.2911 Intraday low
*$1.2904 May14-2019 low
*$1.2898 21-dma
*$1.2882 Fibo 50% 1.3381-1.2382
*$1.2852 May16-2019 high
*$1.2845 100-dma
*$1.2833/32/31 Feb12-2019 low/Lower 1.0% 10-dma env/Jan21-2019 low
*$1.2825 Jan16-2019 low
*$1.2813/10 May21-2019 high/61.8% 1.1841-1.4377
*$1.2784 Jun25-2019 high
EUR/GBP: MNI KEY LEVELS
*Gbp0.9418 Mar27-2009 high
*Gbp0.9412/15 Oct13-2009 high/Oct07-2016 high
*Gbp0.9352 Upper 3.0% 10-dma envelope
*Gbp0.9346 Oct15-2009 high
*Gbp0.9307 Aug29-2017 high
*Gbp0.9261 Upper 2.0% 10-dma envelope
*Gbp0.9226 Sep04-2017 high
*Gbp0.9203/06 Sep08-2017 high/Upper Boll Band (3%)
*Gbp0.9169/70 Upper Boll Band (2%)/Upper 1.0% 10-dma env
*Gbp0.9147 Intraday high
*Gbp0.9145 ***CURRENT MARKET PRICE 17:50BST TUESDAY***
*Gbp0.9134 Sep11-2017 high
*Gbp0.9108 Jan03-2019 high
*Gbp0.9099 21-dma
*Gbp0.9079 Intraday low, Cloud top, Cloud base
*Gbp0.9068/66 200-hma, 100-hma/50-dma
*Gbp0.9062 Jan11-2019 high, 55-dma
*Gbp0.9051/48 Jul17-2019 high/Jul16-2019 high
*Gbp0.9043/39 100-dma/Jul18-2019 high
*Gbp0.9021 Lower Bollinger Band (2%)
*Gbp0.9010 Jul10-2019 high
USD/JPY: MNI KEY LEVELS
*Y106.78 Jun25-2019 low
*Y106.60 Upper 1.0% 10-dma envelope
*Y106.57 Fibo 38.2% 75.35-125.86
*Y106.52 Fibo 61.8% 99.02-118.66
*Y106.34 100-dma
*Y106.17 Upper Bollinger Band (3%)
*Y106.06 Cloud top
*Y105.99 Cloud base
*Y105.96 Upper Bollinger Band (2%)
*Y105.74/75 50-dma/Intraday high, 55-dma
*Y105.58 ***CURRENT MARKET PRICE 17:50BST TUESDAY***
*Y105.57 Cloud Tenkan Sen
*Y105.51 21-dma
*Y105.47 200-hma
*Y105.38 100-hma
*Y105.35 Intraday low
*Y105.11 Lower Bollinger Band (2%)
*Y105.06 Cloud Kijun Sen
*Y104.90 Lower Bollinger Band (3%)
*Y104.87 Jan03-2019 low
*Y104.56 Mar26-2018 low
EUR/JPY: MNI KEY LEVELS
*Y125.89 Fibo 38.2% 137.50-118.71
*Y125.87 Upper Bollinger Band (3%)
*Y125.61 Apr24-2019 high
*Y125.58 Cloud top
*Y125.45 Upper 1.0% 10-dma envelope
*Y125.23 May01-2019 high
*Y125.21 200-wma, Upper Boll Band (2%)
*Y125.04 Apr11-2019 low
*Y125.00 Intraday high
*Y124.93 Fibo 38.2% 149.78-109.57
*Y124.91 ***CURRENT MARKET PRICE 17:50BST TUESDAY***
*Y124.81 50-mma
*Y124.75 55-dma
*Y124.73 50-dma
*Y124.51 Fibo 61.8% 126.81-120.78
*Y124.34 Apr01-2019 low
*Y124.25 May07-2019 high
*Y124.22 Fibo 38.2% 133.13-118.71
*Y124.14 Fibo 38.2% 118.71-127.50
*Y124.08 Cloud Kijun Sen
*Y124.06 Cloud Tenkan Sen, 200-hma
AUD/USD: MNI KEY LEVELS
*$0.7164 Cloud base
*$0.7153 Apr17-2019 low
*$0.7139/40 200-hma/Apr16-2019 low
*$0.7128 21-dma
*$0.7116 Apr12-2019 low
*$0.7110 Apr10-2019 low
*$0.7102 100-dma
*$0.7086/88 100-hma/Apr08-2019 low
*$0.7073/75 Mar29-2019 low/Intraday high
*$0.7067/69 Lower 1.0% 10-dma env/Apr30-2019 high
*$0.7061 ***CURRENT MARKET PRICE 17:50BST TUESDAY***
*$0.7057/53 Jul22-2019 high/Apr02-2019 low
*$0.7048/44 Jul04-2019 high, May07-2019 high/Jul16-2019 high
*$0.7021 Intraday low
*$0.7009 Lower Bollinger Band (2%)
*$0.6996 Lower 2.0% 10-dma envelope
*$0.6985 Jan03-2019 low
*$0.6971/67 Jul12-2019 low/Jun11-2019 high
*$0.6951 Lower Bollinger Band (3%)
*$0.6924 Lower 3.0% 10-dma envelope
*$0.6909 Jun19-2019 high
USD/CAD: MNI KEY LEVELS
*C$1.3286 Jun20-2019 high
*C$1.3256 21-dma
*C$1.3224/26 50% 1.2783-1.3665/Jun10-2019 low
*C$1.3216 55-dma
*C$1.3204/05 Intraday high/50-dma
*C$1.3186 100-hma
*C$1.3172/74 Cloud base/50-mma
*C$1.3161/63/64 200-wma/Feb21-2019 low/200-hma, Jul23-2019 high
*C$1.3150/51 Feb20-2019 low/Jun20-2019 low
*C$1.3120 Fibo 61.8% 1.2783-1.3665
*C$1.3119 ***CURRENT MARKET PRICE 17:50BST TUESDAY***
*C$1.3116/13 Jul23-2019 low/Feb25-2019 low, Intraday low
*C$1.3107 Jun26-2019 low
*C$1.3066 Fibo 38.2% 1.4690-1.2062
*C$1.3058 Lower Bollinger Band (2%)
*C$1.3053 Fibo 38.2% 1.2062-1.3665
*C$1.3038 Lower 1.0% 10-dma envelope
*C$1.3015 Oct25-2018 low
*C$1.2994 YTD low
*C$1.2970 Oct24-2018 low
*C$1.2960 Lower Bollinger Band (3%)
Expiries for Oct21 NY cut 1000ET (Source DTCC)
EUR/USD: $1.1750-65(E851mln), $1.1790-00(E1.1bln)
USD/JPY: Y105.00-10($1.9bln), Y105.50($1.3bln), Y105.90-106.00($2.3bln), Y106.65($1.0bln)
AUD/USD: $0.6900(A$847mln), $0.7600(A$1.1bln)
USD/CAD: C$1.3000($800mln)
USD/CNY: Cny6.7000($500mln)
Larger Option Pipeline
EUR/USD: Oct22 $1.1600-10(E1.7bln), $1.1645-50(E1.8bln), $1.16 $1.1795-00(E1.2bln); Oct23 $1.1840-50(E1.2bln), $1.2000(E1.3bln); Oct26 $1.1500(E1.8bln), $1.1650-60(E1.6bln); Oct28 $1.1800-05(E1.4bln), $1.2000-05(E2.1bln); Oct30 $1.1800(E1.1bln)
USD/JPY: Oct22 Y104.00-10($1.6bln), Y104.50-55($2.1bln), Y104.95-105.00($1.1bln), Y105.40-50($1.1bln) Y105.80-106.00($2.7bln); Oct26 Y103.95-104.00($1.5bln-USD puts), Y105.60-75($1.2bln), Y106.95-107.00($1.6bln); Oct27 Y105.00($1.2bln); Oct28 Y105.00($1.1bln); Oct29 Y106.00($1.2bln); Oct30 Y104.50($1.9bln), Y104.80-85($1.0bln), Y106.00-05($1.9bln)
EUR/JPY: Oct26 Y122.80(E1.2bln)
EUR/GBP: Oct26 Gbp0.8900(E880mln), Gbp0.9000(E1.7bln-EUR puts)
AUD/USD: Nov02 $0.7140-45(A$1.3bln)
AUD/JPY: Oct22 Y76.44(A$2.1bln); Oct29 Y73.20(A$1.0bln-AUD puts), Y76.35-40(A$2.4bln-AUD calls)
AUD/NZD: Oct27 N$1.0809-20(A$2.5bln); Oct30 N$1.0750(A$1.2bln)
Why MNI
MNI is the leading provider
of intelligence and analysis on the Global Fixed Income, Foreign Exchange and Energy markets. We use an innovative combination of real-time analysis, deep fundamental research and journalism to provide unique and actionable insights for traders and investors. Our "All signal, no noise" approach drives an intelligence service that is succinct and timely, which is highly regarded by our time constrained client base.Our Head Office is in London with offices in Chicago, Washington and Beijing, as well as an on the ground presence in other major financial centres across the world.