
Why MNI
MNI is the leading provider
of intelligence and analysis on the Global Fixed Income, Foreign Exchange and Energy markets. We use an innovative combination of real-time analysis, deep fundamental research and journalism to provide unique and actionable insights for traders and investors. Our "All signal, no noise" approach drives an intelligence service that is succinct and timely, which is highly regarded by our time constrained client base.Our Head Office is in London with offices in Chicago, Washington and Beijing, as well as an on the ground presence in other major financial centres across the world.
EXECUTIVE SUMMARY
- FED: Evidence For Brainard's "Extremely Well Anchored" Infl Expectations
- U.S. ISSUES DO-NOT-TRAVEL ADVISORY FOR JAPAN OVER COVID, Bbg
US
FED: Fed Gov Brainard noted in a post-speech Q&A today that she saw longer-run US inflation expectations as "extremely well anchored" (as quoted by wires).
- This is arguably a subtle step up in language from Brainard's comments earlier this month where she described expectations as "very well anchored". That quote came on May 11, before the record-breaking April inflation print - 5Y5Y forward inflation closed at 2.54%, vs 2.41% at the time of today's speech.
- And yet, that change in tone is arguably justified. We note that the latter figure is 24bps below 5Y TIPS-implied breakevens, suggesting even better anchored expectations vs May 11 (when it was 16bps below) - this is the metric St Louis Fed Pres Bullard cited in an interview with MNI last week.
- While it may be reading too much into it, Brainard's comments further suggest that the Fed is keeping a watchful eye on market-based long run inflation expectations. And they do appear to have become slightly better anchored in the past couple of weeks.
CROSS ASSET: Sell-Side Models Point to Month-End USD & Bond Strength, Equity Sales
- Citi's prelim month-end model writes that both US and foreign equity investors are to be marginal USD buyers in May as US names need to hedge gains in foreign equities and foreign names need to reduce hedges in US equities.
- From fixed income investors, Citi see net fixed income hedge rebalancing to be mildly USD negative, driven by US investor need to reduce hedges in foreign bonds. The USDJPY buy signal is the only signal to exceed 0.5 SD as Japanese investors likely need to sell JPY to reduce hedges in foreign bond space.
- For the cross-asset view, their model suggests a need to rotate out of equities and into bonds (at around 0.2 historical SD). They see inflows into both Japanese and the US local equity and fixed income markets.
- Barclays' FX model corroborates this view, pointing to moderate USD buying into the May close.
- Worth noting for that the WMR fix for this month falls on Monday 31st May - a UK Bank Holiday - which may prompt some of these flows to be brought forward to the Friday fix instead.
US TSY SUMMARY: Rates Mirror Equities
Rates tracked equities higher in early trade Monday, no obvious driver at play on a light data week opener.- Heavy volumes on net tied to pick-up in June/Sep quarterly rolling ahead Friday's first notice date. Take away the roll volume and June 10Y futures traded just over 1M. 5Y roll outpaced 10s with over 1.1M by the close.
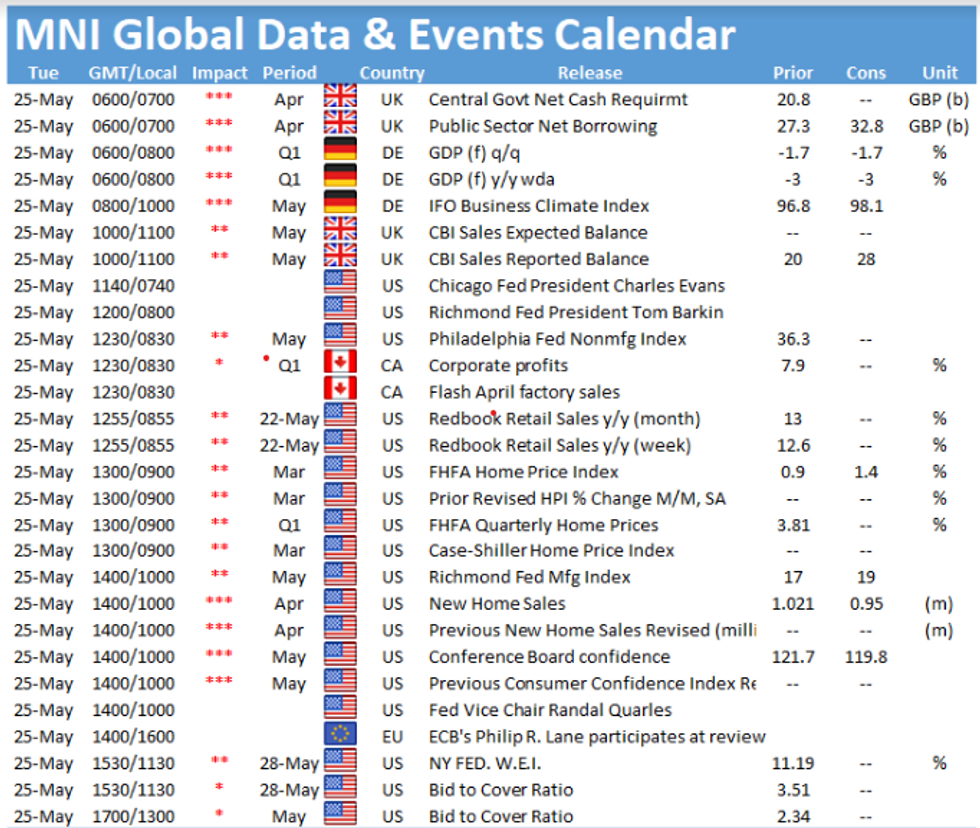
- Data picks up as week progresses, Tuesday focus on a slew of Fed speakers, more housing data, consumer confidence and 2Y Note auction.
- Short FI/FX session Friday ahead extended Memorial Holiday weekend with markets closed Monday.
- The 2-Yr yield is down 0.2bps at 0.1513%, 5-Yr is down 1.5bps at 0.8066%, 10-Yr is down 1.5bps at 1.6063%, and 30-Yr is down 1.4bps at 2.304%
OVERNIGHT DATA
- CHICAGO FED NATIONAL ACTIVITY INDEX AT 0.24 VS 1.71 PRIOR
- US: APR CHICAGO FED NATL ACTIVITY INDEX 0.24 (1.71 PRIOR, 1.20 EXP)
- US: APR CHICAGO FED NATL ACTIVITY INDEX 0.24 (1.71 PRIOR, 1.20 EXP)
- Note that this is basically just a holistic snapshot of data we've already seen, from the employment report to industrial production. March's reading was the highest since July 2020, so some retracement was expected, but the main subcomponents certainly don't make for particularly positive reading for economic momentum going into the spring (see chart).
- Production indicators' contribution to the headline index fell to +0.18 from +0.92 (reflecting the slowdown in industrial and manufacturing production), and personal consumption /housing subtracted 0.06 points (vs +0.50 in March, reflecting disappointing retail sales among other factors). Likewise with employment/unemployment/hours, whose contribution slowed to +0.05 from +0.38 (on a weak nonfarm payrolls report vs March).
- The sales/orders/inventories' category was the only category that contributed more to the headline index vs March, rising to 0.07 from -0.09.
MONTH-END EXTENSIONS/PRELIM: Barclays/Bbg Extension Estimates for US
Preliminary forecast summary compared to avg increase for prior year and same time in 2020. TIPS 0.02Y. Note: fairly steady to year ago levels, while MBS extension est gains.
| Estimate | 1Y Avg Incr | Last Year | |
| US Tsys | 0.12 | 0.08 | 0.11 |
| Agencies | 0.04 | 0.11 | 0.01 |
| Credit | 0.10 | 0.08 | 0.08 |
| Govt/Credit | 0.10 | 0.08 | 0.10 |
| MBS | 0.13 | 0.06 | 0.05 |
| Aggregate | 0.11 | 0.08 | 0.09 |
| Long Gov/Cr | 0.10 | 0.09 | 0.10 |
| Iterm Credit | 0.08 | 0.07 | 0.08 |
| Interm Gov | 0.09 | 0.08 | 0.08 |
| Interm Gov | 0.09 | 0.08 | 0.08 |
| High Yield | 0.1 | 0.06 | 0.04 |
MARKETS SNAPSHOT
Key late session market levels:
- DJIA up 234.78 points (0.69%) at 34440.36
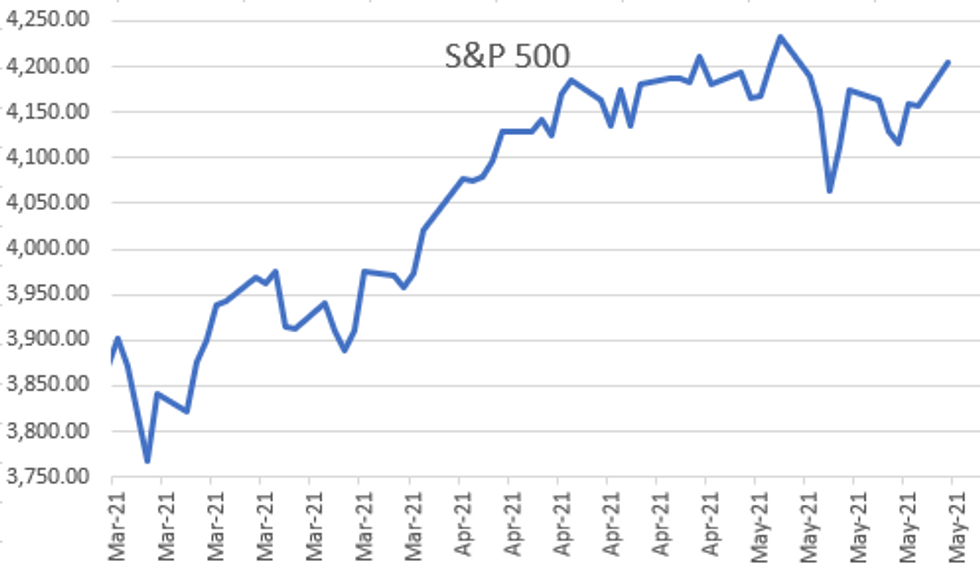
- S&P E-Mini Future up 51 points (1.23%) at 4202.75
- Nasdaq up 228 points (1.7%) at 13699
- US 10-Yr yield is down 1.4 bps at 1.608%
- US Jun 10Y are up 5.5/32 at 132-19.5
- EURUSD up 0.0034 (0.28%) at 1.2216
- USDJPY down 0.18 (-0.17%) at 108.78
- WTI Crude Oil (front-month) up $2.37 (3.73%) at $65.95
- Gold is up $1.38 (0.07%) at $1882.75
European bourses closing levels:
- EuroStoxx 50 up 9.8 points (0.24%) at 4035.58
- FTSE 100 up 33.54 points (0.48%) at 7051.59
- French CAC 40 up 22.08 points (0.35%) at 6408.49
US TSY FUTURES CLOSE:
- 3M10Y -1.445, 159.952 (L: 158.423 / H: 161.484)
- 2Y10Y -0.993, 145.631 (L: 144.101 / H: 146.826)
- 2Y30Y -0.881, 215.348 (L: 213.27 / H: 216.791)
- 5Y30Y +0.215, 149.695 (L: 147.85 / H: 150.197)
- Current futures levels:
- Jun 2Y up 0.375/32 at 110-13.25 (L: 110-12.75 / H: 110-13.375)
- Jun 5Y up 2.5/32 at 124-8.75 (L: 124-06.25 / H: 124-09.75)
- Jun 10Y up 5.5/32 at 132-19.5 (L: 132-15 / H: 132-22)
- Jun 30Y up 13/32 at 157-21 (L: 157-10 / H: 158-00)
- Jun Ultra 30Y up 27/32 at 185-25 (L: 185-04 / H: 186-16)
US EURODOLLAR FUTURES CLOSE
- Jun 21 +0.010 at 99.863
- Sep 21 +0.005 at 99.850
- Dec 21 +0.005 at 99.805
- Mar 22 +0.005 at 99.820
- Red Pack (Jun 22-Mar 23) +0.015 to +0.020
- Green Pack (Jun 23-Mar 24) +0.025 to +0.030
- Blue Pack (Jun 24-Mar 25) +0.030 to +0.040
- Gold Pack (Jun 25-Mar 26) +0.040
Short Term Rates
US DOLLAR LIBOR: Latest Settles
- O/N -0.00050 at 0.05925% (-0.00225 total last wk)
- 1 Month -0.00063 to 0.09100% (-0.00587 total last wk)
- 3 Month -0.00612 to 0.14088% (-0.00813 total last wk) ** (Record Low)
- 6 Month -0.00212 to 0.17663% (-0.00888 total last wk)
- 1 Year -0.00138 to 0.25825% (-0.00625 total last wk)
- Daily Effective Fed Funds Rate: 0.06% volume: $65B
- Daily Overnight Bank Funding Rate: 0.05% volume: $270B
- Secured Overnight Financing Rate (SOFR): 0.01%, $857B
- Broad General Collateral Rate (BGCR): 0.01%, $370B
- Tri-Party General Collateral Rate (TGCR): 0.01%, $350B
- (rate, volume levels reflect prior session)
- TIPS 1Y-7.5Y, $2.001B accepted vs. $4.696B submission
- Next scheduled purchases:
- Tue 5/25 1010-1030ET: Tsy 10Y-22.5Y, appr $1.425B
- Wed 5/26 1010-1030ET: Tsy 2.25Y-4.5Y, appr $8.425B
- Thu 5/27 1010-1030ET: Tsy 22.5Y-30Y, appr $2.025B
- Fri 5/28 1010-1030ET: Tsy 0Y-2.25Y, appr $12.425B
PIPELINE: Bank of America Priced
- Date $MM Issuer (Priced *, Launch #)
- 05/24 $3B #UBS $1B 2Y +28, $1B 2Y FRN SOFR+32, $1B 5Y +53
- 05/24 $1.25B #Flex Intermediate Holdco $800M 10Y +175, $450M 18.5Y +210
- 05/24 $1.25B *Bank of America 3NC2 +43
- 05/24 $1B *Oklahoma Gas & Electric 2NC.5 +60a
- 05/24 $750M *VeriSign 10Y
- 05/24 $500M #Northwestern Mutual Global 7Y +45
- 05/24 $Benchmark JP Morgan 1NC3 +70a, 4NC3 FRN SOFR, 8NC7 +100a
- 05/24 $Benchmark Bausch Health 7NC3 investor call
- 05/24 $Benchmark AstraZeneca EUR/USD multi-tranche investor calls (AstraZeneca issued $3B last year Aug 3: $1.2B +5Y +55, $1.3B 10Y +85, $500M 30Y +100)
- 05/?? $Benchmark Pakistan WAPDA (Water and Power Dev Authority)
EGBs-GILTS CASH CLOSE: UK Curve Sees Bull Flattening
Gilts outperformed Bunds Monday with peripheries fairly flat, on a thin-trading session (volumes running <50% of average) due to the Pentecost holiday observed throughout much of Europe.
- BOE officials addressed the TSC; main messages were that UK may needs "modest" monetary tightening (Saunders), inflation rise this year looks temporary (Gov Bailey). The ECB reported that net asset purchases remained steady last week, with PEPP buys up slightly.
- EU-Belarus tensions were an undercurrent for most of the day, but market implications were limited.
- No data and no bond issuance today; Netherlands sells up to E2bln of 2047 DSL Tuesday, while UK likely to sell new 0.125% Sep-39 Gilt linker via syndication.
Closing yields/10-Yr Spreads to Bunds:
- Germany: The 2-Yr yield is down 0.2bps at -0.656%, 5-Yr is down 0.9bps at -0.53%, 10-Yr is down 1bps at -0.14%, and 30-Yr is down 0.3bps at 0.419%.
- UK: The 2-Yr yield is down 1bps at 0.032%, 5-Yr is down 1.6bps at 0.339%, 10-Yr is down 1.9bps at 0.811%, and 30-Yr is down 2.4bps at 1.359%.
- Italian BTP spread up 0.2bps at 116.4bps / Spanish spread unch at 68.3bps
FOREX: Bitcoin Carnage: Easy Gains, Easy Losses...
- Despite the constant flow of global macro and geopolitical news, the recent carnage in the cryptocurrency market stole the 'show' in the past two weeks with Bitcoin experiencing a 50-percent drawdown from peak to trough.
- It is interesting to see that some media news and market participants have been surprised by the plunge in the crypo market; however, it is important to recall that the recent consolidation comes after a fifteen-fold rise in the price (from its low reached in March 2020 to its record high of 64,870 in mid-March).
- We know that one fundamental rule in finance is 'Easy gains come with easy losses'; there has never been an asset in history of finance that has continuously trended higher without ever experiencing a moderate to significant drawdown.
- This chart (Bitcoin in log term) shows that periods of significant appreciation in Bitcoin prices have generally been followed by short periods of sharp consolidation.
- For instance, Bitcoin experienced three significant drawdowns (of 35%, 40% and 26%, respectively) during the 2017 rally, and then was eventually followed by a LT retracement of 84% in 2018.
- 2021: is it just a short-term retracement or the start of a LT bear consolidation?
Why MNI
MNI is the leading provider
of intelligence and analysis on the Global Fixed Income, Foreign Exchange and Energy markets. We use an innovative combination of real-time analysis, deep fundamental research and journalism to provide unique and actionable insights for traders and investors. Our "All signal, no noise" approach drives an intelligence service that is succinct and timely, which is highly regarded by our time constrained client base.Our Head Office is in London with offices in Chicago, Washington and Beijing, as well as an on the ground presence in other major financial centres across the world.