
Why MNI
MNI is the leading provider
of intelligence and analysis on the Global Fixed Income, Foreign Exchange and Energy markets. We use an innovative combination of real-time analysis, deep fundamental research and journalism to provide unique and actionable insights for traders and investors. Our "All signal, no noise" approach drives an intelligence service that is succinct and timely, which is highly regarded by our time constrained client base.Our Head Office is in London with offices in Chicago, Washington and Beijing, as well as an on the ground presence in other major financial centres across the world.
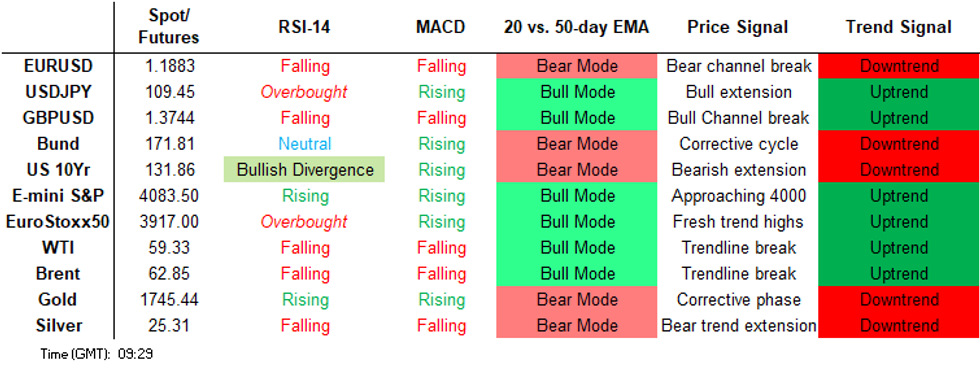
Price Signal Summary - Equity Space Bullish Mood Intact
- In the equity space:
- S&P E-minis have traded higher today reaching highs just short of 4100.00. The next objective is 4124.75, 1.382 projection of the Feb 1 - Feb 16 - Mar 4 price swing.
- EUROSTOXX 50 maintains a bullish theme with the focus on 4000.00. A break would open 4047.72, 2.236 projection of the Dec 21 - Jan 8 - Jan 28 price swing
- In the FX world, EURUSD maintains a short-term bullish tone. The focus is on 1.1941, the 50-day EMA. The moving average highlights a key resistance. The GBPUSD outlook remains bearish. Recent gains have stalled at the former bull channel base drawn off the Nov 2 low. Resistance has been defined at 1.3919, Tuesday's intraday high. EURGBP rallied yesterday. The price pattern on Tuesday is a bullish engulfing candle. This exposes the next key resistance zone at 0.8646, Mar 24 high and S/T reversal trigger and 0.8653, 50-day EMA. These levels have been probed, a clear break is required to trigger stronger gains and open 0.8731, Feb 26 high. USDJPY edges lower as the corrective cycle extends. The focus remains bullish but has entered a corrective phase. The next support is at 109.36, 20-day EMA.
- On the commodity front:
- Gold is holding onto recent gains. Key resistance is at $1755.5, Mar 18 high, where a break is required to suggest scope for a stronger bounce.
- Brent (M1) key directional triggers are:
- Resistance at $65.39, Mar 29 high and key support at $60.33, Mar 23 low and the bear trigger.
- WTI (K1) directional triggers are:
- Resistance at $62.27, Mar 30 high and support at $57.25, Mar 23 low and the bear trigger
- In the FI space, {GE} Bunds (M1) remain vulnerable despite recent gains. Key support to watch is at 170.52, Mar 18 low. The key support and bear trigger in {GB} Gilts (M1) is at 126.79, Mar 18 low.
FOREIGN EXCHANGE
EURUSD TECHS: Trading Above The 20-Day EMA
- RES 4: 1.1990 High Mar 11 and a key resistance
- RES 3: 1.1941 50-day EMA
- RES 2: 1.1915 High Apr 7
- RES 1: 1.19041.0% 10-dma envelope
- PRICE: 1.1870 @ 05:42 GMT Apr 8
- SUP 1: 1.1795 Low Apr 6
- SUP 2: 1.1738 Low Apr 5
- SUP 3: 1.1704/1695 Low Mar 31 / 38.2% of the Mar 2020 - Jan rally
- SUP 4: 1.1647 1.50 proj of the Jan 6 - Feb 5 - Feb 25 price swing
EURUSD traded higher yesterday and briefly above the 1.0% 10-dma envelope, today at 1.1904, before retracing. Recent gains have resulted in price moving into a bear channel range once again, drawn off this year's Jan 6 high and above the 20-day EMA. Gains are considered corrective though with the next firm resistance at 1.1941, the 50-day EMA. A clear break of the average would signal scope for a stronger rally. Initial support is 1.1795.
GBPUSD TECHS: Pulls Away From Former Channel Base
- RES 4: 1.4017 High Mar 4 and key resistance
- RES 3: 1.3959 High Mar 19
- RES 2: 1.3953 50% Retracement Feb - Mar Downleg
- RES 1: 1.3919/30 High Apr 6 / Former channel bull channel base
- PRICE: 1.3756 @ 05:51 GMT Apr 8
- SUP 1: 1.3725 Low Apr 7
- SUP 2: 1.3706 Low Mar 30
- SUP 3: 1.3670/63 Low Mar 25 / Low Feb 5
- SUP 4: 1.3641 38.2% retracement of the Sep 23 - Feb 24 bull cycle
GBPUSD Tuesday found resistance just above the 1.3900 handle and yesterday extended the pullback from the 1.1919 high. The failure at recent highs highlights the importance of resistance relating to the former bull channel drawn off the Nov 2, 2020 low - the bull channel base was cleared Mar 23. The base intersects at 1.3930 and a strong break higher is required to strengthen a bullish argument. Key support and bear trigger is 1.3670.
EURGBP TECHS: Tests The 50-Day EMA
- RES 4: 0.8731 High Feb 26
- RES 3: 0.8716 2.0% 10-dma envelope
- RES 2: 0.8705 High Mar 1
- RES 1: 0.8664 High Apr 7
- PRICE: 0.8628 @ 06:01 GMT Apr 8
- SUP 1: 0.8574 20-day EMA
- SUP 2: 0.8472 Low Apr 5 and the bear trigger
- SUP 3: 0.8445 3.0% Lower Bollinger Band
- SUP 4: 0.8430 Low Feb 27, 2020
EURGBP maintains this week's bullish theme following a recovery Tuesday and Wednesday. In pattern terms, Tuesday is a bullish engulfing candle and suggests the cross has entered a corrective cycle. Recent gains have now seen prices top the key resistance at 0.8646, Mar 24 high and the 50-day EMA at 0.8653. A clear break of this resistance zone is required to suggest scope for an extension of the correction. Initial support is at 0.8574.
USDJPY TECHS: Corrective Cycle
- RES 4: 112.23 High Feb 20, 2020
- RES 3: 111.71 High Mar 24
- RES 2: 111.30 High Mar 26, 2020
- RES 1: 110.55/97 High Apr 6 / High Mar 31 and the bull trigger
- PRICE: 109.68 @ 06:16 GMT Apr 8
- SUP 1: 109.36 20-day EMA
- SUP 2: 109.13 Low Mar 26
- SUP 3: 108.41 Low Mar 23 and key support
- SUP 4: 107.81 50-day EMA
USDJPY is holding onto recent lows. The pair has pulled back from last week's highs and appears to have entered a corrective cycle as an overbought condition unwinds. Attention is on the next support area at 109.36, the 20-day EMA. A break of this average would expose 109.00 and potentially below. From a trend perspective, the outlook remains bullish. The trigger for a resumption of the trend is 110.97, Mar 31 high.
EURJPY TECHS: Fresh Trend High
- RES 4: 132.36 1.382 proj of the Jun - Sep - Oct 2020 price swing
- RES 3: 131.22 1.236 proj of the Jun - Sep - Oct 2020 price swing
- RES 2: 131.04 1.0% 10-dma envelope
- RES 1: 130.69 High Apr 7
- PRICE: 130.26 @ 06:30 GMT Apr 8
- SUP 1: 129.62/13 20-day EMA / Low Mar 30
- SUP 2: 128.71/68 50-day EMA / Trendline drawn off Oct 30, 2020 low
- SUP 3: 127.50 Low Feb 22
- SUP 4: 127.31 Low Feb 17
EURJPY inched to new highs Wednesday, touching 130.69 before fading. A bullish focus remains in place - the break higher extends the recent recovery from 128.29, Mar 24 low. Key support is highlighted by the 50-day EMA at 128.71, and trendline support at 128.68, drawn off the Oct 30, 2020 low. A break of this zone would suggest scope for a deeper sell-off and signal a reversal. For bulls, further gains would open 131.22, a Fibonacci projection.
AUDUSD TECHS: Consolidating
- RES 4: 0.7750 High Mar 23
- RES 3: 0.7691 Trendline resistance drawn off the Feb 25 high
- RES 2: 0.7681 50-day EMA
- RES 1: 0.7677 High Apr 7
- PRICE: 0.7637 @ 06:37 GMT Apr 8
- SUP 1: 0.7596 Low Apr 2
- SUP 2: 0.7532/17 Low Apr 1 and the bear trigger / Low Dec 22
- SUP 3: 0.7462 Low Dec 21
- SUP 4: 0.7418 23.6% retracement of the Mar 2020 - Feb rally
AUDUSD is consolidating and remains above recent lows having recovered from 0.7532, Apr 1 low. The outlook however remains bearish. The pair has recently breached support at 0.7563, Mar 25 low and also cleared the Feb 2 low of 0.7564. This reinforces a bearish theme following the confirmation of a head and shoulders reversal pattern on Mar 23. This has opened 0.7517, Dec 22 low. Initial resistance is seen at 0.7681, the 50-day EMA.
USDCAD TECHS: Eyeing Resistance
- RES 4: 1.2763 High Feb 12
- RES 3: 1.2749 High Feb 26 and key resistance
- RES 2: 1.2700 High Mar 8
- RES 1: 1.2624/47 50-day EMA / High Mar 30 and the bull trigger
- PRICE: 1.2600 @ 06:45 GMT Apr 8
- SUP 1: 1.2502 Low Apr 5 and key near-term support
- SUP 2: 1.2462 Low Mar 19
- SUP 3: 1.2365 Low Mar 18 and the bear trigger
- SUP 4: 1.2336 1.00 proj of the Jan 28 - Feb 25 - Feb 26 price swing
USDCAD is trading closer to recent highs following the recovery from Monday's 1.2502 low. Short-term trend conditions remain bullish and attention is on resistance at 1.2647, Mar 30 high and the bull trigger. A break would confirm a resumption of the recovery that started Mar 18 and would open 1.2749, Feb 26 high. Key near-term support lies at 1.2502, Apr 5 low. A breach would instead signal a resumption of bearish activity.
FIXED INCOME
BUND TECHS: (M1) Fails To Hold Onto Yesterday's High
- RES 4: 172.78 0.764 proj of the Feb 25 - Mar 11 - Mar 18 price swing
- RES 3: 172.66 High Mar 25
- RES 2: 172.34 High Mar 29
- RES 1: 172.06 High Apr 7
- PRICE: 171.64 @ 04:59 GMT Apr 8
- SUP 1: 170.71 Low Mar 30
- SUP 2: 170.52 Low Mar 18 and key support
- SUP 3: 170.00 Round number support
- SUP 4: 169.24 Low Feb 24 and major support
Bund futures failed to hold onto yesterday's high and closed near session lows. Attention remains on key S/T support at 170.52, Mar 18 low. Clearance of this level would strengthen a bearish argument and signal scope for a deeper sell-off. The recent move lower since Mar 25 suggests the entire recovery between Feb 25 - Mar 25 has been a correction and that this correction is possibly over. Key resistance is at 172.66, Mar 25 high.
BOBL TECHS: (M1) Gains Considered Corrective
- RES 4: 135.544 0.764 proj of the Feb 26 - Mar 3 - Mar 9 price swing
- RES 3: 135.520 High Mar 25
- RES 2: 135.440 High Mar 29
- RES 1: 135.300 High Apr 7
- PRICE: 135.220 @ 04:56 GMT Apr 8
- SUP 1: 134.940 Low Mar 30
- SUP 2: 134.870 Low Mar 19 and key short-term support
- SUP 3: 134.780 Low Mar 8 and 9
- SUP 4: 134.670 61.8% retracement of the Feb 26 - Mar 25 rally
Bobl futures maintain a bearish focus despite the recovery since Apr 1. Attention remains on support at 134.870, Mar 18 low where a break would strengthen a bearish argument and suggest scope for a deeper pullback. This would open 134.780, the Mar 8 and 9 lows and potentially below. For bulls, key resistance has been defined at 135.520, Mar 25 high. Clearance of this level is required to reinstate the recent bull cycle.
SCHATZ TECHS: (M1) Focus Is On Support
- RES 4: 112.178 50-day EMA (cont)
- RES 3: 112.174 0.618 proj of the Feb 26 - Mar 2 - Mar 10 price swing
- RES 2: 112.165 High Mar 25 and the bull trigger
- RES 1: 112.145 High Apr 1
- PRICE: 112.125 @ 05:16 GMT Apr 8
- SUP 1: 112.080 Low Mar 31
- SUP 2: 112.070 Low Mar 18 and a key near-term support
- SUP 3: 112.060 Low Mar 10
- SUP 4: 112.026 61.8% retracement of the Feb 26 - Mar 25 rally
Schatz futures are unchanged and remain below recent highs. A bearish focus however remains intact despite the Apr 1 rally. A move lower would expose support at 112.070, Mar 18 low where a break would strengthen a bearish argument and open 112.060, Mar 10 low and potentially below. On the upside, key resistance has been defined at 112.165, Mar 25 high. Clearance of this level is needed to reinstate the recent bullish theme.
GILT TECHS: (M1) Downtrend Remains Intact
- RES 4: 129.75 High Feb 19
- RES 3: 129.27 High Mar 2 and the reversal trigger
- RES 2: 128.93 High Mar 25
- RES 1: 128.43 High Apr 7
- PRICE: 128.20 @ Close Apr 7
- SUP 1: 127.32 Low Apr 1
- SUP 2: 126.79 Low Mar 18 and the bear trigger
- SUP 3: 126.55 Low Apr 17, 2019 (cont)
- SUP 4: 126.00 Round number support
Despite recent gains, the downtrend in Gilt futures remains intact. Attention is on key support at 126.79, Mar 18 low and the trigger for a resumption of the trend. Clearance of this level would pave the way for a test of the 126.00 handle. On the upside, initial firm resistance has been defined at 128.93, Mar 25 high. A break of this level would expose the key hurdle for bulls at 129.27, Mar 2 high.
BTP TECHS: (M1) Resistance Remains Intact
- RES 4: 151.05 1.50 proj of the Feb 26 - Mar 3 - Mar 5 price swing
- RES 3: 150.69 76.4% retracement of the Feb 12 - 26 sell-off
- RES 2: 150.39 High Mar 11 and key short-term resistance
- RES 1: 149.88 High Apr 6
- PRICE: 148.99 @ Close Apr 7
- SUP 1: 148.57 Low Mar 30
- SUP 2: 148.36 Low Mar 18 and key short-term support
- SUP 3: 148.20 61.8% retracement of the Feb 26 - Mar 11 rally
- SUP 4: 147.68 76.4% retracement of the Feb 26 - Mar 11 rally
Recent price action in BTP futures have defined resistance at 150.39, Mar 11 high and support at 148.36, Mar 18 low as key short-term directional triggers. While 150.39 and a pivotal level at 150.69, 76.4% of the Feb 12 - 26 sell-off remain intact, the short-term risk appears skewed to the downside. A breach of 148.36, Mar 18 low would reinforce a bearish argument and signal scope for a deeper pullback. Clearance of 150.39 would instead be bullish.
EQUITIES
EUROSTOXX 50 Techs: Bulls Eye The 4000.00 Handle
- RES 4: 4110.24 High Jan 18, 2008
- RES 3: 4047.72 2.236 proj of Dec 21 - Jan 8 rally from Jan 28 low
- RES 2: 4000.00 Psychological round number
- RES 1: 3988.10 High Apr 7
- PRICE: 3956.77 @ Close Apr 6
- SUP 1: 3885.11 Low Mar 30
- SUP 2: 3841.46 Low Mar 26
- SUP 3: 3784.09 Low Mar 25 and key support
- SUP 4: 3742.53 High Feb 15 and recent breakout level
EUROSTOXX 50 registered a fresh trend high Wednesday and bullish trend conditions remain firmly in place. Last week's gains confirmed a resumption of the uptrend, extending the bullish price sequence of higher highs and higher lows. Attention is on the psychological 4000.00 next. On the downside, key trend support has been defined at 3784.09, Mar 25 low. A break is required to signal a potential short-term top. Bullish!
COMMODITIES
BRENT TECHS: (M1) Consolidating
- RES 4: $70.67 - High Mar 8 and the key bull trigger
- RES 3: $69.50 - High Mar 15
- RES 2: $67.76- High Mar 18
- RES 1: $65.39 - High Mar 29 and the bull trigger
- PRICE: $62.86 @ 06:40 Apr 8
- SUP 1: $61.25 - Low Apr 5
- SUP 2: $60.33 - Low Mar 23 and the bear trigger
- SUP 3: $58.27 - 38.2% retracement of the Nov 2 - Mar 8 rally
- SUP 4: $56.80 - High Jan 13
Brent crude futures are consolidating and remain below recent highs. Last week's break higher through $64.97, Mar 22 high failed to deliver any bullish follow through despite signalling scope for a recovery. Price would need to trade above $65.39, Mar 30 high to again suggest scope for an extension higher. This would open $67.76, the Mar 18 high. On the downside, key support and the bear trigger is at $60.33, low Mar 23.
WTI TECHS: (K1) Remains Below Resistance
- RES 4: $67.79 - High Mar 8 and the bull trigger
- RES 3: $66.44 - High Mar 15
- RES 2: $64.88 - High Mar 18 and a key near-term resistance
- RES 1: $62.27 - High Mar 30
- PRICE: $59.41 @ 06:44 Apr 8
- SUP 1: $57.63 - Low Apr 5
- SUP 2: $57.25 - Low Mar 23 and the bear trigger
- SUP 3: $55.65 - 38.2% retracement of the Nov 2 - Mar 8 rally
- SUP 4: $53.68 - High Jan 13
WTI futures are unchanged and the contract is consolidating. Last week's test above resistance at $62.04, Mar 22 high failed to deliver any bullish follow through despite signalling scope for a recovery. Price needs to clear $62.27, Mar 30 high to once again suggest scope for gains. This would open $64.88, the Mar 18 high. On the downside, key support and the bear trigger is unchanged at $57.25, Mar 23 low. A break would resume bearish pressure.
GOLD TECHS: Holding Onto Recent Gains
- RES 4: $1805.7 - High Feb 25
- RES 3: $1760.0 - 50-day EMA
- RES 2: $1755.5 - High Mar 18 and key resistance
- RES 1: $1745.5 - High Apr 6 and intraday high
- PRICE: $1743.3 @ 07:09 GMT Apr 8
- SUP 1: $1705.9 - Low Apr 1
- SUP 2: $1676.9 - Low Mar 8 and the bear trigger
- SUP 3: $1671.0 - Low Jun 5, 2020
- SUP 4: $1659.6 - Low Apr 21, 2020
Gold found support last week, bouncing off $1678.0, Mar 3 low and is holding onto recent gains. Despite the climb, the yellow metal maintains a bearish tone. A break of resistance at $1755.5, Mar 18 high is required to alter the short-term picture. This would also highlight a potential break of the 50-day EMA at $1760.0 and open $1805.7, the Feb 25 high. On the downside, key support and the bear trigger remains $1676.9, Mar 8 low.
SILVER TECHS: Probes The 20-day EMA
- RES 4: $27.081 - High Mar 1
- RES 3: $26.636 - High Mar 18 and firm near-term resistance
- RES 2: $25.752 - 50-day EMA
- RES 1: $25.314 - 20-day EMA
- PRICE: $25.326 @ 07:17 GMT Apr 8
- SUP 1: $23.781 - Low Mar 31
- SUP 2: $23.524 - Low Dec 7 and key near-term support
- SUP 3: $22.591 - Low Dec 12
- SUP 4: $21.899 - Low Nov 30 and a key support
Silver is holding onto recent gains following the recovery from $23.781, Mar 31 high and is traded higher today. Despite these recent gains, the outlook remains bearish and upticks are considered corrective. Recent weakness has opened $23.524, Dec 7 low and a key near-term support. On the upside, the 20-day EMA has been probed. An extension higher would open $25.728, the 50-day EMA.
Why MNI
MNI is the leading provider
of intelligence and analysis on the Global Fixed Income, Foreign Exchange and Energy markets. We use an innovative combination of real-time analysis, deep fundamental research and journalism to provide unique and actionable insights for traders and investors. Our "All signal, no noise" approach drives an intelligence service that is succinct and timely, which is highly regarded by our time constrained client base.Our Head Office is in London with offices in Chicago, Washington and Beijing, as well as an on the ground presence in other major financial centres across the world.