
Why MNI
MNI is the leading provider
of intelligence and analysis on the Global Fixed Income, Foreign Exchange and Energy markets. We use an innovative combination of real-time analysis, deep fundamental research and journalism to provide unique and actionable insights for traders and investors. Our "All signal, no noise" approach drives an intelligence service that is succinct and timely, which is highly regarded by our time constrained client base.Our Head Office is in London with offices in Chicago, Washington and Beijing, as well as an on the ground presence in other major financial centres across the world.
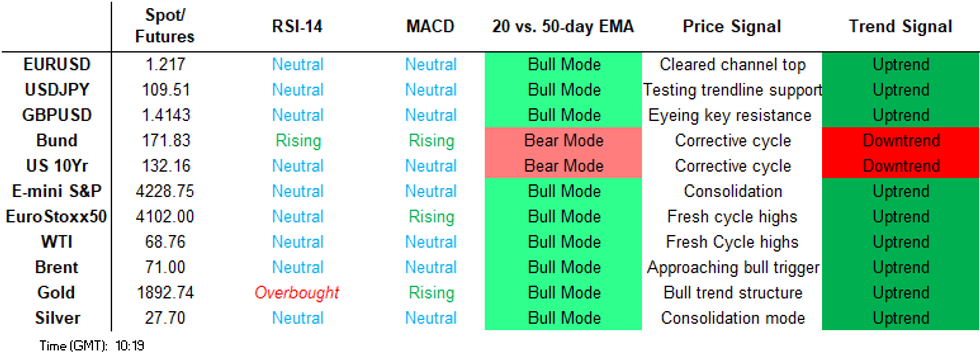
Price Signal Summary - E-Minis Key Resistance Remains Exposed
- In the equity space, S&P E-minis are trading close to the all-time high of 4238.25 May 10 high. This remains a key resistance and the trigger for a resumption of the uptrend. Initial support is at 4165.25, Jun 3 low.
- In the FX space, EURUSD remains vulnerable following last week's price action. The focus is on 1.2102, the 50-day EMA. GBPUSD remains below last week's high of 1.4248 on Jun 1. A deeper pullback would expose 1.4006, May 13 low. Note the 50-day EMA intersects at 1.4019 and also represents a key support level. USDJPY sold off sharply Friday and yesterday support at 109.33, Jun 1 low was probed. A clear break lower would threaten the recent uptrend and expose 108.56, May 25 low.
- On the commodity front, Gold faced strong selling pressure Jun 3 and together with the recent overbought condition, the move lower suggests scope for a deeper corrective pullback. The next support is $1852.3, May 19 low. Trend conditions in Oil remain bullish despite the most recent pullback. Brent (Q1) gains have opened $73.00 next, a round number resistance. WTI (N1) yesterday tested the $70.00 psychological level. A break would open $70.22, 2.618 projection of the Mar 23 - 30 - Apr 5 price swing
- Within FI, {GE} Bunds (U1) have tested the 50-day EMA at 172.00 but have not yet confirmed a clear break. While it holds, the outlook is bearish. Support to watch is at 170.99. May 31 low. {GB} Gilts (U1) remains below resistance at 127.74/82, highs between Apr 20 and May 26. A bearish risk remains present.
FOREIGN EXCHANGE
EURUSD TECHS: 50-Day EMA Remains Exposed
- RES 4: 1.2414 High Apr 17, 2018
- RES 3: 1.2349/53 High Jan 6 / High Apr 20, 2018
- RES 2: 1.2266/85 High May 25 and the bull trigger / High Jan 8
- RES 1: 1.2214 High Jun 3
- PRICE: 1.2181 @ 05:56 BST Jun 8
- SUP 1: 1.2104/2102 Low Jun 4 / 50-day EMA
- SUP 2: 1.2052 Low May 13 and key short-term support
- SUP 3: 1.1986 Low May 5
- SUP 4: 1.1919 61.8% retracement of the Mar 31 - May 25 rally
EURUSD is holding onto its most recent gains and is trading above last week's low of 1.2104. The pair remains vulnerable though following a sharp pullback Jun 3 that saw price trade through initial support at 1.2133, May 28 low. If correct, this highlights potential for a deeper correction and attention is on the 50-day EMA at 1.2102 that also represents a key area of support. On the upside, primary resistance has been defined at 1.2266, May 25 high.
GBPUSD TECHS: Consolidating
- RES 4: 1.4448 2.0% 10-dma envelope
- RES 3: 1.4377 High Apr 17, 2018 and a key resistance
- RES 2: 1.4315 High Apr 18, 2018
- RES 1: 1.4203/48 High Jun 3 / High Jun 1 and the bull trigger
- PRICE: 1.4159 @ 06:04 BST Jun 8
- SUP 1: 1.4083 Low Jun 4
- SUP 2: 1.4019/06 50-day EMA / Low May 13
- SUP 3: 1.3972 Low May 10
- SUP 4: 1.3858 Low May 6
GBPUSD is in a range and remains below last week's 1.4248 high from Jun 1. Trend conditions are bullish. The probe last week of former resistance at 1.4237, Feb 24 high reinforces a broader bullish theme however a clear break is required to confirm a resumption of the uptrend. This would open 1.4315 next, April 18, 2018 high. On the downside, initial firm support is at 1.4083, the Jun 4 low. A break would expose the 50-day EMA at 1.4019.
EURGBP TECHS: Attention Is On Support
- RES 4: 0.8783 2.0% 10-dma envelope and high Feb 12
- RES 3: 0.8731 High Feb 26
- RES 2: 0.8701/21 High May 7 / High Apr 26 and the bull Trigger
- RES 1: 0.8672 High May 25
- PRICE: 0.8603 @ 06:18 BST Jun 8
- SUP 1: 0.8565/61 Low Jun 4 / Low May 12
- SUP 2: 0.8531 76.4% retracement of the Apr 5 - 26 rally
- SUP 3: 0.8472 Low Apr 5 and the bear trigger
- SUP 4: 0.8442 2.0% 10-dma envelope
EURGBP continues to trade within its recently defined range and the broader outlook remains bearish following the move lower between May 25 - 28. Initial resistance has been defined at 0.8672, May 25 high and attention is on support at 0.8561, May 12 low where a break would strengthen a bearish case and expose 0.8531, a Fibonacci retracement ahead of key support at 0.8472, Apr 5 low. On the upside, a move above 0.8672 alters the picture.
USDJPY TECHS: Probed Support
- RES 4: 111.30 High Mar 26, 2020
- RES 3: 110.97 High Mar 31 and the bull trigger
- RES 2: 110.55 High Apr 6
- RES 1: 110.33 High Jun 4
- PRICE: 109.44 @ 06:30 BST Jun 8
- SUP 1: 109.19/108.92 Low Jun 7 / 50-day EMA
- SUP 2: 108.56/34 Low May 25 / Low May 7 and key S/T support
- SUP 3: 107.48 Low Apr 23 and the bear trigger
- SUP 4: 106.97 Low Mar 4
USDJPY traded lower yesterday extending the pullback from Monday's 110.33 high. The move lower has resulted in a print below initial key short-term support at 109.33, Jun 1 low. This dents the bullish theme and a deeper sell-off would expose 108.56, May 25 low. A recovery would instead refocus attention on 110.33 where a break would open this year's 110.97 high from Mar 31 high.
EURJPY TECHS: Pullback Considered Corrective
- RES 4: 134.86 Bull channel top drawn off the Oct 30, 2020 low
- RES 3: 134.80 High Feb 8, 2018
- RES 2: 134.19 1.618 proj of Jun - Sep - Oct 2020 swing
- RES 1: 134.13 High Jun 1 and the bull trigger
- PRICE: 133.31 @ 06:37 BST Jun 8
- SUP 1: 132.89 Low Jun 7
- SUP 2: 132.52 Low May 24
- SUP 3: 131.82 50-day EMA
- SUP 4: 131.35 Bull channel base drawn off the Oct 30, 2020 low
EURJPY trend conditions remain bullish despite the recent move lower. The pullback is likely a correction. The cross touched a high of 134.13 on Jun 1 and the extension reinforces bullish conditions signalling scope for further gains within the rising channel drawn off the Oct 30 2020 low. The top of the channel intersects at 134.86. Firm support lies at 132.52, May 24 low. Initial support is seen at 132.89, yesterday's low.
AUDUSD TECHS: Outlook Remains Bearish
- RES 4: 0.8007 High Feb 25
- RES 3: 0.7891/95 High May 10 / 76.4% of the Feb 25 - Apr 1 sell-off
- RES 2: 0.7813/46 High May 18 / High May 12
- RES 1: 0.7773 High Jun 2
- PRICE: 0.7745 @ 06:45 BST Jun 8
- SUP 1: 0.7646 Low Jun 3
- SUP 2: 0.7635 Low Apr 14
- SUP 3: 0.7586 Low Apr 13
- SUP 4: 0.7536 200-dma
AUDUSD broke through 0.7675 on Jun 3 but has since reversed the sharp move lower. Last week's break lower does signal the end of the recent period of consolidation that has been in place since mid-April. A resumption of weakness would open 0.7586, Apr 13 low and 0.7532, Apr 1 low and a key support. Initial resistance is at 0.7773, Jun 2 high ahead of 0.7813, May 18 high. A break of the latter would ease any developing bearish pressure.
USDCAD TECHS: Consolidation Mode
- RES 4: 1.2419 High Apr 27
- RES 3: 1.2351 High May 4 and a key near-term resistance
- RES 2: 1.2257 50-day EMA
- RES 1: 1.2142/2203 High May 27 / High May 6
- PRICE: 1.2087 @ 07:50 BST Jun 8
- SUP 1: 1.2007 Low May 18
- SUP 2: 1.2000 Psychological round number
- SUP 3: 1.1920 Low May 2015
- SUP 4: 1.1836 2.0% 10-dma envelope
USDCAD remains in a range. Trend conditions however remain bearish. The pair printed a new trend low of 1.2007 on Jun 1 , extending the primary downtrend. USDCAD continues to erode major support at 1.2062, Sep 2017 low. This level represents an important pivot point marking either the base of a broad range or the midpoint of a double top reversal. Initial firm resistance is at 1.2203, May 13 high.
FIXED INCOME
BUND TECHS: (U1) Testing The 50-Day EMA
- RES 4: 172.80 High Apr 23
- RES 3: 172.60 High May 7
- RES 2: 172.08 50.0% retracement of the Mar 25 - May 19 sell-off
- RES 1: 172.05 High Jun 4 and the bull trigger
- PRICE: 171.74 @ 05:10 BST Jun 8
- SUP 1: 170.99 Low Mar 31 and key short-term support
- SUP 2: 170.56 Low May 24
- SUP 3: 170.27 Low May 21
- SUP 4: 169.75 Low May 19 and the bear trigger
Bund futures have recently probed resistance at 171.98, May 26 high and the 50-Day EMA at 172.00. The contract however is still trading in a range. Also, recent gains have failed so far, to confirm a clear breach of the 50-day EMA. A reversal lower would signal scope for a move towards 170.56, May 24 low and open the key support and bear trigger at 169.75, May 19 low. A clear break of the 50-day EMA would however be bullish.
BOBL TECHS: (U1) Bullish Price Sequence
- RES 4: 134.357 0.764 proj of the May 20 - 26 - 31 price swing
- RES 3: 134.290 High May 7
- RES 2: 134.262 0.618 proj of the May 20 - 26 - 31 price swing
- RES 1: 134.220 High Jun 4
- PRICE: 134.1100 @ 05:08 BST Jun 8
- SUP 1: 133.991 20-day EMA
- SUP 2: 133.860 Low May 28 and 31 and key short-term support
- SUP 3: 133.690 Low May 24
- SUP 4: 133.450 Low May 20 and the bear trigger
Bobl futures traded higher Jun 4 and have confirmed a clear break of resistance at 134.100. The break higher also confirms a bullish price sequence of higher highs and higher lows as the rally from the May 20 low extends. This signals scope for a move towards 134.262, a Fibonacci projection and 134.290, the May 7 high. Key short-term support has been defined at 133.860, May 28 and 31 low. A break would be bearish.
SCHATZ TECHS: (U1) Directional Triggers Intact
- RES 4: 112.204 138.2 proj of the May 24 - 27 - 31 price swing
- RES 3: 112.197 1.236 proj of the May 24 - 27 - 31 price swing
- RES 2: 112.185 1.00 proj of the May 24 - 27 - 31 price swing
- RES 1: 112.180 High May 27
- PRICE: 112.155 @ 05:27 BST Jun 8
- SUP 1: 112.145 Low Jun 3
- SUP 2: 112.135 Low May 27, 28 and 31
- SUP 3: 112.125 Low May 17
- SUP 4: 112.110 Low Apr 20 and key support
Schatz futures traded lower yesterday and price remains within its recent range. Recent price action has defined key short-term directional triggers at; 112.180, May 27 high and 112.135, the lows between May 27 - 31. A break of support would strengthen a bearish case and open 112.120, May 17 low and the key support at 112.110. Clearance of resistance at 112.180 would instead signal scope for a stronger short-term recovery.
GILT TECHS: (U1) Bearish Focus
- RES 4: 128.10 2.500 projection of the May 13 - 19 price swing
- RES 3: 127.89 2.236 proj of the May 13 - 19 price swing
- RES 2: 127.74/82 High May 7, 26 / High Apr 20 and a key resistance
- RES 1: 127.37 High May 28
- PRICE: 127.16 @ Close Jun 7
- SUP 1: 126.70 Low Jun 3
- SUP 2: 126.55 Low May 21
- SUP 3: 126.12 Low May 19
- SUP 4: 125.94 Low May 13 and key support
Gilt futures broader outlook remains bearish. Recent gains stalled on May 27, resulting in a sharp pullback. This signals the end of the recent corrective recovery. If correct, it suggests scope for short-term weakness that would expose last month's low of 125.94 on May 13. This level also represents the bear trigger. Key short-term resistance is marked by the highs of early May and late April where a break would instead be bullish.
BTP TECHS: (U1) Watching Support
- RES 4: 151.88 0.618 proj of the May 19 - 27 - 28 price swing
- RES 3: 151.43 0.618 proj of the May 19 - 27 - 28 price swing
- RES 2: 151.07 0.50 proj of the May 19 - 27 - 28 price swing
- RES 1: 150.80/51.00 High Jun 7 / Round Number Resistance
- PRICE: 150.24 @ Close Jun 7
- SUP 1: 149.94 Low Low Jun 1
- SUP 2: 149.53 Low May 28 and key near-term support
- SUP 3: 148.80 Low May 25
- SUP 4: 148.24 Low May 24
BTP futures remain in a clear downtrend following the recent extension lower to 147.00 on Mar 19. However, since the May 19 low, prices have recovered and a corrective cycle remains. The recent recovery is allowing an earlier oversold condition to unwind. Attention is on the 151.00 handle next and 151.07, a Fibonacci projection. Initial firm support has been defined at 149.53, the May 28 low. A break would signal a potential reversal.
EQUITIES
EUROSTOXX 50 TECHS: (M1) Fresh Trend High
- RES 4: 4175.00 Low Nov 26, 2007 (cont)
- RES 3: 4168.83 Bull channel top drawn off the Feb 1 low
- RES 2: 4140.00 High Jan 18, 2008 (cont)
- RES 1: 4110.00 Intraday high
- PRICE: 4098.00 @ 05:45 BST Jun 8
- SUP 1: 4033.70/4016.00 20-day EMA / Low May 27
- SUP 2: 3952.80/3882.00 50-day EMA / Low May 19
- SUP 3: 3844.00 Low May 13 and the bear trigger
- SUP 4: 3727.00 Low Mar 25
EUROSTOXX 50 futures remain bullish with the contract achieving a fresh trend high of 4110.00 overnight. The move higher both yesterday and today, confirms a resumption of the underlying uptrend and maintains the broad positive price sequence of higher highs and higher lows. The focus is on 4140.00 next, the Jan 18, 2008 high. On the downside, firm trend support is unchanged at 3882.00, May 19 low. Initial support lies at 4033.70.
E-MINI S&P (M1): Bullish Price Structure
- RES 4: 4328.44 3.0% 10-dma envelope
- RES 3: 4239.26 1.764 proj of the Feb 1 - Feb 16 - Mar 4 price swing
- RES 2: 4238.25 High May 10 and the bull trigger
- RES 1: 4234.75 Intraday high
- PRICE: 4226.00 @ 06:54 BST Jun 8
- SUP 1: 4165.25 Low Jun 3
- SUP 2: 4120.93/4055.60 50-day EMA / Low May 19
- SUP 3: 4029.25 Low May 13 and key short-term support
- SUP 4: 4021.00 Low Apr 5
S&P E-minis trend outlook is unchanged and remains bullish. Recent gains resulted in a break of 4185.00, May 21 high reinforcing the bullish significance of the recovery in May from support defined by the 50-day EMA - the average was tested twice in May. Attention is on key resistance and the bull trigger at 4238.25, May 10 high. Initial firm support is at 4055.50, May 19 low. Last week's low of 4165.25 marks the first support.
COMMODITIES
BRENT TECHS: (Q1) Bullish Structure Still Intact
- RES 4: $74.20 - High Apr 26, 2019 (cont)
- RES 3: $73.40 - High May 20 2019 (cont)
- RES 2: $73.00 - Round number resistance
- RES 1: $72.27 - High Jun 7
- PRICE: $70.99 @ 06:54 BST Jun 8
- SUP 1: $69.90 High May 18 and the recent break out level
- SUP 2: $69.19 - 20-day EMA
- SUP 3: $66.39/64.50 - Low May 24 / Low May 21 and key support
- SUP 4: $63.51 - Low Apr 22
Brent crude futures traded higher last week. Attention is on $72.21, a Fibonacci extension and $73.40, the May 20, 2019 high (cont). Price recently breached the 50-day EMA however levels around the average continue to provide strong trend support. Weakness through $64.50, the May 21 low is required to signal a key short-term top. Initial support lies at $69.90, May 18 high with the 20-day EMA intersecting at $69.19.
WTI TECHS: (N1) Fresh Trend High
- RES 4: $72.70 - High Oct 15, 2018 (cont)
- RES 3: $70.92 - 2.764 proj of Mar 23 - 30 - Apr 5 price swing
- RES 2: $70.22 - 2.618 proj of Mar 23 - 30 - Apr 5 price swing
- RES 1: $70.00 - Psychological round number and the Jun 7 high
- PRICE: $68.77 @ 07:00 BST Jun 8
- SUP 1: $67.02 - High May 18
- SUP 2: $66.49 - 20-day EMA
- SUP 3: $63.63/61.56 - Low May 24 / Low May 21
- SUP 4: $60.55 - Low Apr 22 and key short-term support
WTI crude futures remain bullish and the contract traded to a fresh high yesterday before pulling back. The psychological $70.00 handle has been tested. A break of $70.00 would reinforce current trend conditions and open $70.22 and $70.92, Fibonacci projections. Key trend support has been defined at $61.56, May 21 low. A break is required to suggest a key short-term top. Initial support is at $67.02.
GOLD TECHS: Remains Below The Recent High
- RES 4: $1965.6 - High Nov 9, 2020
- RES 3: $1959.4 - High Jan 6 and key resistance
- RES 2: $1927.7 - High Jan 7
- RES 1: $1916.6 - High Jun 1 and the bull trigger
- PRICE: $1897.0 @ 07:19 BST Jun 8
- SUP 1: $1856.2 - Low Jun 4
- SUP 2: $1852.3 - Low May 19
- SUP 3: $1833.3 - 50-day EMA
- SUP 4: $1808.9 - Low May 13
Gold faced strong selling pressure Jun 3 and the yellow metal probed the 20-day EMA currently at $1873.6. A clear breach of this EMA would signal scope for a deeper pullback to $1852.3, May 19 low. Recent weakness is allowing an overbought condition to unwind. Note that below $1852.3 lies support highlighted by the 50-day EMA at $1833.3. The 50-day EMA marks a key trend support area. Key resistance has been defined at $1916.6.
SILVER TECHS: Remains Vulnerable
- RES 4: $30.100 - High Feb 1 and key resistance
- RES 3: $29.053 - High Feb 2
- RES 2: $28.556/753 - High Jun 1 / High May 18
- RES 1: $28.237 - High Jun 3
- PRICE: $27.761 @ 07:23 BST Jun 8
- SUP 1: $27.040 - Low Jun 3
- SUP 2: $27.009 - 50-day EMA
- SUP 3: $26.721 - Low Mar 13 and key near-term support
- SUP 4: $25.718 - Low Apr 29
Silver faced selling pressure on Jun 3 moving sharply below the $28.00 handle. The move lower exposes support defined by the 50-day EMA at $27.009. A clear break of the EMA would concern bulls and attention would likely turn to support at $26.721, Mar 13 low. Key resistance has been defined at $28.753, May 18 high. Initial resistance though is seen at $28.237, Jun 3 high.
Why MNI
MNI is the leading provider
of intelligence and analysis on the Global Fixed Income, Foreign Exchange and Energy markets. We use an innovative combination of real-time analysis, deep fundamental research and journalism to provide unique and actionable insights for traders and investors. Our "All signal, no noise" approach drives an intelligence service that is succinct and timely, which is highly regarded by our time constrained client base.Our Head Office is in London with offices in Chicago, Washington and Beijing, as well as an on the ground presence in other major financial centres across the world.