
Why MNI
MNI is the leading provider
of intelligence and analysis on the Global Fixed Income, Foreign Exchange and Energy markets. We use an innovative combination of real-time analysis, deep fundamental research and journalism to provide unique and actionable insights for traders and investors. Our "All signal, no noise" approach drives an intelligence service that is succinct and timely, which is highly regarded by our time constrained client base.Our Head Office is in London with offices in Chicago, Washington and Beijing, as well as an on the ground presence in other major financial centres across the world.
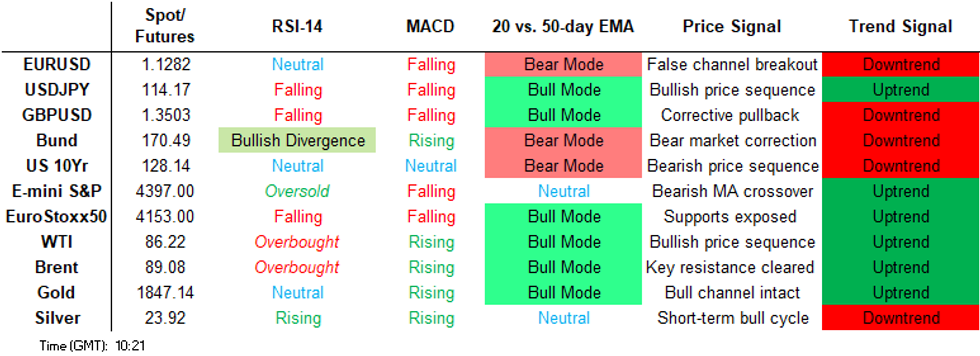
Price Signal Summary - Equity Rebound Allows Oversold Condition To Unwind
- In the equity space, S&P E-minis sold off sharply Monday but recovered strongly from the day low. The contract is firmer today and back above 4400.00. This is allowing a recent oversold condition to unwind. Resistance to watch is at 4485.75, Dec 3 low and a recent breakout level. The bear trigger is Monday’s low of 4212.75. EUROSTOXX 50 futures are firmer this morning too as the contract recovers from Monday’s low of 3990.50. Resistance is seen 4215.50, Jan 24 high. Gains are considered corrective.
- In FX, EURUSD is trading lower this morning and sights are on support at 1.1222, Dec 15 low. Moving average studies continue to highlight a downtrend. GBPUSD remains vulnerable. The recent sell-off has resulted in a break of both the 20- and 50-day EMAs. This allows for a deeper unwinding of the bull rally between Dec 8 - Jan 13 and the focus is on 1.3456, 50.0% retracement of the Dec 8 - Jan 13 bull phase. USDJPY Monday probed support at 113.49, Jan 14 low. This cancels recent bullish signals and the doji candle reversal on Jan 14. A deeper pullback would open 113.14, Dec 17 low. Resistance is at 115.06, Jan 18 high.
- On the commodity front, Gold maintains a positive tone. The metal traded higher yesterday to resume its uptrend and has cleared resistance at $1848.00, 76.4% of the Nov 16 - Dec 15 downleg. The focus is on $1871.0, Nov 18 low. WTI futures remain in an uptrend and the most recent pullback is still considered corrective. Key support to watch is at the 20-day EMA. It intersects at $80.83 today.
- In the FI space, Bund futures traded higher Monday and probed key short-term resistance at 171.00, the Jan 13 high. A clear break of this hurdle would signal potential for a stronger short-term recovery and open the 50-day EMA at 171.60. A resumption of weakness would refocus attention on the bear trigger is 168.95, Jan 19 low. Gilts remain in a downtrend. Key short-term resistance is at 123.79, Jan 13 high where a break is required to highlight a short-term base. The bear trigger is unchanged at 121.93, Jan 19 low
FOREIGN EXCHANGE
EURUSD TECHS: Eyeing Support
- RES 4: 1.1692 High Oct 28, 2021
- RES 3: 1.1608 High Nov 9
- RES 2: 1.1483/1514 High Jan 14 and key resistance / Low Nov 5
- RES 1: 1.1421 High Jan 18
- PRICE: 1.1305 @ 06:00 GMT Jan 26
- SUP 1: 1.1263 Low Jan 25
- SUP 2: 1.1253 1.0% 10-dma envelope
- SUP 3: 1.1222 Low Dec 15
- SUP 4: 1.1186/85 Low Nov 24 / Low Jul 1, 2020 and the bear trigger
EURUSD bearish threat remains present and the pair traded lower again Tuesday. A bearish theme follows the recent break below both the 20- and 50-day EMAs and more importantly, a failure to strengthen following recent bullish technical developments - a range breakout and breach of a bear channel resistance earlier this month. Further downside would expose 1.1222, the Dec 15 low. Key resistance is unchanged at 1.1483, Jan 14 high.
GBPUSD TECHS: Bearish Short-Term Threat
- RES 4: 1.3913 High Sep 14, 2021
- RES 3: 1.3835 High Oct 20 and key resistance
- RES 2: 1.3728/49 200-dma / High Jan 13
- RES 1: 1.3566/ 3662 High Jan 24 High Jan 20
- PRICE: 1.3509 @ 06:06 GMT Jan 26
- SUP 1: 1.3437 Low Jan 25
- SUP 2: 1.3409 Low Dec 29
- SUP 3: 1.3387 61.8% retracement of the Dec 8 - Jan 13 bull phase
- SUP 4: 1.3301 76.4% retracement of the Dec 8 - Jan 13 bull phase
GBPUSD remains vulnerable following recent weakness. The pair has traded below both the 20- and 50-day EMAs to reinforce a short-term bearish threat and suggest scope for a deeper pullback. A resumption of weakness would open 1.3409, the Dec 29 low and 1.3387, a Fibonacci retracement. Initial firm resistance has been defined at 1.3662, the Dec 20 high. A break of this level is required to ease the developing bearish threat.
EURGBP TECHS: Gains Stall At The 50-Day EMA
- RES 4: 0.8553 High Dec 10 and 14
- RES 3: 0.8498 High Dec 23
- RES 2: 0.8465 High Dec 24
- RES 1: 0.8418/23 50-day EMA / High Jan 24
- PRICE: 0.8367 @ 06:11 GMT Jan 26
- SUP 1: 0.8351/8305 Low Jan 24 / Low Jan 20, lowest since 2020
- SUP 3: 0.8300 Base of the multi-year broad range
- SUP 4: 0.8282/77 Low Feb’20 / Dec’19 and key bear trigger
- SUP 4: 0.8242 50% Fibonacci Retracement 2015-2020 Upleg
EURGBP remains above the recent multiyear low of 0.8305, Jan 20 low. Monday’s rally stalled at the 50-day EMA, currently at 0.8418. Gains are considered corrective and the trend remains down. A return lower would refocus attention on the major support and bear triggers at 0.8282/77, the Feb’20 and Dec’19 lows plus the base of a broad multi-year range at 0.8300. For bulls, clearance of the 50-day EMA would allow for a stronger correction.
USDJPY TECHS: Support Remains Exposed
- RES 4: 118.07 2.236 proj of Apr 23 - Jul 2 - Aug 4 2021 price swing
- RES 3: 117.08 2.00 proj of Apr 23 - Jul 2 - Aug 4 2021 price swing
- RES 2: 115.68/116.35 High Jan 11 / High Jan 4 and the bull trigger
- RES 1: 114.51/115.06 20-day EMA / High Jan 18
- PRICE: 113.89 @ 06:18 GMT Jan 26
- SUP 1: 113.47/49 Low Jan 24/14
- SUP 2: 113.43 76.4% of the Nov 30 - Jan 4 rally
- SUP 3: 113.14 Low Dec 17
- SUP 4: 112.53/111.94 Low Nov 30 / 2.0% 10-dma envelope
USDJPY remains closer to its recent lows following the pullback from 115.06, Jan 18 high. The pair has tested key support at 113.49, Jan 14 low. The print below 113.49 Monday negates a recent bullish candle pattern - a doji on Jan 14. Further weakness would open 113.43, a Fibonacci retracement and 113.14, the Dec 17 low. Key near-term resistance is at 115.06, Jan 18 high. A break of this hurdle would reinstate a bullish theme.
EURJPY TECHS: Heading South
- RES 4: 132.56/76 High Nov 4 / 3% Upper Bollinger Band
- RES 3: 132.04 76.4% retracement of the Oct 20 - Dec 3 downleg
- RES 2: 131.60 High Jan 5 and the bull trigger
- RES 1: 129.82/131.18 20- and 50-day EMA / High Jan 18
- PRICE: 128.78 @ 06:23 GMT Jan 26
- SUP 1: 128.25 Low Jan 25
- SUP 2: 128.05 Low Dec 21
- SUP 3: 127.39 Low Dec 6 and a major support
- SUP 4: 127.04 Low Feb 15, 2021
EURJPY remains under pressure following the recent move lower and the cross is trading below its 50-day EMA. Price yesterday probed 128.38, a Fibonacci retracement. A clear break of this level would expose 127.39, the Dec 6 low and a key near-term support. Key short-term resistance has been defined at 131.60, Jan 5 high. Initial resistance though is at 129.82, the 20- and 50-day EMAs.
AUDUSD TECHS: Bearish Focus
- RES 4: 0.7371 High Nov 15
- RES 3: 0.7277/7314 High Jan 20 / High Jan 13
- RES 2: 0.7219 50-day EMA
- RES 1: 0.7188 High Jan 24
- PRICE: 0.7159 @ 06:32 GMT Jan 26
- SUP 1: 0.7091/82 Low Jan 24 / Low Dec 20 and a key support
- SUP 2: 0.7069 76.4% retracement of the Dec 3 - Jan 13 upleg
- SUP 3: 0.6993/91 Low Dec 3 / Low Nov 2, 2020 and key support
- SUP 4: 0.6963 Low Jul 16, 2020
AUDUSD traded sharply lower Monday resulting in a break of support at 0.7130, Jan 7 low. The recent failure to remain above the 50-day EMA and the subsequent sharp sell-off strengthens the case for bears and signals potential for a deeper pullback. This has exposed 0.7082, the Dec 20 low and 0.6993 further out, Dec 3 low. Monday’s intraday high of 0.7188, marks initial resistance.
USDCAD TECHS: Remains Below Recent Highs
- RES 4: 1.2814 High Jan 6 and a key resistance
- RES 3: 1.2768 61.8% retracement of the Dec 20 - Jan 19 sell-off
- RES 2: 1.2708 50.0% retracement of the Dec 20 - Jan 19 sell-off
- RES 1: 1.2702 High Jan 24
- PRICE: 1.2594 @ 06:42 GMT Jan 26
- SUP 1: 1.2555 Low Jan 24
- SUP 2: 1.2451/48 Low Jan 19 / 76.4% of the Oct - Dec rally
- SUP 3: 1.2387 Low Nov 10
- SUP 4: 1.2328 Low Oct 29
USDCAD remains below recent highs. The pair started the week on a firmer note and for now appears set to extend its recovery from 1.2451, Jan 19 low. Price has traded above the 50-day EMA and the clear break of this average, at 1.2649, would expose 1.2708 and 1.2768, Fibonacci retracement levels. On the downside, initial support lies at Monday’s intraday low of 1.2555. Key support has been defined at 1.2451, Jan 19 low and marks the bear trigger.
FIXED INCOME
BUND TECHS: (H2) Remains Below 171.00
- RES 4: 171.99 50.0% retracement of the Aug 12 - Jan 19 downleg
- RES 3: 171.77 Low Nov 24 and recent breakout level
- RES 2: 171.60 50-day EMA
- RES 1: 170.74 High Jan 25
- PRICE: 170.35 @ 05:02 GMT Jan 26
- SUP 1: 169.92 Low Jan g20
- SUP 2: 168.95 Low Jan 19
- SUP 3: 168.84 3.764 proj of the Dec 8 - Dec 20 price swing
- SUP 4: 168.46 4.00 proj of the Dec 8 - Dec 20 price swing
Bund futures traded higher Monday and probed key short-term resistance at 171.00, the Jan 13 high. A clear break of this hurdle would signal potential for a stronger short-term recovery and open the 50-day EMA at 171.60. Broader trend conditions remain bearish however. A resumption of weakness would instead refocus attention on the recent low and bear trigger at 168.95, the Jan 19 low.
BOBL TECHS: (H2) Corrective Cycle Still In Play
- RES 4: 133.928 76.4% retracement of the Dec 20 - Jan 19 sell-off
- RES 3: 133.636 61.8% retracement of the Dec 20 - Jan 19 sell-off
- RES 2: 133.437 50-day EMA
- RES 1: 133.250 High Jan 24
- PRICE: 132.970 @ 05:00 GMT Jan 26
- SUP 1: 132.720 Low Jan 21
- SUP 2: 132.400 Low Jan 19 and the bear trigger
- SUP 3: 132.350 2.50 proj of the Nov 30 - Dec 8 - 20 price swing
- SUP 4: 132.253 2.618 proj of the Nov 30 - Dec 8 - 20 price swing
Despite the recent bounce, trend conditions in Bobl futures remain bearish. There is potential however for a stronger short-term recovery following the breach of 133.110 Monday, the Jan 6 and 13 highs. This has opened the 50-day EMA at 133.437. For bears, last week’s break of 132.620, Jan 11 low maintains the bearish price sequence of lower lows and lower highs. A resumption of weakness would refocus attention on 132.400, Jan 19 low.
SCHATZ TECHS: (H2) Holding Onto The Bulk Of Its Recent Gains
- RES 4: 112.176 112.265 High Dec 20 and a key resistance
- RES 3: 112.250 High Dec 21
- RES 2: 112.176 76.4% retracement of the Dec 20 - Jan 19 downleg
- RES 1: 112.145 High Jan 24
- PRICE: 112.085 @ 03:30 GMT Jan 26
- SUP 1: 112.030 Low Jan 24
- SUP 2: 111.980/890 Low Jan 21 / Low Jan 19
- SUP 3: 112.861 1.618 proj of the Nov 26 - Dec 16 - 20 price swing
- SUP 4: 111.824 1.764 proj of the Nov 26 - Dec 16 - 20 price swing
Schatz futures are holding onto the bulk of recent gains. The break higher has resulted in a move through both the 20- and 50-day EMAs. The strong gains set the scene for a climb towards 112.176, a Fibonacci retracement. Clearance of this retracement would strengthen bullish conditions and open 112.265 further out, Dec 20 high. Initial support is seen at Monday’s low of 112.030. The bear trigger is far off at 111.890.
GILT TECHS: (H2) Watching Key Short-Term Resistance
- RES 4: 124.80 50.0% retracement of the Dec 8 - Jan 19 downleg
- RES 3: 124.50 50-day EMA
- RES 2: 124.17 Low Nov 24
- RES 1: 123.79 High Jan 13 and a key near-term resistance
- PRICE: 123.31 @ Close Jan 25
- SUP 1: 122.83/121.93 Low Jan 21 / Low Jan 19 and the bear trigger
- SUP 2: 121.61 Low Nov 13 2018 (cont)
- SUP 3: 121.12 Low Nov 8 2018 (cont)
- SUP 4: 120.98 3.0% Lower Bollinger Band
Gilt futures rebounded last week from 121.93, Jan 19 low, a key support and bear trigger. Bearish trend conditions remain intact though and short-term gains are considered corrective. Firm resistance is seen at 123.79, Jan 13 high. A break of this level would signal a short-term base and allow for a stronger corrective bounce towards 124.50, the 50-day EMA. A return lower would refocus attention on 121.93 again.
BTP TECHS: (H2) Holding Below Resistance
- RES 4: 148.02 High Dec 29
- RES 3: 147.55 50-day EMA
- RES 2: 146.80 High Jan 14 and key short-term resistance
- RES 1: 146.49 High Jan 24
- PRICE: 145.87 @ Close Jan 25
- SUP 1: 144.55 Low Jan 19 and the bear trigger
- SUP 2: 144.08 3.00 proj of the Dec 6 - 18 - 14 price swing
- SUP 3: 143.57 3.236 proj of the Dec 6 - 18 - 14 price swing
- SUP 4: 143.26 3.382 proj of the Dec 6 - 18 - 14 price swing
Trend conditions in BTP futures remain bearish. The contract last week cleared support at 145.12, Jan 10 low to confirm a resumption of the primary downtrend and maintain a sequence of lower lows and lower highs. This opens 144.08, a Fibonacci projection. Short-term gains are considered corrective and key resistance has been defined at 146.80, Jan 14 high. A break of this hurdle would highlight a short-term base.
EQUITIES
EUROSTOXX 50 TECHS: (H2) Bearish Threat Still Present
- RES 4: 4392.50 High Nov 18 and key resistance
- RES 3: 4381.50 High Jan 5 and the bull trigger
- RES 2: 4324.50.50 High Jan 13
- RES 1: 4215.50/4223.60 High Jan 24 / 50-day EMA
- PRICE: 4097.00 @ 05:39 GMT Jan 26
- SUP 1: 3990.50 Low Jan 24
- SUP 2: 3980.00 Low Nov 30 2021
- SUP 2: 3935.00 Low Oct 6 2021
- SUP 4: 3895.00 Low Jul 19 2021 (cont)
EUROSTOXX 50 futures remain vulnerable and Monday’s sharp accelerated sell-off reinforced the bearish threat. Former support at 4216.50, Jan 10 low has been cleared and this has resulted in the break of a number of short-term support levels. The move lower has exposed 3980.00, Nov 30 low and 3935.00, Oct 6 low. Both are important supports and a break would threaten a deeper sell-off. Initial resistance is at Monday’s high of 4215.50.
E-MINI S&P (H2): Holding Above Monday’s Low
- RES 4: 4739.50 High Jan 12
- RES 3: 4471.75 High Jan 18
- RES 2: 4609.15 50-day EMA
- RES 1: 4485.75 Low Dec 3
- PRICE: 4359.75 @ 06:44 GMT Jan 26
- SUP 1: 4212.75 Low Jan 24
- SUP 2: 4215.00 Low Jul 19, 2021
- SUP 3: 4186.57 23.6% of the Mar ‘20 - Jan ‘22 major rally
- SUP 4: 4126.75 Low Jun 21, 2021 (cont)
S&P E-minis sold off sharply Monday but recovered from the day low, during a volatile trading session. The contract remains bearish however and further downside pressure is seen likely near-term. Monday’s breach of 4383.85, 76.4% of Oct 2021 - Jan rally and 4252.75, Oct 1 low strengthens the current bearish threat. This opens 4215.00 next, the Jul 19, 2021 low. Initial resistance is seen at 4485.75, the Dec 3 low.
COMMODITIES
BRENT TECHS: (H2) Trend Conditions Remains Bullish
- RES 4: $93.89 - 2.236 proj of the Dec 2 - 9 - 20 price swing
- RES 3: $91.29 - 2.00 proj of the Dec 2 - 9 - 20 price swing
- RES 2: $90.00 - Psychological round number
- RES 1: $89.50 - High Jan 19 and the bull trigger
- PRICE: $88.32 @ 06:51 GMT Jan 26
- SUP 1: $85.04 - Low Jan 24
- SUP 2: $84.08/80.50 - 20-day EMA / Low Jan 10
- SUP 3: $80.61 - 50-day EMA
- SUP 4: $77.04 - Low Jan 3 and key support
Brent futures remain below recent highs but the outlook remains bullish and the recent pullback is considered corrective. Recent gains through key resistance at $83.69, Oct 10 high confirmed a resumption of the broader uptrend and a bullish price sequence of higher highs and higher lows remains intact. The focus is on the $90.00 handle next, a Fibonacci projection. Initial firm support to watch is at $83.97, the 20-day EMA.
WTI TECHS: (H2) Trend Needle Still Points North
- RES 4: $91.58 - 2.382 proj of the Dec 2 - 9 - 20 price swing
- RES 3: $90.00 - Psychological round number
- RES 2: $87.47 - 2.00 proj of the Dec 2 - 9 - 20 price swing
- RES 1: $87.10 - High Jan 20 and the bull trigger
- PRICE: $85.62 @ 07:09 GMT Jan 26
- SUP 1: $81.90 - Low Jan 24
- SUP 2: $80.83/77.34 - 20-day EMA / Low Jan 10
- SUP 3: $77.30/74.01 - 50-day EMA / Low Jan 3
- SUP 4: $72.22 - Low Dec 27
WTI futures remain in an uptrend and short-term pullbacks are considered corrective. The focus is on $87.10, Jan 20 high and the bull trigger. The recent break of key resistance at $80.72, Oct 26 high reinforced a bullish theme - the break higher confirmed a resumption of the broader uptrend. This signals scope for a climb to $87.47 next, a Fibonacci projection. Firm support to watch is at $80.83, the 20-day EMA.
GOLD TECHS: Resumes Its Uptrend
- RES 4: $1903.1 - High Jun 11, 2021
- RES 3: $1877.2 - High Nov 16 and key resistance
- RES 2: $1871.0 - High Nov 18
- RES 1: $1853.9 - High Jan 25
- PRICE: $1847.0 @ 07:12 GMT Jan 26
- SUP 1: $1828.6/1805.9 - Low Jan 25 / Low Jan 18
- SUP 2: $1793.3/82.8 - Channel base from Aug 9 low / Low Jan 7
- SUP 3: $1753.7 - Low Dec 15 and a key support
- SUP 4: $1746.0 - Low Oct 6
Gold short-term conditions remain bullish following last Wednesday’s strong rally. The yellow metal traded higher yesterday to resume its uptrend and has cleared resistance at $1848.00, 76.4% of the Nov 16 - Dec 15 downleg. The break higher reinforces bullish conditions following the recent recovery from the base of its bull channel drawn from the Aug 9, 2021 low. The focus is on $1871.0, Nov 18 low. Support is seen at $1828.6, Jan 21 low.
SILVER TECHS: Corrective Pullback
- RES 4: $26.002 - High Aug 4 2021
- RES 3: $25.406 - High Nov 16
- RES 2: $24.886 - High Nov 22
- RES 1: $24.700 - High Jan 20
- PRICE: $23.726 @ 07:22 GMT Jan 26
- SUP 1: $23.391 - Low Jan 19
- SUP 2: $22.809/21.949 - Low Jan 17 / Low Jan 7
- SUP 3: $21.427/423 - Low Dec 15 / Low Sep 29 and key support
- SUP 4: $20.871 - 50.0% retracement of the Mar ‘20 - Feb ‘21 rally
Silver is off its recent highs but technical conditions remain bullish. The rally last week resulted in a breach of key short-term resistance at $23.436, Dec 28 high, reinforcing bullish conditions following the recent bounce from $21.949, Jan 7 low. The move through $23.436 also highlights a bullish price sequence of higher highs and higher lows. Scope is seen for gains towards $24.886 next, the Nov 22 high. A firm support has been defined at $22.809.
Why MNI
MNI is the leading provider
of intelligence and analysis on the Global Fixed Income, Foreign Exchange and Energy markets. We use an innovative combination of real-time analysis, deep fundamental research and journalism to provide unique and actionable insights for traders and investors. Our "All signal, no noise" approach drives an intelligence service that is succinct and timely, which is highly regarded by our time constrained client base.Our Head Office is in London with offices in Chicago, Washington and Beijing, as well as an on the ground presence in other major financial centres across the world.