
Why MNI
MNI is the leading provider
of intelligence and analysis on the Global Fixed Income, Foreign Exchange and Energy markets. We use an innovative combination of real-time analysis, deep fundamental research and journalism to provide unique and actionable insights for traders and investors. Our "All signal, no noise" approach drives an intelligence service that is succinct and timely, which is highly regarded by our time constrained client base.Our Head Office is in London with offices in Chicago, Washington and Beijing, as well as an on the ground presence in other major financial centres across the world.
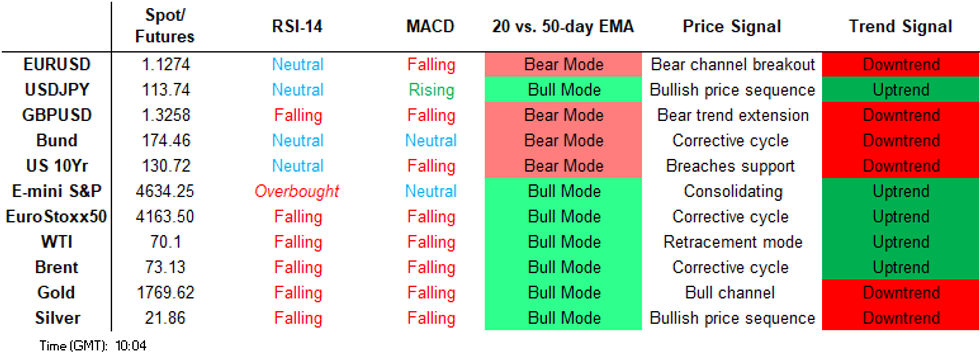
Price Signal Summary - S&P E-Minis Pullback Considered Corrective
- In the equity space, S&P E-minis failed to hold onto Monday’s high and the contract has traded lower since. The outlook remains bullish though and the focus is on the all-time high print of 4735.00 on Nov 22. The 50-day EMA at 4580.29 is the key pivot support. EUROSTOXX 50 futures have traded below support at 4134.50 and an extension would expose 4053.50, the Dec 3 low. Major support and the bear trigger is at 3995.00, Nov 30 low. On the upside, clearance of 4289.00, Dec 8 high is required to signal a resumption of the recent bull theme.
- In FX, EURUSD continues to consolidate and trade below resistance at 1.1383, Nov 30 high. A break of this hurdle is required to signal potential for a stronger short-term recovery. The recent consolidation appears to be a triangle formation. Triangles are continuation patterns and this reinforces the underlying bear trend. Support levels to watch are; 1.1228, the Dec 7 low and 1.1186, Nov 24 low and the bear trigger. GBPUSD trend conditions remain bearish. Scope is seen for weakness towards 1.3135, the Dec 11 2020 low. 1.3313 is resistance, the 20-day EMA. The USDJPY bullish engulfing candle on Dec 6 continues to highlight a potential reversal at 112.53, the Nov 30 low. A break higher would open 114.38, 61.8% of the Nov 24 - 30 downleg and further out, 115.52, the Nov 24 high. Key support is unchanged at 112.53.
- On the commodity front, Gold traded lower yesterday and maintains a weaker tone. The yellow metal is challenging the base of its bull channel drawn from the Aug 9 low. The base intersects at $1768.0. A clear breach of this line and of $1762.0, Dec 2 low would strengthen the bearish theme and open$1746,0 the Oct 6 low. The trend outlook in WTI futures have traded lower this week. A deeper retracement would signal scope for weakness towards support at $65.60, the Dec 3 low.
- In the FI space, Bund futures remain above the 20-day EMA, at 173.70 today. Last week’s high of 175.02 is the bull trigger where a break would confirm a resumption of the uptrend. A move below the 20-day EMA would threaten the trend and signal a reversal. The Gilts trend outlook remains bullish and short-term dips are considered corrective. The focus is on 128.00 next, the Aug 31 high. Initial support to watch lies at 126.67, Dec 10 low.
FOREIGN EXCHANGE
EURUSD TECHS: Triangle Formation Reinforces Bear Theme
- RES 4: 1.1544 Bear channel top from Jun 1 high
- RES 3: 1.1514 Low Nov 5
- RES 2: 1.1432 50-day EMA
- RES 1: 1.1355/83 High Aug 8 / High Nov 30
- PRICE: 1.1269 @ 05:58 GMT Dec 15
- SUP 1: 1.1228 Low Dec 07
- SUP 2: 1.1186/85 Low Nov 24 / Low Jul 1, 2020
- SUP 3: 1.1128 1.764 proj of the Jan 6 - Mar 31 - May 25 price swing
- SUP 4: 1.1040 76.4% retracement of the Mar ‘20 - Jan ‘21 uptrend
EURUSD remains range bound and continues to trade below resistance at 1.1383, Nov 30 high. A break of this level would signal potential for a stronger recovery towards 1.1432, the 50-day EMA. The recent consolidation appears to be a triangle formation. This is a continuation pattern and reinforces the current bear trend. The trigger for a resumption of the downtrend is 1.1186/85. This would open 1.1128, a Fibonacci projection.
GBPUSD TECHS: Trend Conditions Remain Bearish
- RES 4: 1.3698 High Nov 4
- RES 3: 1.3607 High Nov 9
- RES 2: 1.3514 High Nov 18 and a key resistance
- RES 1: 1.3313/70 20-day EMA / High Nov 30
- PRICE: 1.3247 @ 06:07 GMT Dec 15
- SUP 1: 1.3163 Low Dec 08
- SUP 2: 1.3115 1.0% 10-dma envelope
- SUP 3: 1.3135 Low Dec 11 2020
- SUP 4: 1.3057 3.0% Lower Bollinger Band
GBPUSD remains in a downtrend and short-term gains are considered corrective. Last week’s move to a fresh trend low of 1.3163 on Dec 8 confirmed a resumption of the downtrend and maintains the bearish price sequence of lower lows and lower highs. Attention is on the Dec 11 2020 low of 1.3131 ahead of a vol-band support at 1.3115 today. Resistance to watch is at 1.3313, the 20-day EMA. A break would be bullish.
EURGBP TECHS: Watching Support
- RES 4: 0.8670 High Jul 20
- RES 3: 0.8658 High Sep 29 and a key resistance
- RES 2: 0.8624 High Oct 1
- RES 1: 0.8553/8600 High Dec 10 and 14 / High Dec 8
- PRICE: 0.8501 @ 06:11 GMT Dec 15
- SUP 1: 0.8501/8489 Low Dec 13 / Low Dec 7
- SUP 2: 0.8446 Low Nov 29 and a key S/T support
- SUP 3: 0.8411/8381 Low Nov 26 / Low Nov 22 and the bear trigger
- SUP 4: 0.8356 Low Feb 26, 2020
EURGBP remains above Monday’s low of 0.8501. The cross rallied on Dec 8 to a high of 08600. Recent dips are still considered corrective and the outlook is bullish. The rally last week resulted in a test of key short-term resistance at 0.8595, Nov 5 high. A clear break of this level would open 0.8658, Sep 29 high. A key short-term support to watch is located at 0.8489, the Dec 7 low. A break would be bearish.
USDJPY TECHS: Trading In A Tight Range
- RES 4: 116.09 1.764 proj of Apr 23 - Jul 2 - Aug 4 price swing
- RES 3: 115.52 High Nov 24 and the bull trigger
- RES 2: 114.38 61.8% of the Nov 24 - 30 downleg
- RES 1: 113.95/96 High Dec 8 / Nov 29
- PRICE: 113.70 @ 06:19 GMT Dec 15
- SUP 1: 112.53 Low Nov 30 and the bear trigger
- SUP 2: 112.08 High Sep 30 and a recent breakout level
- SUP 3: 111.32 61.8% retracement of the Aug - Nov rally
- SUP 4: 110.82 Low Oct 4
USDJPY is unchanged and trading in a fairly tight range. The bullish engulfing candle on Dec 6 highlights a potential reversal from the recent low of 112.53 on Nov 30. The 20-day EMA as a resistance, at 113.65 today, continues to hold firm for now. A clear break would reinforce the candle pattern and open the November high of 115.52. Sub 112.53 levels would instead reinstate a bearish theme.
EURJPY TECHS: Bearish Threat Remains Present
- RES 4: 131.59 High Nov 5
- RES 3: 129.99 High Nov 19
- RES 2: 129.57 50-day EMA
- RES 1: 128.68/129.11 20-day EMA / High Dec 08
- PRICE: 128.16 @ 06:29 GMT Dec 15
- SUP 1: 127.39 Low Dec 3 / 6 and the bear trigger
- SUP 2: 127.28 1.00 proj of the Jun 1 - Sep 22 - Oct 20 price swing
- SUP 3: 127.04/126.65 Low Feb 15 / Low Feb 10
- SUP 4: 125.82 1.236 proj of the Jun1 - Sep 22 - Oct 20 price swing
EURJPY is unchanged. The cross traded higher on Dec 8, but failed to clear the 20-day EMA. For bulls, a clear breach of this indicator, at 128.68 today, would improve conditions and open the 50-day EMA, at 129.51. Short-term gains are considered corrective though and the downtrend remains intact. A resumption of weakness would refocus attention on 127.39, Dec 3/6 low. A break of this level would resume the trend and open 127.04.
AUDUSD TECHS: 20-Day EMA Remains Intact
- RES 4: 0.7341 61.8% retracement of the Oct 28 - Dec 3 downleg
- RES 3: 0.7293 Former channel base drawn from the Aug 20 low
- RES 2: 0.7252 50-day EMA
- RES 1: 0.7169/87 20-day EMA / High Dec 9
- PRICE: 0.7116 @ 06:34 GMT Dec 15
- SUP 1: 0.7090/7040 Low Dec 14 / Low Dec 7
- SUP 2: 0.6993/91 Low Dec 3 / Low Nov 2 2020 and a key support
- SUP 3: 0.6963 Low Jul 16 2020
- SUP 4: 0.6921 Low Jul 14 2020
AUDUSD has retraced part of last week’s gains. The pair recently tested the 20-day EMA that intersects at 0.7169 today. A clear break of this average would strengthen the current bull cycle and signal scope for an extension towards 0.7296, the base of the bull channel drawn from the Aug 20 low. The channel base was breached on Nov 19. For bears, a deeper pullback would refocus attention on 0.6991, Nov 2 2020 low and the key bear trigger.
USDCAD TECHS: Clears Resistance
- RES 4: 1.3018 2.0% 10-dma envelope
- RES 3: 1.2949 High Aug 20 and a key resistance
- RES 2: 1.2896 High Sep 20
- RES 1: 1.2868 Intraday high
- PRICE: 1.2856 @ 06:54 GMT Dec 15
- SUP 1: 1.2709 20-day EMA
- SUP 2: 1.2608 Low Dec 8 and key support
- SUP 3: 1.2585 Low Nov 19
- SUP 4: 1.2493 Low Nov 16
USDCAD traded higher yesterday and in the process breached resistance at 1.2854, the Dec 3 high. The break confirms a resumption of the uptrend that started on Oct 21 and sets sights on 1.2896, Sep 20 high and 1.2949, the Aug 20 high. A break of the latter resistance would represent an important bullish development. Initial firm support is seen at the 20-day EMA, at 1.2709. The key support is at 1.2608, Dec 8 low.
FIXED INCOME
BUND TECHS: (H2) Holding Above The 20-Day EMA
- RES 4: 176.00 Round number resistance
- RES 3: 175.57 1.618 proj of the Nov 11 - 22 - 24 price swing
- RES 2: 175.29 1.50 proj of the Nov 11 - 22 - 24 price swing
- RES 1: 175.02 High Dec 8 and the bull trigger
- PRICE: 174.43 @ 05:10 GMT Dec 15
- SUP 1: 173.70/40 20-day EMA / Low Dec 8
- SUP 2: 172.70 Low Nov 26
- SUP 3: 171.77 Low Nov 24 and key near-term support
- SUP 4: 170.72 Low Nov 4
The Bund futures contract remains in an uptrend. The recent move lower, appears to be a correction and the contract has remained above the 20-day EMA, at 173.70 today. A break of this average would strengthen a bearish threat and signal scope for a deeper pullback. For bulls, clearance of 175.02, the Dec 8 high, is required to confirm a resumption of the uptrend and would open 175.29, a Fibonacci projection.
BOBL TECHS: (H2) Support Remains Intact
- RES 4: 135.126 1.382 pro of the Nov 11 - 22 - 23 price swing
- RES 3: 134.978 1.236 pro of the Nov 11 - 22 - 23 price swing
- RES 2: 134.740 1.00 pro of the Nov 11 - 22 - 23 price swing
- RES 1: 134.530 High Nov 30 and the bull trigger
- PRICE: 134.110 @ 05:13 GMT Dec 15
- SUP 1: 133.710 Low Dec 8
- SUP 2: 133.610 Low Nov 16
- SUP 3: 133.410 Low Nov 11 and a key support
- SUP 4: 133.200 Low Nov 3
Bobl futures are consolidating and remain above recent lows. The contract traded sharply lower Dec 8 but also managed to recover from that day's low. Price also probed support at 133.730, Nov 23 low. A clear breach of this level would strengthen a bearish case and open 133.410, Nov 11 low. A recovery would instead refocus attention on 134.530, Nov 30 high and the bull trigger. Clearance of this hurdle would resume the recent uptrend.
SCHATZ TECHS: (H2) Consolidating
- RES 4: 112.375 1.382 proj of the Nov 16 - 26 - Dec 1 price swing
- RES 3: 112.350 1.236 proj of the Nov 16 - 26 - Dec 1 price swing
- RES 2: 112.305 High Nov 26 and the bull trigger
- RES 1: 112.235 High Dec 2 / 3
- PRICE: 112.140 @ 05:17 GMT Dec 15
- SUP 1: 112.090 Low Dec 8
- SUP 2: 112.070 1.000 proj of the Nov 26 - Dec 1 - Dec 3 price swing
- SUP 3: 112.031 1.236 proj of the Nov 26 - Dec 1 - Dec 3 price swing
- SUP 4: 112.007 1.382 proj of the Nov 26 - Dec 1 - Dec 3 price swing
Schatz futures are consolidating. The contract faced strong selling pressure on Dec 8 and cleared near term support levels. The break lower strengthened a bearish threat and confirmed an extension of the pullback from 112.305, Nov 26 high. A resumption of weakness would open 112.070 and 112.031, Fibonacci retracements. The recovery since Dec 8 however is encouraging for bulls. A break of 112.235, Dec 2 / 3 high would ease any bearish threat.
GILT TECHS: (H2) Trend Needle Still Points North
- RES 4: 129.00 76.4% retracement of the Aug - Oct downleg (cont)
- RES 3: 128.18 High Sep 10 / 14 (cont)
- RES 2: 127.94/128.00 61.8% of Aug - Oct move (cont) / High Aug 31
- RES 1: 127.67 High Dec 8
- PRICE: 127.36 @ Close Dec 14
- SUP 1: 126.67/32 Low Dec 10 / Low Dec 2
- SUP 2: 125.44 Low Nov 26 and gap high
- SUP 3: 124.94 High Nov 25 and gap low
- SUP 4: 124.48 Low Nov 25
Gilt futures dipped yesterday but still remain in an uptrend. The contract traded higher on Dec 8 and recent gains maintain the bullish price sequence of higher highs and higher lows. Price is approaching the 128.00 objective. Short-term dips would be considered corrective with initial support seen at 126.67, the Dec 10 low. Also watch support at 125.44, the Nov 26 low and a gap high on the daily chart.
BTP TECHS: (H2) Eyeing Resistance
- RES 4: 152.71 1.00 proj of the Nov 1 - 22 - 24 price swing
- RES 3: 151.45 0.764 proj of the Nov 1 - 22 - 24 price swing
- RES 2: 151.00 Round number resistance
- RES 1: 150.66 High Dec 6 and the bull trigger
- PRICE: 149.99 @ Close Dec 15
- SUP 1: 148.51/25 Low Dec 8 / Low Dec 1
- SUP 2: 147.36 Low Nov 24 and key support
- SUP 3: 146.55 76.4% retracement of the Nov 1 - 22 rally
- SUP 4: 145.29 Low Nov 1 and the bear trigger
BTP futures reversed course on Dec 8 and sold off sharply. The move lower did expose support at 148.25, the Dec 1 low where a break would highlight potential for a test of a firmer support at 147.36, Nov 24 low. The contract has however recovered from 148.51, the Dec 8 low and is holding onto these recent gains. A clear break of resistance at 159.64, Nov 22 high (probed last week) would reinstate a bullish theme. This would open the 151.00 handle.
EQUITIES
EUROSTOXX 50 TECHS: (Z1) Trades Through Support
- RES 4: 4461.00 1.50 proj of the Jul 19 - Sep 6 - Oct 6 price swing
- RES 3: 4420.80 1.382 proj of the Jul 19 - Sep 6 - Oct 6 price swing
- RES 2: 4409.50 High Nov 18 and the bull trigger
- RES 1: 4311.70 76.4% retracement of the Nov 18 - 30 downleg
- PRICE: 4159.50 @ 05:49 GMT Dec 15
- SUP 1: 4134.50 Low Dec 14
- SUP 2: 4053.50/3995.00 Low Dec 3 / Low Nov 30
- SUP 2: 3949.50 Low Oct 6 and bear trigger3:
- SUP 4: 3882.00 Low Jul 19
EUROSTOXX 50 futures have remained under pressure since pulling back from the 4289.00 high on Aug 8. Futures have traded below support at 4134.50 and an extension would expose 4053.50, the Dec 3 low. Major support and the bear trigger is at 3995.00, the Nov 30 low. On the upside, clearance of 4289.00 is required to signal a resumption of the recent bull theme and this would expose 4311.70 initially, a Fibonacci retracement.
E-MINI S&P (H2): 50-Day EMA Appears Exposed
- RES 4: 4854.19 0.764 proj of the Oct 1 - Nov 22 - Dec 3 price swing
- RES 1: 4800.00 Round number resistance
- RES 2: 4783.78 0.618 proj of the Oct 1 - Nov 22 - Dec 3 price swing
- RES 1: 4735.00 High Nov 22 and the bull trigger
- PRICE: 4626.50 @ 06:59 GMT Dec 15
- SUP 1: 4582.29 50-day EMA
- SUP 2: 4485.75 Low Dec 3 and the bear trigger
- SUP 3: 4493.88 61.8% retracement of the Oct 1 - Nov 22 rally
- SUP 4: 4436.97 76.4% retracement of the Oct 1 - Nov 22 rally
S&P E-minis started the week on a firmer note but have failed to hold onto Monday’s early gains. Yesterday’s pullback resulted in a move below the 20-day EMA and brings back into view the 50-day EMA, at 4582.29. This average is a pivot level and the recent strong recovery through it has improved conditions for bulls. A clear break below it would be bearish. The key resistance and bull trigger is at 4735.00, the Nov 22 all-time high.
COMMODITIES
BRENT TECHS: (G2) Retracing Recent Gains
- RES 4: $81.88 - High Nov 24
- RES 3: $80.42 - High Nov 26
- RES 2: $76.70/76.92 - High Dec 9 / 50-day EMA
- RES 1: $75.16High Dec 14
- PRICE: $72.80 @ 07:01 GMT Dec 15
- SUP 1: $72.58 - Intraday low
- SUP 2: $69.24/65.72 - Low Dec 3 / Low Dec 2 and the bear trigger
- SUP 3: $62.95 - Low Aug 23 and a key support
- SUP 4: $62.54 - Low May 21
Brent futures have retraced part of the rally between Dec 2 - 9. A deeper retracement would signal scope for a test of support at $69.24, the Dec 3 low. The major support is at the Dec 2 low of $65.72. On the upside, clearance of $76.70, Dec 9 high and $76.79, the 50-day EMA would reinstate a bullish focus and open $80.42, the Nov 26 low. Moving average studies are in a bear mode. This suggests the broader trend direction is down.
WTI TECHS: (F2) Trading Lower
- RES 4: $80.68 - High Nov 16
- RES 3: $78.65 - High Nov 26
- RES 2: $73.34/74.25 - High Dec 9 / 50-day EMA
- RES 1: $72.39 - 20-day EMA
- PRICE: $69.66 @ 07:15 GMT Dec 15
- SUP 1: $69.51 - Low Dec 14
- SUP 2: $65.60 - Low Dec 3
- SUP 3: $62.43 - Low Dec 2 and the bear trigger
- SUP 4: $60.77 - Low Aug 23 and a key support
WTI futures have traded lower this week. A deeper retracement would signal scope for weakness towards support at $65.60, the Dec 3 low. The major support is at the Dec 2 low of $62.43. On the upside, clearance of $73.34, Dec 9 high and $74.25, the 50-day EMA would reinstate a bullish focus and open $78.65, the Nov 26 low. Moving average studies are pointing south. This suggests the broader trend direction is down.
GOLD TECHS: Bull Channel Base Under Pressure
- RES 4: $1903.8 - High Jun 8
- RES 3: $1877.2/93.0 High Nov 16 / Bull channel top
- RES 2: $1815.6/49.1 - High Nov 26 / High Nov 22
- RES 1: $1794.5 High Dec 1
- PRICE: $1768.3 @ 07:19 GMT Dec 15
- SUP 1: $1762.0 - Low Dec 2 and a key near-term support
- SUP 2: $1759.0 - Low Nov 3
- SUP 3: $1746.0 - Oct 6 low
- SUP 4: $1721.7 - Low Sep 29
Gold traded lower yesterday and maintains a weaker tone. The yellow metal is challenging the base of its bull channel drawn from the Aug 9 low. The base intersects at $1768.0. A clear breach of this line and a break of $1762.0, Dec 2 low would strengthen the bearish theme and signal scope for weakness towards $1746,0 the Oct 6 low. Near-term resistance is at $1794.5, the Dec 1 high.
SILVER TECHS: Bear Cycle Extends
- RES 4: $24.323 - High Nov 23
- RES 3: $23.772 - High Nov 24
- RES 2: $23.030 - High Dec 1
- RES 1: $22.420/609 High Dec 13 / High Dec 6
- PRICE: $21.871 @ 09:36 GMT Dec 15
- SUP 1: $21.692/423 - Low Dec 14 / Low Sep 29 and key support
- SUP 2: $20.871 - 50.0% retracement of the Mar ‘20 - Feb ‘21 rally
- SUP 3: $20.000 - Psychological round number
- SUP 4: $19.851 - Low Jul 21 2020
Silver remains vulnerable following yesterday’s sell-off. The continuation lower paves the way for weakness towards $21.423, the Sep 29 low. This level also represents the next key support where a break would strengthen bearish conditions and confirm a resumption of the broader downtrend that started in Feb this year. On the upside, initial firm resistance has been defined at $22.420, Dec 13 high.
Why MNI
MNI is the leading provider
of intelligence and analysis on the Global Fixed Income, Foreign Exchange and Energy markets. We use an innovative combination of real-time analysis, deep fundamental research and journalism to provide unique and actionable insights for traders and investors. Our "All signal, no noise" approach drives an intelligence service that is succinct and timely, which is highly regarded by our time constrained client base.Our Head Office is in London with offices in Chicago, Washington and Beijing, as well as an on the ground presence in other major financial centres across the world.