
MNI DAILY TECHNICAL ANALYSIS - EURUSD Trend Structure Remains Bullish
Price Signal Summary - EURUSD Trend Needle Continues To Point North
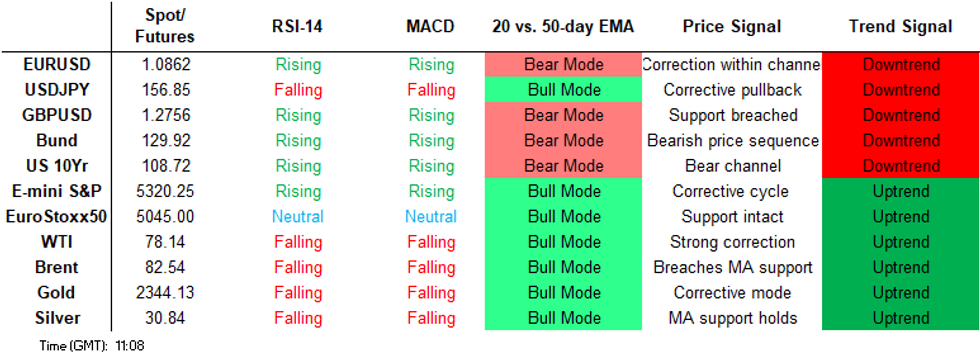
- In the equity space, the uptrend in S&P E-Minis remains intact and the pullback last Thursday appears to be a correction. The contract also traded to a fresh cycle high that day, reinforcing a bullish theme. Recent gains signal scope for a climb towards 5372.73, a 1.764 projection of the Apr 19 - 29 - May 2 price swing. Initial support is 5259.02, the 20-day EMA. A bullish theme in EUROSTOXX 50 futures remains intact and the recent pullback still appears to be a correction. The contract has recently cleared 5079.00, the Apr 2 high, to confirm a resumption of the uptrend. This opens 5127.70 next, the 1.382 projection of the Jan 17 - Feb 12 - 13 price swing. Support at the 20-day EMA has been pierced. The next level to watch is 4955.70, the 50-day EMA.
- In FX, EURUSD remains below its recent high. The recent move lower appears to be a flag formation - a bullish continuation pattern that reinforces the uptrend. A bear channel breakout on May 15 - price cleared the top of a channel drawn from the Dec 28 high - confirmed a stronger reversal. Sights are on 1.0933 next, 61.8% of the Dec 28 - Apr 16 bear leg. Support to watch lies at 1.0791, the 50-day EMA. The GBPUSD trend condition remains bullish and the pair is approaching last week’s high. The recent breach of 1.2634, the May 3 high, confirmed a resumption of the current bull cycle. 1.2754, 76.4% of the Mar 8 - Apr 22 bear leg, was pierced last Wednesday, a clear break would expose 1.2803, the Mar 21 high. Initial firm support to watch is 1.2602, the 50-day EMA. USDJPY is holding on to last week’s gains. The pair has managed to breach resistance at 156.74, the May 14 high and 157.00, 61.8% of the Apr 29 - May 3 sell-off. A continuation higher would open 157.99, the May 1 high. For bears, a reversal lower would refocus attention on 154.03, the 50-day EMA, and 153.09, trendline support drawn from the Dec 28 low. Clearance of these two price points would strengthen a bearish threat.
- On the commodity front, Gold traded down last week. The trend structure remains bullish and the move lower appears to be a correction - for now. Moving average studies are in a bull-mode position and a move down is allowing an overbought condition to unwind. A resumption of gains would open $2452.5 next, the 2.618 projection of the Oct 6 - 27 - Nov 13 price swing. The 50-day EMA, at $2299.9, represents a key support. The 50-day EMA, at $2298.5, represents a key support. A clear break of it would be bearish.
- In the FI space, the bear cycle in Bund that started off the May 16 high of 132.11, remains in play The extension lower has exposed the key support and bear trigger at 129.53, the Apr 25 low. A break of would confirm a resumption of the downtrend that started late December last year and open 129.26, the 1.618 projection of the Mar 8 - 18 - 27 price swing. Initial resistance is at 130.81, the 20-day EMA.
FOREIGN EXCHANGE
EURUSD TECHS: Trend Needle Points North
- RES 4: 1.0981 High Mar 8 and a key resistance
- RES 3: 1.0964 High Mar 13
- RES 2: 1.0933 61.8% retracement of the Dec 28 - Apr 16 bear leg
- RES 1: 1.0895 High May 16
- PRICE: 1.0849 @ 05:58 BST May 27
- SUP 1: 1.0805 20-day EMA
- SUP 2: 1.0791 50-day EMA and a key near-term support
- SUP 3: 1.0724 Low May 3
- SUP 4: 1.0650 Low May 1
EURUSD remains below its recent high. The recent move lower appears to be a flag formation - a bullish continuation pattern that reinforces the uptrend. A bear channel breakout on May 15 - price cleared the top of a channel drawn from the Dec 28 high - confirmed a stronger reversal. Sights are on 1.0933 next, a Fibonacci retracement. Initial firm support to watch lies at 1.0791, the 50-day EMA.
GBPUSD TECHS: Bullish Trend Structure
- RES 4: 1.2894 High Mar 8 and a key resistance
- RES 3: 1.2823 High Mar 14
- RES 2: 1.2803 High Mar 21
- RES 1: 1.2761 High May 22
- PRICE: 1.2754 @ 06:18 BST May 27
- SUP 1: 1.2643/1.2602 Low May 16 / 50-day EMA
- SUP 2: 1.2510 Low May 14
- SUP 3: 1.2446 Low May 9 and a key near-term support
- SUP 4: 1.2423 Low Apr 24
The GBPUSD trend condition remains bullish and the pair is approaching last week’s high. The recent breach of 1.2634, the May 3 high, confirmed a resumption of the current bull cycle. 1.2754, 76.4% of the Mar 8 - Apr 22 bear leg, was pierced last Wednesday, a clear break would expose 1.2803, the Mar 21 high. Note that MA conditions are in a bull-mode set-up, reinforcing the uptrend. Initial firm support to watch is 1.2602, the 50-day EMA.
EURGBP TECHS: Monitoring Key Support
- RES 4: 0.8665 61.8% retracement of the Nov 20 - Feb 14 bear cycle
- RES 3: 0.8656 1.0% 10-dma envelope
- RES 2: 0.8645 High Apr 23 and the bull trigger
- RES 1: 0.8557/8621 20-day EMA / High May 9
- PRICE: 0.8515 @ 06:30 BST May 27
- SUP 1: 0.8500 Key pivot support level
- SUP 2: 0.8498/93 Low Feb 14 / Low Aug 23 2023 and key support
- SUP 3: 0.8454 76.4% of the Mar 7 - Sep 26 ‘23 bull phase
- SUP 4: 0.8408 Low Aug 24 2023
EURGBP is unchanged and remains soft with the cross trading closer to its recent lows. The latest impulsive bear leg has exposed key pivot support at the 0.8500 handle, a level tested numerous times over the past twelve months. An important support zone also lies between 0.8498, the Feb 14 low, and 0.8493, Aug 23 ‘23 low. A clear break of these price points would strengthen a bearish theme. Initial firm resistance is 0.8561, the 20-day EMA.
USDJPY TECHS: Holding On To Its Recent Gains
- RES 4: 160.17 High Apr 29 and the bull trigger
- RES 3: 158.12 76.4% retracement of the Apr 29 - May 3 sell-off
- RES 2: 157.99 High May 1
- RES 1: 157.20 High May 23
- PRICE: 156.74 @ 06:57 BST May 27
- SUP 1: 155.70/154.03 20- and 50-day EMA values
- SUP 2: 153.09 Trendline support drawn from the Dec 28 low
- SUP 3: 151.86 Low May 3
- SUP 4: 150.81 Low Apr 5
USDJPY is holding on to last week’s gains. The pair managed to breach resistance at 156.74, the May 14 high and 157.00, 61.8% of the Apr 29 - May 3 sell-off. A continuation higher would open 157.99, the May 1 high. For bears, a reversal lower would refocus attention on 154.03, the 50-day EMA, and 153.09, trendline support drawn from the Dec 28 low. Clearance of these two price points would strengthen a bearish threat.
EURJPY TECHS: Trend Structure Remains Bullish
- RES 4: 172.71 2.0% 10-dma envelope
- RES 3: 171.56 High Apr 29 and the bull trigger
- RES 2: 170.65 0.618 proj of the May 3 - 15 - 16 price swing
- RES 1: 170.50 High May 24
- PRICE: 170.06 @ 07:16 BST May 27
- SUP 1: 168.22 20-day EMA
- SUP 2: 166.40 Trendline support drawn from the Dec 7 ‘23 low
- SUP 3: 166.21 50-day EMA
- SUP 4: 164.02 Low May 3
EURJPY maintains a firmer short-term tone and is holding on to its recent gains. The medium-term trend structure is bullish and sights are on 171.56, the Apr 29 high and key resistance. Initial support lies at the 20-day EMA, at 168.22, and remains intact. Key trendline support drawn from the Dec 7 ‘23 low, is at 166.40. A clear breach of this line would instead highlight a stronger reversal and initially expose support at the 50-day EMA, at 166.21.
AUDUSD TECHS: Corrective Cycle
- RES 4: 0.6771 High Jan 3
- RES 3: 0.6751 76.4% retracement of the Dec 28 - Apr 19 bear leg
- RES 2: 0.6729 High Jan 12
- RES 1: 0.6714 High May 16 and the bull trigger
- PRICE: 0.6638 @ 07:57 BST May 27
- SUP 1: 0.6592 Low May 24
- SUP 2: 0.6578 50-day EMA
- SUP 3: 0.6465/6407 Low May 1 / Low Apr 22
- SUP 4: 0.6363 Low Apr 19 and the bear trigger
AUDUSD traded lower last week. The move down appears to be a correction and a bullish condition remains intact following recent gains. The pair has recently breached a key short-term hurdle at 0.6668, the Mar 8 high. The break strengthens a bullish theme and a resumption of gains would open 0.6751, a Fibonacci retracement. On the downside, support to watch lies at 0.6578, the 50-day EMA.
USDCAD TECHS: Support Remains Intact For Now
- RES 4: 1.3977 High Oct 13 ‘23 and a key M/T resistance
- RES 3: 1.3899 High Nov 1 and a key resistance
- RES 2: 1.3846/55 High Apr 16 and the bull trigger / High Nov 10 2023
- RES 1: 1.3748/85 61.8% of the Apr 16 - Mar 16 bear leg / High Apr 30
- PRICE: 1.3665 @ 08:05 BST May 27
- SUP 1: 1.3590 Low May 16 and the bear trigger
- SUP 2: 1.3547 Low Apr 9
- SUP 3: 1.3512 50.0% retracement of the Dec 27 - Apr 16 bull cycle
- SUP 4: 1.3478 Low Apr 4
A bullish trend condition in USDCAD remains intact and for now a short-term pullback is considered corrective. Recently, key supports at 1.3643, the 50-day EMA, and 1.3610, the May 3 low, have been pierced. A clear break of both levels is required to threaten the bullish theme and instead signal scope for a deeper retracement. For bulls, a stronger resumption of gains would refocus attention on the bull trigger at 1.3846, the Apr 16 high.
FIXED INCOME
BUND TECHS: (M4) Bear Trigger Remains Exposed
- RES 4: 132.89 38.2% retracement of the Dec 27 - Apr 25 bear cycle
- RES 3: 132.55 High Apr 15
- RES 2: 131.41/132.11 50-day EMA / High May 16 and the bull trigger
- RES 1: 130.81 20-day EMA
- PRICE: 130.14 @ 05:39 BST May 27
- SUP 1: 129.63 Low May 24
- SUP 2: 129.53 Low Apr 25 and a bear trigger
- SUP 3: 129.26 1.618 proj of the Mar 8 - 18 - 27 price swing
- SUP 4: 128.42 Low Nov 1 ‘23 (cont)
The bear cycle in Bund futures that started off the May 16 high of 132.11, remains in play The extension lower has exposed the key support and bear trigger at 129.53, the Apr 25 low. A break of this level would confirm a resumption of the downtrend that started late December last year. This would open 129.26, a Fibonacci projection. For bulls, clearance of 132.11, is required to reinstate a bullish theme and signal a possible reversal.
BOBL TECHS: (M4) Support Has Been Cleared
- RES 4: 117.880 High Apr 15
- RES 2: 117.620 High Apr 19
- RES 3: 117.242/440 High 50-day EMA / High May 16
- RES 1: 116.749 20-day EMA
- PRICE: 116.220 @ 05:51 BST May 27
- SUP 1: 115.950 Low May 24
- SUP 2: 116.710 Low Feb 29 (cont) and a key support
- SUP 3: 115.752 1.764 proj of the Mar 8 - 18 - 27 price swing
- SUP 4: 115.410 2.00 proj of the Mar 8 - 18 - 27 price swing
Bobl futures traded sharply lower last week and in the process cleared key support and the bear trigger at 116.230, the Apr 30 low. This cancels any recent developing bullish theme and instead confirms a resumption of the downtrend, paving the way for a move towards 115.710, the Feb 29 low (cont) and a key support. Initial resistance is seen at 116.749, the 20-day EMA. Key resistance and a reversal trigger is at 117.440, the May 16 high.
SCHATZ TECHS: (M4) Southbound
- RES 4: 105.790 High Mar 25 and key resistance
- RES 3: 105.680 High Apr 12
- RES 2: 105.406 50-day EMA
- RES 1: 105.195/105.395 20-day EMA / High May 3
- PRICE: 104.965 @ 05:47 BST May 27
- SUP 1: 104.880 Low May 24
- SUP 2: 104.800 2.00 proj of the Mar 8 - 18 - 25 price swing
- SUP 3: 104.745 Low Sep 26 2023 (cont) and a key support
- SUP 4: 104.683 2.236 proj of the Mar 8 - 18 - 25 price swing
The trend direction in Schatz futures remains down and this was confirmed last Thursday following a sharp sell-off that resulted in the break of key support and a bear trigger at 105.045, the Apr 30 low. The move down paves the way for an extension towards 104.800, a Fibonacci projection. Moving average studies remain in a bear-mode set-up highlighting a clear downtrend. Initial firm resistance is seen at 105.195, the 20-day EMA.
BTP TECHS: (M4) Testing Support
- RES 4: 120.28 High Mar 14 and the bull rally
- RES 3: 119.55 High Mar 27
- RES 2: 119.10 High Apr 10 and a key near-term resistance
- RES 1: 118.21/119.00 High May 21 / 16
- PRICE: 117.21 @ Close May 24
- SUP 1: 116.93/30 Low May 24 / Low Apr 26
- SUP 2: 115.76 Low Apr 25 and the bear trigger
- SUP 3: 115.70 Low Dec 8 ‘23 (cont)
- SUP 4: 114.74 1.236 proj of the Dec 27 - Feb 22 - Mar 14 price swing
BTP futures rallied on May 15 and traded above 118.61, May 6 high. This exposed a more important resistance at 119.10, the Apr 10 high, that remains intact for now. Clearance of it would strengthen a bullish theme and open the key resistance at 120.28, the Mar 14 high. The contract has pulled back recently and this has exposed support at 116.94, the May 15 low. It was pierced Friday, a clear break of it would be a bearish development.
US 10YR FUTURE TECHS: (M4) Bounces Ahead of Support
- RES 4: 110-16 50.0% retracement of the Feb 1 - Apr 25 bear leg
- RES 3: 110-06 High Apr 4
- RES 2: 110-00 Round number resistance
- RES 1: 109-06/109-31+ 50-day EMA / High May 16 and bull trigger
- PRICE: 108-22+ @ 17:00 BST May 24
- SUP 1: 108-15 Low May 14 and key support
- SUP 2: 108-06 Low May 3
- SUP 3: 107-25 Low May 2
- SUP 4: 107-04 Low Apr 25 and the bear trigger
Treasuries sold off again mid-session, but bounced ahead of support. This kept prices flat into the close and the extended weekend. Support to watch remains 108-15, the May 14 low. Clearance of this level would undermine the recent bullish theme and instead signal scope for a deeper retracement. This would open 108-06, the May 3 low. On the upside, 109-31+ is the bull trigger where a break confirms a resumption of the bull cycle.
EQUITIES
EUROSTOXX50 TECHS: (M4) Pullback Considered Corrective
- RES 4: 5170.50 1.50 proj of the Jan 17 - Feb 12 - 13 price swing
- RES 3: 5162.00 High Nov 2000
- RES 2: 5127.70 1.382 proj of the Jan 17 - Feb 12 - 13 price swing
- RES 1: 5110.00 High May 16 and the bull trigger
- PRICE: 5037.00 @ 06:28 BST May 27
- SUP 1: 4955.70 50- day EMA
- SUP 2: 4862.00 Low Apr 25
- SUP 3: 4762.00 Low Apr 19 and a reversal trigger
- SUP 4: 4711.00 Low Feb 19
A bullish theme in Eurostoxx 50 futures remains intact and the recent pullback still appears to be a correction. The contract has recently cleared key resistance at 5079.00, the Apr 2 high, to confirm a resumption of the uptrend. This opens 5127.70 next, a Fibonacci projection. Key trend support is 4762.00, the Apr 19 low. Support at the 20-day EMA has been pierced. The next level to watch is 4955.70, the 50-day EMA.
E-MINI S&P TECHS: (M4) Bulls Remains In The Driver’s Seat
- RES 4: 5417.75 2.00 proj of the Apr 19 - 29 - May 2 price swing
- RES 3: 5400.00 Round number resistance
- RES 2: 5372.73 1.764 proj of the Apr 19 - 29 - May 2 price swing
- RES 1: 5368.25 High May 23
- PRICE: 5321.00 @ 07:24 BST May 27
- SUP 1: 5259.02 20-day EMA
- SUP 2: 5200.14 50-day EMA
- SUP 3: 5099.25 Low May 3
- SUP 4: 5036.25 Low May 2
The uptrend in S&P E-Minis remains intact and the pullback last Thursday appears to be a correction. The contract also traded to a fresh cycle high that day, reinforcing a bullish theme. Recent gains also resulted in a break of 5333.50, Apr 1 high. This confirmed a resumption of the primary uptrend and has opened 5372.73, a Fibonacci projection. Moving average studies are in a bull-mode set-up. Initial support is 5259.02, the 20-day EMA.
COMMODITIES
BRENT TECHS: (N4) Bears Remain In The Driver's Seat
- RES 4: $94.00 - 2.236 proj of the Jan 3 - 29 - Feb 5 price swing
- RES 3: $92.09 - 2.00 proj of the Jan 8 - 29 - Feb 5 price swing
- RES 2: $91.18 - High Apr 12 and the bull trigger
- RES 1: $84.12/88.64 - 50-day EMA / High Apr 26
- PRICE: $82.32 @ 07:10 BST May 27
- SUP 1: $80.65 - Low May 24
- SUP 2: $80.24 - 61.8% retracement of the Dec 13 - Apr 12 bull cycle
- SUP 3: $75.91 - Low Feb 5
- SUP 4: $73.47 - Low Dec 13 and a key support
Brent futures traded lower this week. The trend condition is unchanged and remains bearish. Price has recently cleared the 50-day EMA and the clear breach of this average signals scope for a deeper correction towards $80.24, a Fibonacci retracement. Key resistance and the bull trigger has been defined at $91.18, the Apr 12 high. Clearance of this level would resume the uptrend. Initial firm resistance is $88.64, Apr 26 high
GOLD TECHS: Watching Support At The 50-Day EMA
- RES 4: $2528.4 - 3.00 proj of the Oct 6 - 27 - Nov 13 price swing
- RES 3: $2500.0 - Round number resistance
- RES 2: $2481.5 - 2.764 proj of the Oct 6 - 27 - Nov 13 price swing
- RES 1: $2452.5 - 2.618 proj of the Oct 6 - 27 - Nov 13 price swing
- PRICE: $2343.6 @ 07:26 BST May 27
- SUP 1: $2299.9 - 50- day EMA
- SUP 2: $2277.4 - Low May 3 and a pivot support
- SUP 3: $2187.4 - Low Mar 28
- SUP 4: $2146.2 - Low Mar 18 and key short-term support
Gold traded down last week. The trend structure remains bullish and the move lower appears to be a correction - for now. Moving average studies are in a bull-mode position and the move lower is allowing an overbought condition to unwind. A resumption of gains would open $2452.5 next, a Fibonacci projection. The 50-day EMA, at $2299.9, represents a key support. A clear break of it would be bearish.
SILVER TECHS: Unwinding An Overbought Condition
- RES 4: $35.745 - 1.236 proj of Jan 22 - Apr 12 - Nov 13 price swing
- RES 3: $35.226 - 50.0% of the Apr 2011 - Mar 2020 bear leg
- RES 2: $33.887 - 1.00 proj of the Jan 22 - Apr 12 - Nov 13 price swing
- RES 1: $32.518 - High May 20
- PRICE: $30.780 @ 08:09 BST May 27
- SUP 1: $29.797 - High Apr 12 and a recent breakout level
- SUP 2: $29.280 - 20-day EMA
- SUP 3: $27.675/26.018 - 50-day EMA / Low May 2
- SUP 4: $24.328 - Low Mar 27
Silver maintains a bullish theme and the latest pullback appears to be a correction. The move down is allowing an overbought condition to unwind. Recent gains resulted in a break of resistance at $29.797, the Apr 12 high. The breach confirmed a resumption of the uptrend and has opened $33.887 next, a Fibonacci projection. A key support zone to watch lies between $29.280-27.675, the 20- and 50-day EMA values.