
Why MNI
MNI is the leading provider
of intelligence and analysis on the Global Fixed Income, Foreign Exchange and Energy markets. We use an innovative combination of real-time analysis, deep fundamental research and journalism to provide unique and actionable insights for traders and investors. Our "All signal, no noise" approach drives an intelligence service that is succinct and timely, which is highly regarded by our time constrained client base.Our Head Office is in London with offices in Chicago, Washington and Beijing, as well as an on the ground presence in other major financial centres across the world.
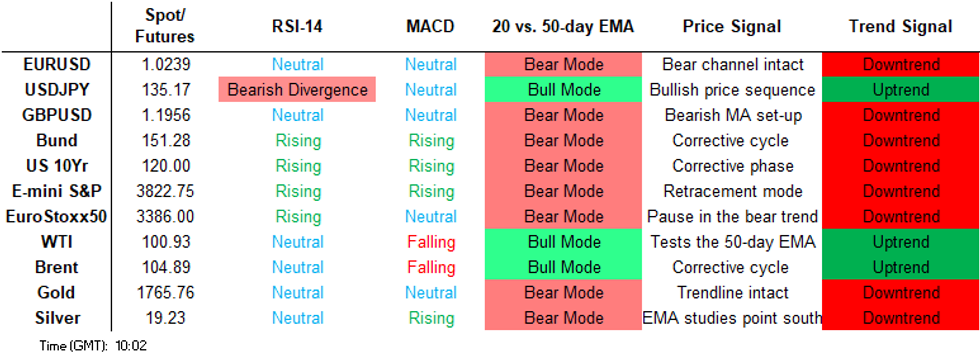
Price Signal Summary - Oil Futures Bear Cycle Remains Intact
- In the equity space, S&P E-Minis remain vulnerable following last week’s move lower and reversal from 3950.00, the Jun 28 high. A resumption of weakness would open 3735.00, the Jun 23 low. A breach of this level would expose key support at 3639.00, the Jun 17 low and bear trigger. Clearance of 3950.00 is required to strengthen a bullish case. EUROSTOXX 50 futures traded sharply lower Tuesday and cleared support at 3384.00, the Jun 16 low. The break strengthens bearish conditions and confirms a resumption of the broader downtrend. This has opened 3321.30, 50.0% of the major 2020 - 2021 upleg. On the upside, key short-term resistance has been defined at 3584.00, the Jun 27 high.
- In FX, the EURUSD yesterday breached support at 1.0359, Jun 15 low, and 1.0350, the May 13 low. The break confirms a resumption of the primary downtrend and an extension lower within the bear channel drawn from the Feb 10 high. This has opened 1.0233, the 1.382 projection of Feb 10 - Mar 7 - 31 price swing. GBPUSD remains vulnerable. The pair traded sharply lower Tuesday, touching the lowest levels in 20 years. The extension lower highlights a continuation of the downtrend and opens 1.1795, 0.764 proj of the Mar 23 - May 13 - 27 price swing. The USDJPY path of least resistance remains up. Last week’s gains confirmed a resumption of the primary uptrend. Initial support is at 134.27, the Jun 23 low. A resumption of gains would open 137.30 next, 1.50 projection of the Feb 24 - Mar 28 - 31 price swing.
- On the commodity front, Gold traded sharply lower Tuesday and confirmed a breach of key short-term support and the bear trigger at $1787.00, May 16 low. The break confirms a resumption of the broader downtrend and opens $1753.7, the Dec 15 2021 low. In the Oil space, WTI futures faced strong selling pressure Tuesday and this resulted in a break of support at $101.53, the Jun 22 low. This signals potential for weakness towards $95.47, May 11 low.
- In the FI space, Bund futures resumed their short-term uptrend last week and a bull cycle remains intact. The focus is on 152.28, 76.4% retracement of the May 12 - Jun 16 bear leg. Gilts cleared resistance on Friday at 114.55, Jun 24 high The break highlights potential for a stronger short-term recovery and this has opened 117.48, 1.236 projection of the Jun 16 - 24 - 29 price swing.
FOREIGN EXCHANGE
EURUSD TECHS: Heading South
- RES 4: 1.0787 High May 30 and a reversal trigger
- RES 3: 1.0774 High Jun 9
- RES 2: 1.0615 High Jun 27 and a key resistance
- RES 1: 1.0359/0497 Low Jun 15 / 20-day EMA
- PRICE: 1.0250 @ 06:21 BST Jul 6
- SUP 1: 1.0233 1.382 proj of Feb 10 - Mar 7 - 31 price swing
- SUP 2: 1.0200 1.00 projection of the Jun 9 - 15 - 27 price swing
- SUP 3: 1.0102 1.236 projection of the Jun 9 - 15 - 27 price swing
- SUP 4: 1.0035 Bear channel base drawn from the Feb 10 high
EURUSD traded sharply lower into the Tuesday close, touching the lowest levels in 20 years. This resulted in a breach of support at 1.0359, Jun 15 low, and 1.0350, the May 13 low, to confirm a resumption of the primary downtrend. The extension lower highlights a continuation of the downtrend inside the bear channel drawn from the Feb 10 high. This signals scope for 1.0233, a Fibonacci projection. Resistance is seen at 1.0522, 20-day EMA.
GBPUSD TECHS: Resumes Its Downtrend
- RES 4: 1.2495 76.4% retracement of the May 27 - Jun 14 downleg
- RES 3: 1.2406 High Jun 16 and a key resistance
- RES 2: 1.2332 High Jun 27
- RES 1: 1.2125/2256 High Jul 5 / 20-day EMA
- PRICE: 1.1932 @ 06:47 BST Jul 6
- SUP 1: 1.1899 Low Jul 5
- SUP 2: 1.1795 0.764 proj of the Mar 23 - May 13 - 27 price swing
- SUP 3: 1.1777 Low Mar 26 2020
- SUP 4: 1.1673 1.00 proj of the May 27 - Jun 14 - 16 price swing
The downtrend in GBPUSD accelerated Tuesday. This resulted in a break of support and the bear trigger at the Jun 14 low of 1.1934. The move through level reinforces bearish conditions and confirms a resumption of the downtrend. The focus is 1.1795, a Fibonacci projection. Weakness through here would open the Mar 26 2020 lows of 1.1777. First resistance is at 1.2226, the 20-day EMA.
EURGBP TECHS: Remains Above The 50-Day EMA
- RES 4: 0.8852 50.0% retracement of the Mar ‘20 - Mar ‘22 bear leg
- RES 3: 0.8762 1.00 proj of the Apr 14 - May 12 - 17 price swing
- RES 2: 0.8721 High May 26 2021 and Jun 15 / bull trigger
- RES 1: 0.8627/79 High Jul 4 / High Jul 1
- PRICE: 0.8591 @ 06:55 BST Jul 6
- SUP 1: 0.8543 Low Jul 5
- SUP 2: 0.8536 50-day EMA
- SUP 3: 0.8486 Low Jun 9
- SUP 4: 0.8433 Low May 23
EURGBP continues to trade in a choppy manner. Trend conditions though are bullish and price remains above important support levels. Note too that moving average studies are in a bull mode condition, highlighting an uptrend. Sights are on 0.8721, the Jun 15 high and bull trigger. A break of 0.8721 would resume the bull trend. Firm support is at the 50-day EMA - it intersects at 0.8536.
USDJPY TECHS: Consolidation Mode
- RES 4: 140.00 Round number resistance
- RES 3: 138.56 1.618 proj of the Feb 24 - Mar 28 - 31 price swing
- RES 2: 137.30 1.50 proj of the Feb 24 - Mar 28 - 31 price swing
- RES 1: 137.00 High Jun 29 and the bull trigger
- PRICE: 135.16 @ 06:58 BST Jul 6
- SUP 1: 134.27 Low Jun 23
- SUP 2: 132.17/132.29 Low Jun 17 / Bull channel base from Mar 4 low
- SUP 3: 131.50 Low Jun 16 and a key support
- SUP 4: 130.00 Round number support
USDJPY is consolidating and remains inside its recent range. Trend conditions are unchanged and the uptrend remains firmly intact. A fresh cycle high last week confirmed a resumption of the primary uptrend and this maintains the sequence of higher highs and higher lows. The focus is on 137.30, a Fibonacci projection. Initial firm support to watch is 134.27, the Jun 23 low. A break would signal scope for a deeper corrective pullback.
EURJPY TECHS: Approaching Key Support
- RES 4: 144.28 High Jun 28 and key resistance
- RES 3: 142.37 High Jul 5
- RES 2: 141.30 20-day EMA
- RES 1: 139.50 Intraday high
- PRICE: 138.40 @ 07:10 BST Jul 6
- SUP 1: 137.85 Low Jun 16 and key support
- SUP 2: 137.10 61.8% retracement of the May 12 - Jun 28 climb
- SUP 3: 136.25 Low May 30
- SUP 4: 135.40 76.4% retracement of the May 12 - Jun 28 climb
EURJPY maintains a short-term bearish tone. The cross continues to pull away from 144.28, the Jun 28 high. This has resulted in a move below both the 20- and 50-day EMAs and signals scope for an extension lower. The focus is on 137.85, the Jun 16 low and a key short-term support. A break would further strengthen bearish conditions. On the upside, initial firm resistance is seen at 142.37, the July 5 high.
AUDUSD TECHS: Trend Needle Points South
- RES 4: 0.7202 High Jun 9
- RES 3: 0.7138 High Jun 10
- RES 2: 0.7069 High Jun 16 and a key short-term resistance
- RES 1: 0.6939/6964 20-day EMA / High Jun 28
- PRICE: 0.6790 @ 07:18 BST Jul 6
- SUP 1: 0.6762 Low Jul 5
- SUP 2: 0.6759, 50.0% retracement of the Mar ‘20 - Feb ‘ 21 bull cycle
- SUP 3: 0.6685 High Mar 9 2020
- SUP 4: 0.6647 0.764 proj of the Apr 5 - May 12 - Jun 3 price swing
AUDUSD remains vulnerable following the recent breach of support at 0.6829, the May 12 low. The break strengthens bearish conditions and confirms a resumption of the downtrend that started February 2021. The move lower also maintains a broader bearish price sequence of lower lows and lower highs. Sights are on 0.6759 next, a Fibonacci retracement. Initial firm resistance is seen at 0.6964, high Jun 28.
USDCAD TECHS: Challenges Key Short-Term Resistance
- RES 4: 1.3300 High Nov 4 2020
- RES 3: 1.3192 1.00 proj of the Apr 5 - May 12 - Jun 8 price swing
- RES 2: 1.3113 High Nov 23 2020
- RES 1: 1.3084 High Jul 5
- PRICE: 1.3036 @ 08:10 BST Jul 6
- SUP 1: 1.2966 High Jul 1
- SUP 2: 1.2883 20-day EMA
- SUP 3: 1.2822/19 50-day EMA / Low Jun 28 and key support
- SUP 4: 1.2763 Low Jun 13
USDCAD rallied sharply higher Tuesday. The rally reinforces short-term bullish conditions and means key support around the 50-day EMA remains intact. The average intersects at 1.2821. Yesterday's gains also resulted in a print above resistance at 1.3079, the May 17 high and a bull trigger. A clear break would strengthen bullish conditions and open 1.3113, the Nov 23 2020 high. A break of support at 1.2819, Jun 28 low would alter the picture.
FIXED INCOME
BUND TECHS: (U2) Bull Cycle Intact
- RES 4: 154.65 High May 27
- RES 3: 153.36 High May 31
- RES 2: 152.28 76.4% retracement of the May 12 - Jun 16 bear leg
- RES 1: 151.65 High Jul 1 and the bull trigger
- PRICE: 150.85 @ 05:00 BST Jul 6
- SUP 1: 148.11/146.50 20-day EMA / Low Jun 30
- SUP 2: 144.72 Low Jun 28 and a key support
- SUP 3: 142.56 Low Jun 17
- SUP 4: 140.67 Low Jun 16 and bear trigger
Bund futures traded higher yesterday and the contract maintains a short-term bullish tone. This follows the break of resistance at 149.00 that has established a bullish price sequence of higher highs and higher lows on the daily chart. The contract has also cleared the 50-day EMA. 151.65, the Jul 1 high, is the bull trigger. On the downside, key short-term support has been defined at 144.72, the Jun 28 low.
BOBL TECHS: (U2) Trend Needle Still Points North
- RES 4: 126.710 High May 26
- RES 3: 126.410 High May 27
- RES 2: 126.090 High May 30
- RES 1: 125.830 Intraday high
- PRICE: 125.740 @ 09:25 BST Jul 6
- SUP 1: 123.616 20-day EMA
- SUP 2: 123.010 Low Jun 30
- SUP 3: 121.910 Low Jun 28
- SUP 4: 120.990 Low Jun 21
A bull cycle in Bobl futures remains intact. The recent breach of resistance at 123.960, the Jun 24 high, confirmed a resumption of the current bullish corrective cycle and price has established a positive price sequence of higher highs and higher lows. Scope is seen for a climb towards 126.090, the May 30 high. Key short-term support has been defined at 121.190, Jun 28 low. A break would highlight a reversal.
SCHATZ TECHS: (U2) Bullish Outlook
- RES 4: 110.063 1.236 proj of the May 16 - 24 - 28 price swing
- RES 3: 110.00 Round number resistance
- RES 2: 109.850 High May 26 and a key resistance
- RES 1: 109.750 Intraday high
- PRICE: 109.745 @ 09:26 BST Jul 6
- SUP 1: 108.924 20-day EMA
- SUP 2: 108.425 Low Jun 28
- SUP 3: 108.025 Low Jun 21
- SUP 4: 107.705 Low Jun 16 and the bear trigger
Bullish short-term conditions in Schatz futures remain intact. The contract has cleared resistance at 109.030, the Jun 24 high. This marks an extension of a corrective cycle and price has established a bullish sequence of higher highs and higher lows. Scope is seen for a climb towards 109.850, the May 26 high. On the downside, key short-term support has been defined at 108.425, the Jun 28 low.
GILT TECHS: (U2) Northbound
- RES 4: 118.63 High May 24
- RES 3: 118.16 1.382 proj of the Jun 16 - 24- 29 price swing
- RES 2: 117.48 1.236 proj of the Jun 16 - 24- 29 price swing
- RES 1: 116.58 High Jul 1
- PRICE: 116.08 @ Close Jul 5
- SUP 1: 114.10/113.03 20-day EMA / Low Jun 30
- SUP 2: 111.72 Low Jun 29 and key near-term support
- SUP 3: 110.57 Low Jun 21
- SUP 4: 109.89 Low Jun 16 and the bear trigger
Gilt futures gains last week confirmed a resumption of the bull cycle that started Jun 16 - price cleared resistance at 114.55, Jun 24 high. Friday’s rally also signals an acceleration of the current uptrend and the contract has crossed the 116.00 handle. A clear break of this level would open 117.48, a Fibonacci projection. On the downside, key short-term support has been defined at 111.72, the Jun 29 low.
BTP TECHS: (U2) Bullish Theme
- RES 4: 130.00 Round number resistance
- RES 3: 129.00 High May 12
- RES 2: 127.79 High May 26
- RES 1: 126.41 High Jul 1 and the bull trigger
- PRICE: 124.63 @ Close Jul 5
- SUP 1: 122.18/119.81 20-day EMA / Low Jun 28 and key S/T support
- SUP 2: 118.60 Low Jun 22
- SUP 3: 115.72 Low Jun 16
- SUP 4: 113.78 Low Jun 14 and the bear trigger
BTP futures are unchanged and maintain a bullish short-term tone and last week’s gains reinforce this theme - price breached resistance at 122.80, the Jun 24 high. The break suggests potential for a stronger short-term correction and attention is on 127.79 the May 26 high. Initial support to watch is at 119.81, the Jun 28 low. A break of this level would instead signal a potential short-term top and the end of the current corrective cycle.
EQUITIES
EUROSTOXX50 TECHS: (U2) Bear Trigger Cleared
- RES 4: 3774.00 High Jun 9
- RES 3: 3689.00 High Jun 10
- RES 2: 3594.20 50-day EMA
- RES 1: 3503.10/3584.00 20-day EMA / High Jun 27
- PRICE: 3405.00 @ 05:30 BST Jul 7
- SUP 1: 3343.00 Low Jul 6
- SUP 2: 3321.30 50.0% retracement the major 2020 - 2021 upleg
- SUP 3: 3300.00 Round number support
- SUP 4: 3241.70 1.382 proj of the Mar 29 - May 10 - Jun 6 price swing
EUROSTOXX 50 futures traded sharply lower Tuesday and in the process cleared support and the bear trigger at 3384.00, the Jun 16 low. The break strengthens bearish conditions and confirms a resumption of the broader downtrend. This has opened 3321.30, 50.0% of the major 2020 - 2021 upleg. On the upside, key short-term resistance has been defined at 3584.00, the Jun 27 high.
E-MINI S&P (U2): Bearish Threat Remains Present
- RES 4: 4308.50 High Apr 28
- RES 3: 4204.75 High May 31 and a key resistance
- RES 2: 3997.82 50-day EMA
- RES 1: 3950.00 High Jun 27
- PRICE: 3815.25 @ 07:03 BST Jul 6
- SUP 1: 3735.00/3639.00 Low Jun 23 / 17 and the bear trigger
- SUP 2: 3578.27 0.618 proj of the Mar 29 - May 20 - 31 price swing
- SUP 3: 3500.00 Round number support
- SUP 4: 3384.75 0.764 proj of the Mar 29 - May 20 - 31 price swing
S&P E-Minis maintain a softer tone following last week’s bearish cycle and reversal from 3950.00, the Jun 28 high . The next support lies at 3735.00, the Jun 23 low. A breach of this level would expose key support at 3639.00, the Jun 17 low. On the upside, clearance of resistance at 3950.00 is required to reinstate a bullish theme. This would open the 50-day EMA, currently at 3997.82.
COMMODITIES
BRENT TECHS: (U2) Bearish Price Activity
- RES 4: $121.68 - High Jun 9 and the bull trigger
- RES 3: $118.12 - High Jun 17
- RES 2: $116.24 - High Jun 29
- RES 1: $109.63/114.75 - 50-day EMA / High Jul 5
- PRICE: $103.84 @ 05:49 BST Jul 6
- SUP 1: $101.10 - Low Jul 5
- SUP 2: $100.00 - Psychological round number
- SUP 3: $98.72 - Low May 11
- SUP 4: $97.25 - Low Apr 25
Brent futures faced strong selling pressure Tuesday. The move lower confirmed a break of support at $104.35, the Jun 22 low and a short-term bear trigger. This has strengthened current bearish conditions and has established a bearish price sequence of lower lows and lower highs on the daily chart. The focus is on the $100.00 handle and $98.72, the May 11 low. Key short-term resistance has been defined at $116.24, the Jun 29 high.
WTI TECHS: (Q2) Remains Vulnerable
- RES 4: $120.88 - High Jun 14 and key resistance
- RES 3: $116.58 - High Jun 17
- RES 2: $114.05 - High Jun 29 and a key near-term resistance
- RES 1: $107.22 - 50-day EMA / High Jul 5
- PRICE: $100.51 @ 06:00 BST Jul 6
- SUP 1: $97.43 - Low Jul 6
- SUP 2: $95.47 - Low May 11
- SUP 3: $93.45 - Low Apr 25
- SUP 4: $90.13 - 1.236 proj of the Jun 14 - 22 - 29 price swing
A sharp sell-off in WTI futures Tuesday reinforces current bearish conditions and signals scope for an extension lower. The sell-off resulted in a break of support at $101.53, the Jun 22 low and a short-term bear trigger. This signals scope for weakness towards $95.47, the May 11 low and beyond. On the upside, key short-term resistance has been defined at $114.05, the Jun 29 high.
GOLD TECHS: Clears Key Support
- RES 4: $1878.4 - High Jun 13
- RES 3: $1855.7 - Trendline resistance drawn from the Mar 8 high
- RES 2: $1822.4/45.8 - 20-day EMA / 50-day EMA
- RES 1: $ 1784.6 - Low Jul 1
- PRICE: $1765.3@ 09:44 BST Jul 6
- SUP 1: $1763.2 - Intraday low
- SUP 2: $1753.7 - Low Dec 15 2021
- SUP 3: $1721.7 - Low Sep 29 2021
- SUP 4: $1706.3 - 1.618 proj of the Mar 8 - 29 - Apr 18 price swing
Gold traded sharply lower Tuesday and in the process confirmed a breach of key short-term support and the bear trigger at $1787.00, the May 16 low. The break lower confirms a resumption of the broader downtrend and sets the scene for weakness towards $1753.7, the Dec 15 2021 low. Moving average studies remain in bear mode, reinforcing the current trend direction. Key trendline resistance, drawn from the Mar 8 high, intersects at $1856.7.
SILVER TECHS: Bear Trend Resumes
- RES 4: $21.967 - High Jun 17
- RES 3: $21.779 - 50-day EMA
- RES 2: $20.909 - 20-day EMA
- RES 1: $20.464 - Low May 13 and recent breakout level
- PRICE: $19.224 @ 08:19 BST Jul 6
- SUP 1: $18.928 - Intraday low
- SUP 2: $18.693 - 61.8% retracement of Mar ‘20 - Feb ‘21 bull cycle
- SUP 3: $18.447 - 2.618 proj of the Mar 8 - 29 - Apr 18 price swing
- SUP 4: $18.250 - Low Jul 8 2020
The Silver outlook remains bearish and the metal resumed its bear leg yesterday. This marks an extension of the current bear leg that started Jun 6 and marks an extension of the downtrend that has been in place since early February 2021. The metal has also cleared the $20.00 handle and sights are on $18.693 next, a Fibonacci retracement. The 20-day EMA, at $20.909 marks a key short-term resistance.
Why MNI
MNI is the leading provider
of intelligence and analysis on the Global Fixed Income, Foreign Exchange and Energy markets. We use an innovative combination of real-time analysis, deep fundamental research and journalism to provide unique and actionable insights for traders and investors. Our "All signal, no noise" approach drives an intelligence service that is succinct and timely, which is highly regarded by our time constrained client base.Our Head Office is in London with offices in Chicago, Washington and Beijing, as well as an on the ground presence in other major financial centres across the world.