
MNI DAILY TECHNICAL ANALYSIS - S&P E-Minis Trend Needle Points North
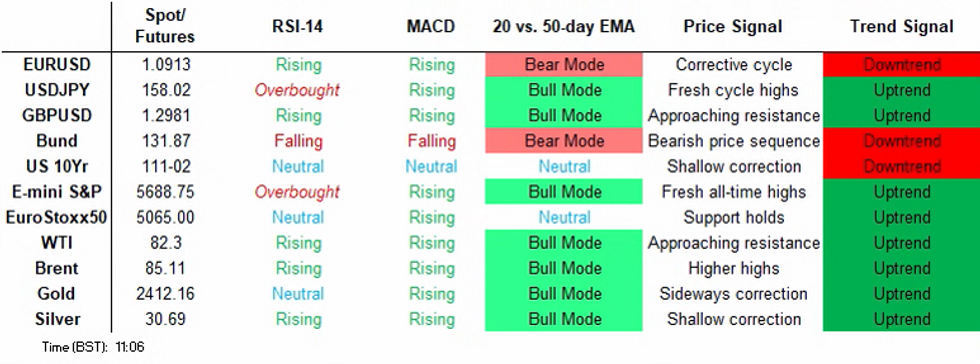
Price Signal Summary - Bull Cycle In S&P E-Minis Remains In Play
- In the equity space, the trend condition in S&P E-Minis The trend condition in S&P E-Minis is bullish and the contract traded to a fresh trend high once again last week. The continuation higher confirms a resumption of the uptrend and maintains the bullish sequence of higher highs and higher lows. Sights are on the 5713.31, a 3.236 projection of the Apr 19 - 29 - May 2 price swing. Firm support is at 5569.65, the 20-day EMA. A bull cycle in EUROSTOXX 50 futures remains intact and Friday’s gains reinforce the current condition. 5039.84, 61.8% of the May 16 - Jun 14 sell-off, has been cleared. This has resulted in a print above 5082.32, the 76.4% retracement. A clear break of it would be a positive development and open 5132.00, Jun 6 high. Initial support is 4997.26, the 50-day EMA.
- In FX, EURUSD traded higher last week and a bullish theme remains intact. The move higher confirmed a resumption of the current short-term bull cycle that started Jun 26. Note too that resistance at 1.0852 has been cleared, the clear break signals scope for an extension towards 1.0916, the Jun 4 high and the next key hurdle for bulls. Clearance of this level would open 1.0943, the Jan 21 high. Initial support to watch is unchanged at 1.0798, the 20-day EMA. GBPUSD remains in a bull-mode condition and last week’s strong impulsive rally reinforces current conditions. The move higher resulted in a break of 1.2860, the Jun 12 high and a bull trigger. This was followed by a breach of 1.2894, the Mar 8 high and a key medium-term resistance, strengthening a bullish condition. The break opens 1.2996, the Jul 27 ‘23 high. Initial firm support is 1.2794, the 20-day EMA. USDJPY traded sharply lower Thursday, and the pair remains soft. Price breached the 20-day EMA and exposed the next important support at 158.37, the trendline drawn from the Dec 28 low last year. The line has been pierced, a clear break of it would highlight a potential reversal. This would open 156.83, 38.2% retracement of the Dec 28 ‘23 - Jul 3 bull run. Initial resistance is at 159.75, the 20-day EMA.
- On the commodity front, Gold remains constructive for bulls and last Thursday's rally reinforces short-term bullish conditions. Recent gains resulted in a breach of $2387.8, the Jun 7 high. This undermines a recent bearish theme and a clear break represents a bullish development that opens the key resistance at $2450.1, the May 20 high. Initial support to watch lies at the 50-day EMA, at 2335.9. In the oil space, WTI futures remain above last week’s low. The recent bear leg appears to have been a correction. Recent cycle highs reinforced bullish conditions, signalling scope for a continuation of the bull cycle near-term. Moving average studies are in a bull-mode set-up too, highlighting a rising trend. Sights are on $85.27, the Apr 12 high and a bull trigger. Initial firm support to watch is $80.00, the 50-day EMA.
- In the FI space, the trend condition in Bund futures remains bearish and short-term gains appear to be corrective. However, the contract last week traded through resistance at the 50-day EMA, at 131.57. This does signal scope for an extension and has exposed 132.51, 76.4% retracement of the Jun 14 - Jul 3 bear leg. Clearance of this level would expose 132.21, the Jun 14 high. For bears, a resumption of weakness would refocus attention on key support at 130.23, the Jul 3 low. Gilt futures traded higher last Thursday and the contract is holding on to the bulk of its recent gains. Resistance at 98.24, the Jun 28 high, has been cleared. A continuation would expose key short-term resistance at 99.23, the Jun 21 high. On the downside, initial support to watch lies at 97.63, last Thursday’s low. A break would highlight a reversal and this would refocus attention on 96.57, the Jul 1 low and a key short-term support.
FOREIGN EXCHANGE
EURUSD TECHS: Approaching Key Resistance
- RES 4: 1.0981 High Mar 3
- RES 3: 1.0943 High Jan 21
- RES 2: 1.0916 High Jun 04 and the bull trigger
- RES 1: 1.0911 High Jul 12
- PRICE: 1.0893 @ 05:50 BST Jul 15
- SUP 1: 1.0789/10 20-day EMA / Low Jul 2
- SUP 2: 1.0666 Low Jun 26 and the bear trigger
- SUP 3: 1.0650 Low May 1
- SUP 4: 1.0601 Low Apr 16 and a key support
EURUSD traded higher last week and a bullish theme remains intact. The move higher confirmed a resumption of the current short-term bull cycle that started Jun 26. Note too that resistance at 1.0852 has been cleared, the clear break signals scope for an extension towards 1.0916, the Jun 4 high and the next key hurdle for bulls. Initial support to watch is unchanged at 1.0798, the 20-day EMA.
GBPUSD TECHS: Impulsive Bull Rally
- RES 4: 1.3142 High Jul 14 ‘23 and a key resistance
- RES 3: 1.3035 1.764 proj of the Apr 22 - May 3 - 9 price swing
- RES 2: 1.2996 High Jul 27 2023
- RES 1: 1.2991 High Jul 12
- PRICE: 1.2976 @ 06:02 BST Jul 15
- SUP 1: 1.2848 Low Jul 11
- SUP 2: 1.2775/2716 20- and 50-day EMA
- SUP 3: 1.2613 Low Jun 27
- SUP 4: 1.2584 Low May 15
GBPUSD remains in a bull-mode condition and last week’s strong impulsive rally reinforces current conditions. The move higher resulted in a break of key short-term resistance at 1.2860, the Jun 12 high and a bull trigger. This was followed by a breach of 1.2894, the Mar 8 high and a key medium-term resistance, strengthening a bullish condition. The break opens 1.2996, the Jul 27 ‘23 high. Initial firm support is 1.2794, the 20-day EMA.
EURGBP TECHS: Pierces Key Support
- RES 4: 0.8586 76.4% retracement of the Apr 23 - Jun 14 bear leg
- RES 3: 0.8568 High May 20
- RES 2: 0.8485/99 50-day EMA / High Jul 1
- RES 1: 0.8453 20-day EMA
- PRICE: 0.8396 @ 06:10 BST Jul 15
- SUP 1: 0.8389 Intraday low
- SUP 2: 0.8388 Low Aug 17 2022
- SUP 3: 0.8366 2.236 proj of the Apr 23 - 30 - May 9 price swing
- SUP 4: 0.8322 2.618 proj of the Apr 23 - 30 - May 9 price swing
A bear cycle in EURGBP remains intact and the cross has traded lower today.The sell-off last week resulted in a print below key support at 0.8397, the Jun 14 low and the bear trigger. Clearance of this level would resume the medium-term downtrend and pave the war for an extension towards 0.8366, a Fibonacci projection. Initial firm resistance is seen at 0.8453, the 20-day EMA.
USDJPY TECHS: Trades Through Key Trendline Support
- RES 4: 163.93 2.0% 10-dma envelope
- RES 3: 163.36 2.00 proj of the May 3 - 14 - 16 price swing
- RES 2: 162.21 1.764 proj of the May 3 - 14 - 16 price swing
- RES 1: 159.75/161.95 20-day EMA / High Jul 3 and the bull trigger
- PRICE: 157.91 @ 06:25 BST Jul 15
- SUP 1: 157.38 Low Jul 12
- SUP 2: 156.83 38.2% retracement of the Dec 28 ‘23 - Jul 3 bull run
- SUP 3: 155.72 Low Jun 12
- SUP 4: 154.55 Low Jun 4
USDJPY traded sharply lower Thursday, and the pair remains soft. Price breached the 20-day EMA and exposed the next important support at 158.37, the trendline drawn from the Dec 28 low last year. The line has been pierced, a clear break of it would highlight a potential reversal. This would open 156.83, a Fibonacci retracement. For bulls, a reversal higher would refocus attention on key resistance and the bull trigger at 161.95, the Jul 3 high.
EURJPY TECHS: Monitoring Trendline Support
- RES 4: 177.27 2.0% 10-dma envelope
- RES 3: 176.82 1.764 proj of the May 3 - 15 - 16 price swing
- RES 2: 176.03 1.618 proj of the May 3 - 15 - 16 price swing
- RES 1: 173.92/175.43 61.8% of the Jul 11 - 12 sell-off / High Jul 11
- PRICE: 172.06 @ 06:43 BST Jul 15
- SUP 1: 171.47 Low Jul 12
- SUP 2: 170.21 Trendline drawn from the Dec 7 ‘23 low
- SUP 3: 167.53 Low Jun 14
- SUP 4: 167.33 Low May 16
The sharp sell-offs in EURJPY last Thursday resulted in a breach of the 20-day EMA. For now, short-term weakness appears to be a correction. Attention is on the key support at 170.21, a trendline drawn from the Dec 7 ‘23 low. A clear break of this line is required to highlight a stronger reversal. Key resistance and the bull trigger has been defined at 175.43, the Jun 11 high. A break would resume the uptrend.
AUDUSD TECHS: Holding On To Its Recent Gains
- RES 4: 0.6895 High Jul 13 / 14 2023
- RES 3: 0.6871 High Dec 28 and a key resistance
- RES 2: 0.6839 High Jan 02
- RES 1: 0.6799 High Jul 11
- PRICE: 0.6774 @ 06:53 BST Jul 15
- SUP 1: 0.6703 20-day EMA
- SUP 2: 0.6657 50-day EMA
- SUP 3: 0.6576 Low Jun 10 and a key support
- SUP 4: 0.6558 Low May 8
AUDUSD bullish conditions remain intact and the pair is holding on to its recent gains. The move higher last week marks an extension of the recent breach of resistance at 0.6714, the May 16 high. The clearance of 0.6714, confirmed a resumption of the bull leg that started Apr 19. Sights are on 0.6839 next, the Jan 2 high. Key short-term support has been defined at 0.6576, the Jun 10 low. Initial firm support is at 0.6703, the 20-day EMA.
USDCAD TECHS: Resistance Remains Intact For Now
- RES 4: 1.3899 High Nov 1 and a key resistance
- RES 3: 1.3846/55 High Apr 16 and the bull trigger / High Nov 10 2023
- RES 2: 1.3755/3792 High Jul 2 / High Jun 11
- RES 1: 1.3666 50-day EMA
- PRICE: 1.3661 @ 07:54 BST Jul 15
- SUP 1: 1.3590/89 Low May 16 and a key support / Intraday low
- SUP 2: 1.3547 Low Apr 9
- SUP 3: 1.3512 50.0% retracement of the Dec 27 - Apr 16 bull cycle
- SUP 4: 1.3478 Low Apr 4
USDCAD has recovered from last week’s low. However, a short-term bear threat remains present. The recent break of the 50-day EMA - currently at 1.3666, reinforces a bearish condition and exposes 1.3590, the May 16 low and a key support. It has been pierced, a clear breach of it would highlight an important technical break. Initial firm resistance to watch is 1.3755, the Jul 2 high. Clearance of this level would be bullish.
FIXED INCOME
BUND TECHS: (U4) Corrective Cycle Still In Play
- RES 4: 133.21 High Jun 14 and the bull trigger
- RES 3: 132.80 High Jun 25
- RES 2: 132.51 76.4% retracement of the Jun 14 - Jul 3 bear leg
- RES 1: 132.08 High Jul 11
- PRICE: 131.47 @ 05:23 BST Jul 15
- SUP 1: 130.78/23 Low Jul 9 / 3 and key short-term support
- SUP 2: 129.52 Low Jun 10
- SUP 3: 129.37 Low May 31 and the bear trigger
- SUP 4: 129.00 Round number support
The trend condition in Bund futures remains bearish and short-term gains appear to be corrective. However, the contract last week traded through resistance at the 50-day EMA, at 131.57. This does signal scope for an extension and has exposed 132.51, a Fibonacci retracement point. Clearance of this level would expose 132.21, the Jun 14 high. For bears, a resumption of weakness would refocus attention on key support at 130.23, the Jul 3 low.
BOBL TECHS: (U4) Short-Term Bull Intact
- RES 4: 117.160 High Jun 14 and the bull trigger
- RES 2: 116.920 High Jun 24
- RES 3: 116.775 76.4% retracement of the Jun 14 - Jul 5 bear leg
- RES 1: 116.570 High Jul 11
- PRICE: 116.270 @ 05:38 BST Jul 15
- SUP 1: 115.900 Low Jul 9
- SUP 2: 115.530 Low Jul and the key short-term support
- SUP 3: 115.180 Low Jun 10
- SUP 4: 115.060 Low May 31 and the bear trigger
The trend set-up in Bobl futures is unchanged and the outlook remains bearish. However, a corrective cycle remains in play and last Thursday’s strong gains strengthen the near-term bullish theme. A resumption of gains would open 116.775, a Fibonacci retracement. Clearance of this level would expose 117.160, the Jun 14 high and bull trigger. On the downside, a reversal would refocus attention on 115.530, the Jul 5 low and a key support.
SCHATZ TECHS: (U4) Bullish Short-Term Outlook
- RES 4: 105.975 High Jun 14 and the bull trigger
- RES 3: 105.837 61.8% retracement of the Jun 14 - Jul 5 bear leg
- RES 2: 105.805 High Jun 26
- RES 1: 105.752 61.8% retracement of the Jun 14 - Jul 5 bear leg
- PRICE: 105.650 @ 05:44 BST Jul 15
- SUP 1: 105.495/390 Low Jul 11 / 5
- SUP 2: 105.314 76.4% retracement of the May 24 Jun 14 bull cycle
- SUP 3: 105.175 Low Jun 7
- SUP 4: 105.110 Low May 24 and the bear trigger
Schatz futures traded higher last Thursday. This signals scope an extension towards 105.752 and 105.837, Fibonacci retracement points. A break of 105.837 would strengthen a bullish theme and expose 105.975, the Jun 14 high and a key resistance. On the downside, a reversal would refocus attention on key short-term support at 105.390, the Jul 5 low. Clearance of this level would reinstate a bearish theme.
GILT TECHS: (U4) Bullish Price Action
- RES 4: 100.00 Psychological round number
- RES 3: 99.62 1.382 proj of the May 29 - Jun 4 - 10 price swing
- RES 2: 98.92/99.23 High Jun 25 / 21 and a key resistance
- RES 1: 98.53 High Jul 11
- PRICE: 98.16 @ Close Jul 12
- SUP 1: 97.63/96.57 Low Jul 11 / 1 and a key support
- SUP 2: 96.25 76.4% retracement of the May 29 - Jun 21 bull run
- SUP 3: 96.12 Low Jun 10
- SUP 4: 95.33 Low May 29 and a key support
Gilt futures traded higher last Thursday and the contract is holding on to the bulk of its recent gains. Resistance at 98.24, the Jun 28 high, has been cleared. A continuation would expose key short-term resistance at 99.23, the Jun 21 high. On the downside, initial support to watch lies at 97.63, Thursday’s low. A break would highlight a reversal and this would refocus attention on 96.57, the Jul 1 low and a key short-term support.
BTP TECHS: (U4) Bull Cycle Remains In Play
- RES 4: 119.55 1.764 proj of the Jun 11 - 21 - Jul 2 price swing
- RES 3: 119.00 Round number resistance
- RES 2: 118.58 High May 16 and a key resistance
- RES 1: 118.01 Intraday high
- PRICE: 117.98 @ 10:08 BST Jul 15
- SUP 1: 116.55 20-day EMA
- SUP 2: 116.07 Low Jul 8
- SUP 3: 114.72 Low Jul 2
- SUP 4: 114.35 Low Jun 11 and key support
BTP futures have recovered from 114.72, the Jul 2 low. Last week’s gains resulted in a break of resistance at 117.09, the Jun 21 high, and firmer resistance at 117.62, the Jun 5 high. This undermines a recent bearish theme and signals scope for a climb towards 118.58, the May 16 high and a key resistance. Initial support lies at 116.55, the 20-day EMA. A clear break of it would highlight a potential reversal.
US 10YR FUTURE TECHS: (U4) Bull Cycle Remains In Play
- RES 4: 112-25 High Mar 8
- RES 3: 111-31 1.382 proj of the Apr 25 - May 16 - 29 price swing
- RES 2: 111-13 High Mar 25
- RES 1: 111-10+ High Jul 8
- PRICE: 111-04 @ 16:45 BST Jul 12
- SUP 1: 110-07+/109-31 20- and 50-day EMA values
- SUP 2: 109-02+/109-00+ Low Jul 1 / Low Jun 10 and key support
- SUP 3: 108-27+ Low Jun 3
- SUP 4: 108-22+ Trendline drawn from the Apr 25 low
Treasuries rallied Thursday and held the bulk of the upside into the Friday close. This confirms an extension of the bull cycle that started Jul 1. The move higher has resulted in a breach of 111-01, the Jun 14 high. This cancels a recent bearish threat and instead signals scope for an bullish continuation near-term with the focus on 111-13 next, the Mar 25 high. Clearance of this hurdle would open 111-31, a Fibonacci projection. Initial firm support is at 110-07+, the 20-day EMA.
EQUITIES
EUROSTOXX50 TECHS: (U4) Breaches Resistance
- RES 4: 5200.00 Round number resistance
- RES 3: 5151.00 High May 16 and the bull trigger
- RES 2: 5132.00 High Jun 6
- RES 1: 5087.00 High Jul 12
- PRICE: 5057.00 @ 06:04 BST Jul 15
- SUP 1: 4997.26 50-day EMA
- SUP 2: 4903.00/4860.00 Low Jul 2 / Low Jun 14 and the bear trigger
- SUP 3: 4846.00 Low Apr 19 and a key support
- SUP 4: 4800.00 Round number support
A bull cycle in Eurostoxx 50 futures remains intact and Friday’s gains reinforce the current condition. 5039.84, 61.8% of the May 16 - Jun 14 sell-off, has been cleared. This has resulted in a print above 5082.32, the 76.4% retracement. A clear break of it would be a positive development and suggest scope for an extension of the bull cycle that started Jun 14. This would open 5132.00, Jun 6 high. Initial support is 4997.26, the 50-day EMA.
E-MINI S&P TECHS: (U4) Trend Needle Points North
- RES 4: 5764.00 3.50 proj of the Apr 19 - 29 - May 2 price swing
- RES 3: 5741.34 3.236 proj of the Apr 19 - 29 - May 2 price swing
- RES 2: 5713.31 3.236 proj of the Apr 19 - 29 - May 2 price swing
- RES 1: 5708.25 High Jul 11
- PRICE: 5680.25 @ 07:17 BST Jul 15
- SUP 1:5569.65 20-day EMA
- SUP 2: 5502.75/5461.50 Low Jul 2 / 50-day EMA
- SUP 3: 5398.75 Low Jun 11
- SUP 4: 5267.75 Low May 31 and key support
The trend condition in S&P E-Minis is bullish and the contract traded to a fresh trend high once again last week. The continuation higher confirms a resumption of the uptrend and maintains the bullish sequence of higher highs and higher lows. Moving average studies are in a clear bull-mode set-up too and this continues to highlight positive market sentiment. Sights are on the 5713.31, a Fibonacci projection. Firm support is at 5569.65, the 20-day EMA.
COMMODITIES
BRENT TECHS: (U4) Corrective Cycle
- RES 4: $91.99 - 2.236 proj of the Jan 8 - 29 - Feb 5 price swing
- RES 3: $90.23 - 2.00 proj of the Jan 8 - 29 - Feb 5 price swing
- RES 2: $89.32 - High Apr 12 and the bull trigger
- RES 1: $87.95 - High Jul 5
- PRICE: $85.06 @ 06:48 BST Jul 15
- SUP 1: $83.88 - 50-day EMA
- SUP 2: $79.05/76.66 - Low Jun 7 / 4
- SUP 3: $75.31 - Low Feb 5
- SUP 4: $73.37 - Low Dec 13 and a key support
The trend condition in Brent futures remains bullish and the latest move down appears to have been a correction - for now. Recent gains highlight an extension of the current bullish sequence of higher highs and higher lows. This has opened $89.32, the Apr 12 high and a key resistance. Clearance of this level would be seen as an important medium-term bullish development. Initial firm support to watch is $83.88, the 50-day EMA.
WTI TECHS: (Q4) Support Stays Intact
- RES 4: $90.78 - High Oct 20 2023 (cont)
- RES 3: $90.00 - Psychological round number
- RES 2: $85.27 - High Apr 12 and the bull trigger
- RES 1: $84.52 - High Jul 5
- PRICE: $82.28@ 07:08 BST Jul 15
- SUP 1: $80.00 50-day EMA
- SUP 2: $74.94/72.44 - Low Jun 10 / 4
- SUP 3: $71.05 - Low Feb 5
- SUP 4: $69.22 - Low Dec 13 ‘23 and a key support
WTI futures remain above last week’s low. The recent bear leg appears to have been a correction. Recent cycle highs reinforced bullish conditions, signalling scope for a continuation of the bull cycle near-term. Moving average studies are in a bull-mode set-up too, highlighting a rising trend. Sights are on $85.27, the Apr 12 high and a bull trigger. Initial firm support to watch is $80.00, the 50-day EMA.
GOLD TECHS: Bullish Short-Term Set-Up
- RES 4: $2481.5 - 2.764 proj of the Oct 6 - 27 - Nov 13 price swing
- RES 3: $2452.5 - 2.618 proj of the Oct 6 - 27 - Nov 13 price swing
- RES 2: $2450.1 - High May 20 and the bull trigger
- RES 1: $2424.6 - High Jul 11
- PRICE: $2404.5 @ 07:22 BST Jul 15
- SUP 1: $2335.9/2286.9 - 50-day EMA / Low Jun 7
- SUP 2: $2277.4 - Low May 3 and a pivot support
- SUP 3: $2187.4 - Low Mar 28
- SUP 4: $2146.2 - Low Mar 18 and key short-term support
Gold remains constructive and last Thursday's rally reinforces short-term bullish conditions. Recent gains resulted in a breach of $2387.8, the Jun 7 high. This undermines a recent bearish theme and a clear break represents a bullish development that opens the key resistance at $2450.1, the May 20 high. Initial support to watch lies at the 50-day EMA, at 2335.9. A clear break of this average would alter the picture and expose $2277.4, May 3 low.
SILVER TECHS: Trading Closer To Its Recent Highs
- RES 4: $35.736 - 1.236 proj of Jan 22 - Apr 12 - May 2 price swing
- RES 3: $35.226 - 50.0% of the Apr 2011 - Mar 2020 bear leg
- RES 2: $33.880 - 1.00 proj of the Jan 22 - Apr 12 - May 2 price swing
- RES 1: $32.518 - High May 20 and bull trigger
- PRICE: $30.644 @ 07:58 BST Jul 15
- SUP 1: $30.273/28.573- 20-day EMA / Low Jun 26 and bear trigger
- SUP 2: $27.971 - Low May 13
- SUP 3: $26.018 - Low May 2 and a key support
- SUP 4: $24.328 - Low Mar 27
Silver has recovered from its recent lows and the metal continues to trade closer to its latest highs. The break of $30.853, the Jun 21 high, is a bullish development and undermines a recent bearish theme. A continuation higher would signal scope for a test of the key resistance and the bull trigger at $32.518, the May 20 high. On the downside, key support and the bear trigger, lies at $28.573, the Jun 26 low.