
Why MNI
MNI is the leading provider
of intelligence and analysis on the Global Fixed Income, Foreign Exchange and Energy markets. We use an innovative combination of real-time analysis, deep fundamental research and journalism to provide unique and actionable insights for traders and investors. Our "All signal, no noise" approach drives an intelligence service that is succinct and timely, which is highly regarded by our time constrained client base.Our Head Office is in London with offices in Chicago, Washington and Beijing, as well as an on the ground presence in other major financial centres across the world.
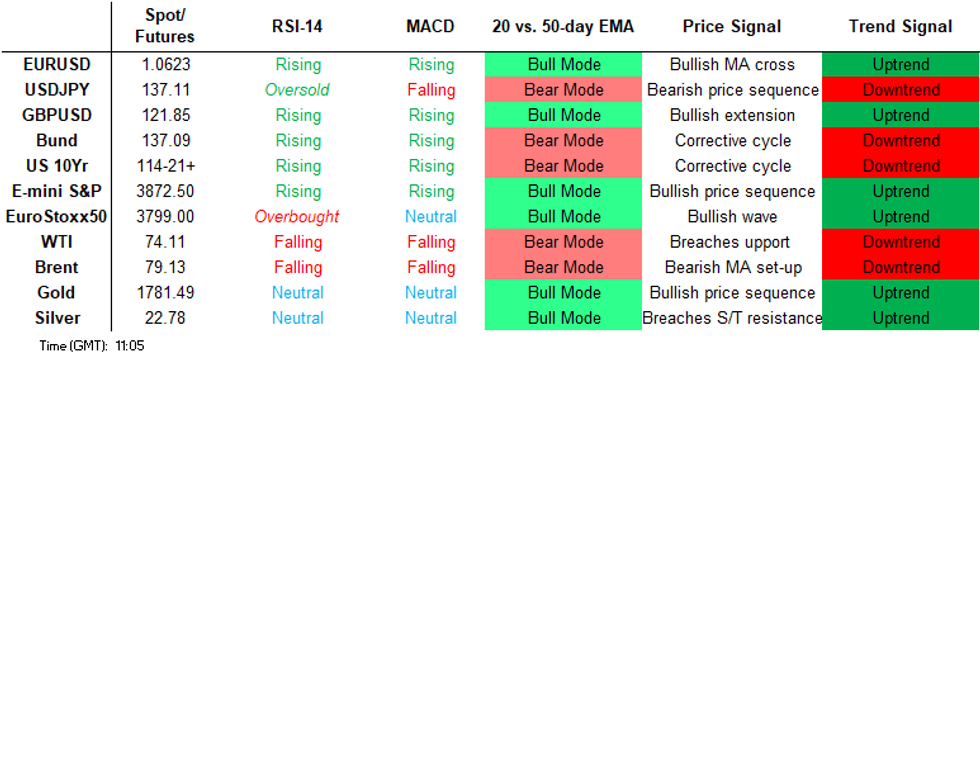
Price Signal Summary - E-Minis Candle Pattern And A Break Of Support Highlights A Reversal
- In the equity space, a strong rally in the S&P E-Minis Tuesday stalled at 4180.00. Thursday’s sell-off has reinforced a bearish threat and note that this also highlights the importance of a shooting star candle formation on Tuesday - a reversal signal. A continuation lower would open 3855.13, 50.0% retracement of the Oct 13 - Dec 13 uptrend. EUROSTOXX 50 futures traded sharply lower Thursday to extend the pullback from Tuesday’s 4037.00 high. This suggests potential for a deeper retracement with sights on the 50-day EMA, at 3794.10. A break of this average would signal scope for a continuation lower.
- In FX, EURUSD traded higher again Thursday, extending this week’s gains, before pulling back. The climb this week has confirmed a resumption of the uptrend and maintains the price sequence of higher highs and higher lows. The focus is on 1.0736 next, the 2.382 projection of the Sep 28 - Oct 4 - 13 price swing. GBPUSD trend conditions remain bullish, however, Thursday’s strong sell-off signals a possible short-term top. Attention is on the first key support at 1.2107, the Dec 7 low. Clearance of this level would pave the way for a move towards 1.1901, the Nov 30 low. On the upside, key short-term resistance has been defined at 1.2446, the Dec 14 high. USDJPY traded higher Thursday and in the process, pierced resistance at 137.97, Tuesday’s high. The pair has also tested resistance at 138.02, the 20-day EMA. A clear break of this average, if seen, would signal scope for stronger recovery. This would open 140.00 and 140.34, the 50-day EMA. The bear trigger lies at 133.63.
- On the commodity front, trend signals in Gold remain bullish despite Thursday’s sell-off. Pullbacks are considered corrective and key short-term support to watch is $1765.9, Dec 5 low. The uptrend remains intact and scope is seen for gains towards $1842.7, 50.0% retracement of the Mar - Sep bear leg. In the Oil space, recent gains in WTI futures have highlighted a bullish corrective cycle and this resulted in a test of the 20-day EMA, at $77.50. A clear break of this hurdle would signal scope for an extension and open $80.82, the 50-day EMA. On the downside, a stronger reversal lower would refocus attention on the bear trigger which lies at $70.08, the Dec 9 low.
- In the FI space, the Bund futures traded lower Thursday to extend the current bear phase that started Dec 7. The contract is weak once again today. Support at 139.13, Nov 28 low has been cleared and this suggests scope for a deeper retracement. The focus is on 136.48 next, 76.4% retracement of the Nov 8 - Dec 7 bull cycle. Gilt futures remain below last week’s highs following the latest retracement. The break of 104.79 this week, Nov 30 low, exposed the firmer support at 103.54, the Nov 21 low. This level has been pierced, A clear break would strengthen a bearish threat and signal scope for a deeper pullback towards 103.00.
FOREIGN EXCHANGE
EURUSD TECHS: Bull Cycle Extends
- RES 4: 1.0851 High Apr 25
- RES 3: 1.0787 High May 30 and a key resistance
- RES 2: 1.0769/74 2.0% 10-dma envelope / High Jun 9
- RES 1: 1.0736 2.382 proj of the Sep 28 - Oct 4 - 13 price swing
- PRICE: 1.0641 @ 05:50 GMT Dec 16
- SUP 1: 1.0528/0443 Low Dec 13 / 7 and a key short-term support
- SUP 2: 1.0465/0291 20-day EMA / Low Nov 30
- SUP 3: 1.0243 50-day EMA
- SUP 4: 1.0223 Low Nov 21
EURUSD traded higher again Thursday, extending this week’s gains, before pulling back. The break higher this week has confirmed a resumption of the uptrend and maintains the price sequence of higher highs and higher lows. The focus is on 1.0736 next, a Fibonacci projection. On the downside, key short-term support has been defined at 1.0443, Dec 7 low, where a break would signal a short-term top. Initial support lies at 1.0528, the Dec 13 low.
GBPUSD TECHS: Finds Resistance
- RES 4: 1.2667 High May 27
- RES 3: 1.2599 High Jun 7
- RES 2: 1.2506 1.382 proj of the Sep 26 - Oct 5 - Oct 12 price swing
- RES 1: 1.2446 High Dec 14 and the bull trigger
- PRICE: 1.2204 @ 06:07 GMT Dec 16
- SUP 1: 1.2119 20-day EMA
- SUP 2: 1.2107 Low Dec 7 and a key support
- SUP 3: 1.2054/1901 Low Dec 1 / Low Nov 30
- SUP 4: 1.1872 50-day EMA
Trend conditions in GBPUSD remain bullish, however, Thursday’s strong sell-off signals a possible short-term top. Attention is on the first key support at 1.2107, the Dec 7 low. Clearance of this level would pave the way for a move towards 1.1901, the Noc 30 low. On the upside, key short-term resistance has been defined at 1.2446, the Dec 14 high. A turn higher and a break of this hurdle, would confirm a resumption of the uptrend.
EURGBP TECHS: Breaches The 50-Day EMA
- RES 4: 0.8907 50.0% retracement of the Sep 26 - Dec 1 bear leg
- RES 3: 0.8867 High Oct 12
- RES 2: 0.8829 High Nov 09 and the bull trigger
- RES 1: 0.8778 High Nov 16
- PRICE: 0.8724 @ 06:26 GMT Dec 16
- SUP 1: 0.8655/8593 50-day EMA / Low Dec 15
- SUP 2: 0.8553/47 200-dma / Low Dec 1 and bear trigger
- SUP 3: 0.8522 Low Aug 30
- SUP 4: 0.8471 Low Aug 28
EURGBP rallied sharply higher Thursday and in the process cleared the 50-day EMA at 0.8655. The break higher improves the very short-term outlook for bulls and signals scope for a climb towards resistance at 0.8829, the Nov 9 high and a bull trigger. On the downside, key support has been defined at 0.8547, the Dec 1 low, where a break is required to signal a continuation of the downtrend.
USDJPY TECHS: Challenging The 20-Day EMA
- RES 4: 141.61 High Nov 23
- RES 3: 140.34 50-day EMA
- RES 2: 140.00 Round number resistance
- RES 1: 138.02 /17 20-day EMA / High Dec 15
- PRICE: 137.18 @ 06:41 GMT Dec 16
- SUP 1: 134.54/133.63 Dec 14 low / 2 and the bear trigger
- SUP 2: 132.56 Low Aug 15
- SUP 3: 131.08 1.00 proj of the Oct 31 - Nov 15 - 21 price swing
- SUP 4: 130.41 Low Aug 2
USDJPY traded higher Thursday and in the process, pierced resistance at 137.97, Tuesday’s high. The pair has also tested resistance at 138.02, the 20-day EMA. A clear break of this average, if seen, would signal scope for stronger recovery and highlight an extension of the corrective cycle. This would open 140.00 and 140.34, the 50-day EMA. On the downside, the bear trigger lies at 133.63.
EURJPY TECHS: Bull Cycle Extends
- RES 4: 148.40 High Oct 21 and a key resistance
- RES 3: 147.75 High Oct 31
- RES 2: 147.10 High Nov 9
- RES 1: 146.73 High Dec 15
- PRICE: 146.26 @ 06:55 GMT Dec 16
- SUP 1: 144.38/143.50 20-day EMA / Low Dec 14
- SUP 2: 143.10 Low Dec 6
- SUP 3: 140.77 Low Dec 2 and the bear trigger
- SUP 4: 140.00 76.4% retracement of the Sep 26 - Oct 21 bull leg
EURJPY resumed its uptrend Thursday and traded to fresh highs for the week. The move higher reinforces the bullish importance of the recent trendline break - the trendline is drawn from the Oct 21 high and was breached on Dec 12. Resistance at 146.14, the Nov 23 high has been pierced and this signals potential for a climb towards 147.75, the Oct 31 high. Initial firm support lies at 143.50, the Dec 15 low.
AUDUSD TECHS: Strong Reversal
- RES 4: 0.6976 2.00 proj of the Oct 13 - 27 - Nov 3 price swing
- RES 3: 0.6956 High Aug 30
- RES 2: 0.6909 76.4% retracement of the Aug 11 - Oct 13 downleg
- RES 1: 0.6893 High Dec 13 and the bull trigger
- PRICE: 0.6713 @ 07:07 GMT Dec 16
- SUP 1: 0.6677 Low Dec 15
- SUP 2: 0.6658/6585 50-day EMA / Low Nov 21
- SUP 3: 0.6387 Low Nov 10
- SUP 4: 0.6272 Low Nov 3 and a key support
A sharp sell-off in AUDUSD on Thursday signals a short-term top and suggests scope for a deeper pullback near-term. The 20-day EMA has been breached and attention turns to the 50-day EMA at 0.6658. This represents a key short-term support and a break, if seen, would suggest potential for a deeper retracement. On the upside, key resistance has been defined at 0.6893, the Dec 13 high. A break would resume the recent uptrend.
USDCAD TECHS: Outlook Remains Bullish
- RES 4: 1.3855 High Oct 21 - Nov 16 bear leg
- RES 3: 1.3808 High Nov 3 and a key resistance
- RES 2: 1.3751 High Nov 4
- RES 1: 1.3700 High Dec 7
- PRICE: 1.3623 @ 07:17 GMT Dec 16
- SUP 1: 1.3519 Low Dec 14
- SUP 2: 1.3459/3385 Former trendline resistance / Low Dec 5
- SUP 3: 1.3317/3226 Low Nov 24/25 / Low Nov 15 and bear trigger
- SUP 4: 1.3205 61.8% retracement of the Aug 11 - Oct 13 rally
USDCAD remains below Tuesday’s high but Thursday’s rally reinforces bullish conditions. The recent break of trendline resistance, drawn from the Oct 13 high, strengthened bullish conditions and this has opened 1.3751, the Nov 4 high. On the downside, a break below the former trendline resistance - at 1.3459 - would flip the outlook more negative and expose 1.3385, Dec 5 low.
FIXED INCOME
BUND TECHS: (H3) Corrective Bear Cycle Extends
- RES 4: 143.68 1.382 proj of the Oct 21 - 28 - Nov 8 price swing
- RES 3: 143.00 Round number resistance
- RES 2: 141.70/142.91 High Dec 13 / 7 and the bull trigger
- RES 1: 138.62/140.21 Intraday high / 20-day EMA
- PRICE: 137.32 @ 09:37 GMT Dec 16
- SUP 1: 136.80 Low Nov 10
- SUP 2: 136.48 76.4% retracement of the Nov 8 - Dec 7 bull cycle
- SUP 3: 136.11 Low Nov 9
- SUP 4: 134.50 Low Nov 8 and a key support
Bund futures traded lower Thursday to extend the current bear phase that started Dec 7. The contract is weak once again today. The move lower yesterday resulted in a break of support at 139.13, Nov 28 low and this suggests scope for a deeper retracement. The focus is on 136.48 next, a Fibonacci retracement. On the upside, initial firm resistance to watch is at 141.70, the Dec 13 high. The bull trigger is 142.91, the Dec 7 high.
BOBL TECHS: (H3) Bearish Extension
- RES 4: 120.150 High Dec 7 and the bull trigger
- RES 3: 119.490 High Dec 13
- RES 2: 119.230 High Dec 15
- RES 1: 117.720/118.260 Intraday high Low Nov 28
- PRICE: 117.120 @ 09:45 GMT Dec 16
- SUP 1: 117.000 Round number support
- SUP 2: 116.890 Low Nov 8 and a key support
- SUP 3: 116.773 1.764 proj of the Dec 7 - 12 - 13 price swing
- SUP 4: 116.410 2.00 proj of the Dec 7 - 12 - 13 price swing
Yesterday's sell-off in Bobl futures has strengthened the current bearish cycle and support at 118.260, the Dec 13 low, has been cleared. The break lower signals scope for an extension towards the 116.890 next, the Nov 8 low. On the upside, initial firm resistance has been defined at 119.490, the Dec 13 high. A break of this hurdle would signal the end of the cycle lower and refocus attention on key resistance at 120.150, the Dec 6 high.
SCHATZ TECHS: (H3) Clears Support
- RES 4: 107.023 1.764 proj of the Nov 1 - 24 - 28 price swing
- RES 3: 106.875 High Dec 2 and the bull trigger
- RES 2: 106.680 High Dec 13
- RES 1: 106.005/106.335 Intraday high / Low Nov 28
- PRICE: 105.835 @ 09:48 GMT Dec 16
- SUP 1: 105.805 Intraday low
- SUP 2: 105.660 2.00 projection of the Dec 2 - 13 price swing
- SUP 3: 105.540 2.236 projection of the Dec 2 - 13 price swing
- SUP 4: 105.465 2.382 projection of the Dec 2 - 13 price swing
Schatz futures traded sharply lower Thursday and in the process, cleared support at 106.335, the Nov 28 low. The break lower, signals potential for a deeper pullback. This has opened 105.660 and 105.540, Fibonacci projections. On the upside, 106.335 marks resistance. A firmer level is at 106.680, the Dec 13 high. A break of this level would refocus attention on the bull trigger at 106.875.
GILT TECHS: (H3) Pierces Key Short-Term Support
- RES 4: 109.47 High Aug 31 (cont)
- RES 3: 108.00 Round number resistance
- RES 2: 107.06 High Nov 24 and the bull trigger
- RES 1: 105.51/106.95 High Dec 13 / 2
- PRICE: 104.83 @ Close Dec 15
- SUP 1: 103.33 Intraday low
- SUP 2: 103.00 Round number support
- SUP 3: 102.77 Low Nov 10 (cont)
- SUP 4: 102.00 Round number support
Gilt futures remain below last week’s highs following the latest retracement. The break of 104.79 this week, Nov 30 low, exposed the firmer support at 103.54, the Nov 21 low. This level has been pierced, A clear break would strengthen a bearish threat and signal scope for a deeper pullback. This would open 103.00. On the upside, the bull trigger is unchanged at 107.06, the Nov 24 high.
BTP TECHS: (H3) Pullback Extends
- RES 4: 120.09 1.236 proj of the Oct 21 - 27 - Nov 8 price swing
- RES 3: 119.00 Round number resistance
- RES 2: 117.93/118.96 High Dec 13 / 7 and the bull trigger
- RES 1: 113.23/116.43 Intraday high / High Dec 15
- PRICE: 113.79 @ Close Dec 15
- SUP 1: 111.00 Round number support
- SUP 2: 110.71 Low Nov 9
- SUP 3: 109.46 Low Nov 8
- SUP 4: 107.51 Low Oct 24
BTP futures traded sharply lower Thursday, extending the current bear leg. The contract has cleared support at 115.01, the Nov 28 low and this signals scope for a deeper pullback. Attention is on the 111.00 handle. On the upside, initial firm resistance is far-off at 117.93, the Dec 13 high. A break would expose key resistance and the bull trigger at 118.96, the Dec 7 high. Clearance of this level would resume the uptrend.
US 10YR FUTURE TECHS: (H3) Trend Needle Points North
- RES 4: 116-23+ 2.0% 10-dma envelope
- RES 3: 115-26 2.00 proj of the Oct 21 - 27 - Nov 3 price swing
- RES 2: 115-14 50% Aug - Oct Downleg
- RES 1: 115-11+ High Dec 13
- PRICE: 114-30+ @ 19:43 GMT Dec 15
- SUP 1: 113-22+/113-10 Low Dec 12 / 50-day EMA
- SUP 2: 112-11+ Low Nov 21 and a key short-term support
- SUP 3: 112-05+ Low Nov 14
- SUP 4: 110-22 Low Nov 10
Treasury futures remain below Tuesday’s high. This week’s print above resistance at 115-06+, Dec 7 high and the bull trigger, is a positive development. A clear break of this hurdle would confirm a resumption of the current uptrend and pave the way for a climb towards 115-26, a Fibonacci projection. Key short-term support has been defined at 113-22+, Dec 12 low. A reversal lower and a break of this level would threaten bullish conditions.
EQUITIES
EUROSTOXX50 TECHS: (Z2) Sell-Off Exposes The 50-Day EMA
- RES 4: 4230.50 High Feb 10 (cont)
- RES 3: 4132.60 76.4/% of the Nov ‘21 - Mar ‘22 bear leg (cont)
- RES 2: 4037.00/4049.50 High Dec 13 / High Feb 23 (cont)
- RES 1: 3903.00 Low Dec 8
- PRICE: 3844.00 @ 06:28 GMT Dec 16
- SUP 1: 3794.10 50-day EMA
- SUP 2: 3697.00 Low Nov 10
- SUP 3: 3636.50 5.0% retracement of the Oct - Dec bull cycle
- SUP 4: 3581.00 Low Nov 4
EUROSTOXX 50 futures traded sharply lower Thursday to extend the pullback from Tuesday’s 4037.00 high. The move lower suggests potential for a deeper retracement with sights on the 50-day EMA, at 3794.10. A break of this average would signal scope for a continuation lower. On the upside, key resistance has been defined at 4037.00 where a break is required to resume the recent uptrend.
E-MINI S&P (H3): Bearish Outlook
- RES 4: 4361.00 High Aug 16 and a key M/T resistance
- RES 3: 4250.00 High Aug 26
- RES 2: 4194.25 High Sep 13 and a key resistance
- RES 1: 4043.00/4180.00 High Dec 15 / 13 and the bull trigger
- PRICE: 3931.25 @ 06:54 GMT Dec 16
- SUP 1: 3855.13 50.0% retracement of the Oct 13 - Dec 13 uptrend
- SUP 2: 3800.00 Round number support
- SUP 3: 3778.45 61.8% retracement of the Oct 13 - Dec 13 uptrend
- SUP 4: 3735.00 Low Nov 3 and a key support
A rally in the S&P E-Minis Tuesday saw price trade above 4142.50, Dec 1 high. However, a strong reversal, resulted in a sharp move lower and price remains below Tuesday high. Thursday’s sell-off has reinforced a bearish threat and note that this also highlights the importance of a shooting star candle formation on Tuesday - a reversal signal. A continuation lower would open 3855.13, a Fibonacci retracement. Key resistance is 4180.00.
COMMODITIES
BRENT TECHS: (G3) 20-Day EMA Remains Intact
- RES 4: $91.63 - High Nov 17
- RES 3: $89.37 - High Dec 1
- RES 2: $86.24 - 50-day EMA
- RES 1: $82.87/83.18 - 20-day EMA / High Dec 15
- PRICE: $79.36 @ 10:05 GMT Dec 16
- SUP 1: $78.10/75.11 - Low Dec 13 / Low Dec 9 and the bear trigger
- SUP 2: $72.33 - 1.00 proj of the Nov 7 - 28 - Dec 1 price swing
- SUP 3: $69.28 - Low Dec 20 2021 (cont)
- SUP 4: $68.31 - 1.236 proj of the Nov 7 - 28 - Dec 1 price swing
Brent futures are trading lower today. Recent gains have highlighted a bullish corrective cycle. Price has tested resistance at $82.87, the 20-day EMA. A break of this level would signal potential for a stronger recovery and open the 50-day EMA, at $86.24. The broader trend outlook is bearish. A stronger reversal lower would signal the end of the correction and refocus attention on Friday’s low of $75.11 - the bear trigger.
WTI TECHS: (F3) Pulls Back From Resistance At The 20-Day EMA
- RES 4: $89.20 - High Nov 11
- RES 3: $86.90 - High Nov 16
- RES 2: $80.82 - 50-day EMA
- RES 1: $77.37/77.77 - 20-day EMA / High Dec 15
- PRICE: $74.28 @ 10:09 GMT Dec 16
- SUP 1: $73.21/70.08 - Low Dec 13 / 9 and the bear trigger
- SUP 2: $68.86 - 1.236 proj of the Aug 30 - Sep 28 - Nov 7 price swing
- SUP 3: $66.06 - 1.382 proj of the Aug 30 - Sep 28 - Nov 7 price swing
- SUP 4: $63.80 - 1.50 proj of the Aug 30 - Sep 28 - Nov 7 price swing
Trend conditions in WTI futures remain bearish. Recent gains highlighted a bullish corrective cycle and this resulted in a test of the 20-day EMA, at $77.50. A clear break of this hurdle would signal scope for an extension and open $80.82, the 50-day EMA. On the downside, a stronger reversal lower would refocus attention on the bear trigger which lies at $70.08, the Dec 9 low.
GOLD TECHS: Corrective Pullback
- RES 4: $1909.8 - High May 5
- RES 3: $1842.7 - 50.0% retracement of the Mar - Sep bear leg
- RES 2: $1833.0 - High Jun 29
- RES 1: $1824.5 - High Dec 13 and the bull trigger
- PRICE: $1778.2 @ 05:32 GMT Dec 16
- SUP 1: $1772.4/65.9 - 20-day EMA / Low Dec 5
- SUP 2: $1729.0 - Low Nov 23 and key short-term support
- SUP 3: $1702.3 - Low Nov 9
- SUP 4: $1664.8 - Low Sep 8
Trend conditions in Gold remain bullish despite Thursday’s sell-off. Pullbacks are considered corrective and key short-term support to watch is $1765.9, Dec 5 low. The yellow metal earlier this week breached $1810.0, Dec 5 high, to resume the uptrend. This maintains the positive price sequence of higher highs and higher lows and opens $1842.7, a Fibonacci retracement. On the downside, a break of $1765.9 would signal scope for a deeper pullback.
SILVER TECHS: Corrective Pullback
- RES 4: $26.002 - High Apr 19
- RES 3: $25.293 - High Apr 20
- RES 2: $24.729 - 76.4% retracement of the Mar - Sep bear leg
- RES 1: $24.129 - High Dec 13
- PRICE: $23.032 @ 07:22 GMT Dec 16
- SUP 1: $22.025 - Low Dec 6 and a key short-term support
- SUP 2: $21.379/20.585 - 50-day EMA / Low Nov 21 and key support
- SUP 3: $19.416 - Low Nov 4
- SUP 4: $18.835 - Low Nov 3
The trend outlook in Silver remains bullish and yesterday’s pullback is considered corrective. The high print on Dec 9 above $23.517, Dec 5 high, highlights a continuation of the bull cycle and maintains the bullish price sequence of higher highs and higher lows. Tuesday’s gains reinforce bullish conditions and pave the way for $24.729, a Fibonacci retracement. Key short-term support has been defined at $22.025, the Dec 6 low.
Why MNI
MNI is the leading provider
of intelligence and analysis on the Global Fixed Income, Foreign Exchange and Energy markets. We use an innovative combination of real-time analysis, deep fundamental research and journalism to provide unique and actionable insights for traders and investors. Our "All signal, no noise" approach drives an intelligence service that is succinct and timely, which is highly regarded by our time constrained client base.Our Head Office is in London with offices in Chicago, Washington and Beijing, as well as an on the ground presence in other major financial centres across the world.