
Why MNI
MNI is the leading provider
of intelligence and analysis on the Global Fixed Income, Foreign Exchange and Energy markets. We use an innovative combination of real-time analysis, deep fundamental research and journalism to provide unique and actionable insights for traders and investors. Our "All signal, no noise" approach drives an intelligence service that is succinct and timely, which is highly regarded by our time constrained client base.Our Head Office is in London with offices in Chicago, Washington and Beijing, as well as an on the ground presence in other major financial centres across the world.
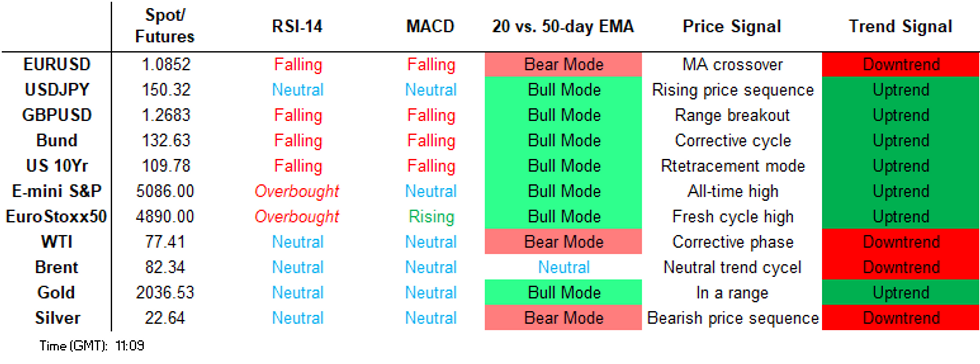
Price Signal Summary - S&P E-Minis Bull Cycle Remains In Play
- In the equity space, the trend condition in S&P E-Minis remains bullish following last week’s gains and pullbacks are considered corrective. The move higher continues to highlight the fact that corrections remain shallow - a bullish signal. Support to watch is 5000.90, the 20-day EMA. A resumption of gains would open vol-band based resistance at 5137.13. The bull cycle in {EU} EUROSTOXX 50 futures remains firmly intact and the contract is holding on to its recent gains. Moving average studies are in a bull-mode position too, highlighting positive market sentiment. Sights are on 4904.40 next, the 2.236 projection of the Nov 8 - 24 - 28 price swing. Initial firm support lies at 4747.70, the 20-day EMA.
- In FX, EURUSD has pierced the 50-day EMA - at 1.0835. A clear break of this average is required to signal a short-term reversal. Last week’s high of 1.0888 (Feb 22) is also seen as a key short-term resistance. Clearance of this hurdle would open 1.0932, the Jan 24 high. Note that the price pattern on Feb 22 is a shooting star candle (inverted hammer) and a possible reversal signal. A move lower would instead expose 1.0695, Feb 14 low. A broader bear threat in GBPUSD remains present and recent gains appear to be a correction - for now. A reversal lower would refocus attention on key support and the bear trigger at 1.2519, the Feb 5 low. Clearance of this level would open 1.2500, the Dec 13 low, and 1.2432, 50.0% of the Oct 4 - Dec 28 bull phase. For bulls, initial resistance to watch is 1.2775, the Jan 25 high. The USDJPY trend outlook remains bullish. The latest pause appears to be a bull flag formation. A resumption of the trend would pave the way for a climb towards 151.91/95, the Nov 13 ‘23 high and the Oct 1 ‘22 high and major resistance. On the downside, initial firm support lies at 149.41, the 20-day EMA.
- On the commodity front, recent price activity in Gold has defined key resistance at $2065.5, the Feb 1 high, and key support at $1984.3, the Feb 14 low. Both levels represent important short-term directional triggers. A clear break of the Feb 1 high would highlight a short-term reversal and open $2088.5, the Dec 28 high. For bears, clearance of $1984.3 would expose an important support and bear trigger at $1973.2, the Dec 13 low. In the oil space, recent gains in WTI futures still appear corrective at these levels and key short-term resistance at $79.09, the Jan 29 high, remains intact. Clearance of this level would alter the picture and highlight a bullish development. A break would open $81.70, 76.4% of the Sep 19 - Dec 13 bear cycle. Support to watch lies at $71.49, the Feb 5 low. A breach of this level would reinstate the recent bearish theme and pave the way for a move towards $69.79, the Jan 3 low. Initial support lies at $75.56, the 50-day EMA.
- In the FI space, Bund futures remain in a bear mode condition and gains are considered corrective. Moving average studies have recently crossed and are in a bear-mode set-up too, highlighting a downtrend. The focus is on 131.49 next, the 61.8% retracement of the Oct 4 - Dec 27 bull phase. Initial resistance is 133.52, the 20-day EMA. A bear threat in Gilt futures remains present and the contract continues to trade closer to its recent lows. The recent breach of support levels strengthens a bearish theme and confirms a resumption of the downtrend. Sights are on the 96.00 handle next. On the upside, initial firm resistance is at 98.53, Monday’s high. Short-term gains would be considered corrective.
FOREIGN EXCHANGE
EURUSD TECHS: Watching Resistance
- RES 4: 1.1046 High Jan 2
- RES 3: 1.0998 High Jan 5
- RES 2: 1.0932 High Jan 24
- RES 1: 1.0888/98 High Feb 22 and a key resistance / High Feb 02
- PRICE: 1.0849 @ 05:41 GMT Feb 27
- SUP 1: 1.0762/0695 Low Feb 20 / 14 and the bear trigger
- SUP 2: 1.0656 Low Nov 10
- SUP 3: 1.0611 76.4% retracement of the Oct - Dec bull leg
- SUP 4: 1.0568 Low Nov 2
EURUSD has pierced the 50-day EMA - at 1.0835. A clear break of this average is required to signal a short-term reversal. Last week’s high of 1.0888 (Feb 22) is also seen as a key short-term resistance. Clearance of this hurdle would open 1.0932, the Jan 24 high. Note that the price pattern on Feb 22 is a shooting star candle (inverted hammer) and a possible reversal signal. A move lower would instead expose 1.0695, Feb 14 low.
GBPUSD TECHS: Key Resistance Remains Intact For Now
- RES 4: 1.2881 76.4% retracement of the Jul 14 - Oct 4 bear leg
- RES 3: 1.2827 High Dec 28 and the bull trigger
- RES 2: 1.2775 High Jan 24
- RES 1: 1.2709 High Feb 22
- PRICE: 1.2679 @ 05:49 GMT Feb 27
- SUP 1: 1.2580 Low Feb 20
- SUP 2: 1.2519 Low Feb 5 and the bear trigger
- SUP 3: 1.2500 Low Dec 13
- SUP 4: 1.2432 50.0% retracement of the Oct 4 - Dec 28 bull phase
A broader bear threat in GBPUSD remains present and recent gains appear to be a correction - for now. A reversal lower would refocus attention on key support and the bear trigger at 1.2519, the Feb 5 low. Clearance of this level would open 1.2500, the Dec 13 low, and 1.2432, a Fibonacci retracement. For bulls resistance to watch is 1.2775, the Jan 25 high, ahead of 1.2827, the Dec 28 high and key bull trigger.
EURGBP TECHS: MA Studies Highlight A Downtrend
- RES 4: 0.8676 High Jan 3
- RES 3: 0.8620 High Jan 20
- RES 2: 0.8593 High Jan 19
- RES 1: 0.8578 High Feb 20 and key short-term resistance
- PRICE: 0.8557 @ 06:11 GMT Feb 27
- SUP 1: 0.8493 Low Aug 23 2023 and a key medium-term support
- SUP 2: 0.8454 76.4% of the Mar 7 - Sep 26 ‘23 bull phase
- SUP 3: 0.8388 Low Aug 17 2023
- SUP 4: 0.8340 Low Aug 2 2022
A bear cycle in EURGBP remains intact and moving average studies continue to highlight a downtrend. A resumption of weakness would expose support and the bear trigger at 0.8493, the Aug 23 low. Clearance of this level would confirm a continuation of the trend and open 0.8454, a Fibonacci retracement point. Key short-term resistance has been defined at 0.8578, the Feb 20 high.Clearance of this level would highlight a S/T bullish development.
USDJPY TECHS: Bull Flag Formation
- RES 4: 152.43 0.764 proj of the Dec 28 - Jan 19 - Feb 1 price swing
- RES 3: 151.91/95 High Nov 13 / High Oct 1 ‘22 and major resistance
- RES 2: 151.43 High Nov 16
- RES 1: 150.89 High Feb 13
- PRICE: 150.50 @ 06:46 GMT Feb 27
- SUP 1: 149.41/148.01 20- and 50-day EMA values
- SUP 2: 147.63 Low Feb 7
- SUP 3: 145.90 Low Feb 1 and key support
- SUP 4: 145.59 Low Jan 16
The USDJPY trend outlook remains bullish and price is trading closer to its recent highs. The latest pause appears to be a bull flag formation. A resumption of the trend would pave the way for a climb towards 151.91/95, the Nov 13 ‘23 high and the Oct 1 ‘22 high and major resistance. On the downside, initial firm support lies at 149.41, the 20-day EMA. A break would signal scope for a correction towards 148.01, the 50-day EMA.
EURJPY TECHS: Bull Cycle Remains In Play
- RES 4: 166.46 1.236 proj of the Jan 2 - 19 - Feb 1 price swing
- RES 3: 165.00 Round number resistance
- RES 2: 164.30 High Nov 16 and a key medium-term resistance
- RES 1: 163.72 High Nov 27 and Feb 26
- PRICE: 163.26 @ 06:57 GMT Feb 27
- SUP 1: 161.51 20-day EMA
- SUP 2: 160.38 50-day EMA
- SUP 3: 158.92 Low Feb 7
- SUP 4: 158.08 Low Feb 1 and key support
EURJPY maintains a firmer tone and last week’s bullish extension, together with Monday’s climb, reinforces current conditions. Attention is on 163.72, the Nov 27 high (tested) ahead of key resistance at 164.30, the Nov 16 high. Key short-term support is unchanged at 158.08, Feb 1 low. A clear break of this level would highlight a reversal. Initial support lies at 161.51, the 20-day EMA.
AUDUSD TECHS: Remains Below Resistance
- RES 4: 0.6871 High Dec 28 and the bull trigger
- RES 3: 0.6729/71 High Jan 12 / 3
- RES 2: 0.6663 High Jan 16
- RES 1: 0.6595/6625 High Jan 30 and key resistance
- PRICE: 0.6553 @ 07:26 GMT Feb 27
- SUP 1: 0.6496/6443 Low Feb 16 / 13 and the bear trigger
- SUP 2: 0.6412 76.4% Fibonacci retracement for Oct - Dec upleg
- SUP 3: 0.6360 Low Nov 14
- SUP 4: 0.6339 Low Nov 10
Recent gains in AUDUSD still appear to be a correction and the downtrend that started Dec 28, remains intact. The pair has attempted to clear resistance around the 50-day EMA, at 0.6574. A clear break of this average is required to suggest scope for a stronger recovery. On the downside, the bear trigger lies at 0.6443, the Feb 13 low. A breach would open 0.6412, a Fibonacci retracement point.
USDCAD TECHS: Trend Structure Remains Bullish
- RES 4: 1.3729 76.4% retracement of the Nov 1 - Dec 27 bear leg
- RES 3: 1.3661 High Nov 27
- RES 2: 1.3623 61.8% retracement of the Nov 1 - Dec 27 bear leg
- RES 1: 1.3586 High Feb 13 and the bull trigger
- PRICE: 1.3495 @ 07:30 GMT Feb 27
- SUP 1: 1.3413/3359 Low Feb 09 / Jan 31 and key S/T support
- SUP 2: 1.3343 Low Jan 12
- SUP 3: 1.3288 Low Jan 5
- SUP 4: 1.3229 Low Feb 1
The USDCAD trend structure remains bullish and the recent pullback appears to be a correction. The pair recently breached resistance at 1.3544, the Feb 5 / 6 high and bull trigger. This confirms a resumption of the bull cycle that started Dec 27 and opens 1.3623, 61.8% of the Nov 1 - Dec 27 bear leg. Key support to watch lies at 1.3359, the Jan 31 low. Initial firm support has been defined at 1.3413, the Feb 9 low.
FIXED INCOME
BUND TECHS: (H4) Trend Needle Points South
- RES 4: 135.88 High Feb 2
- RES 3: 134.60 High Feb 7
- RES 2: 133.93 50-day EMA
- RES 1: 133.52 20-day EMA
- PRICE: 132.53 @ 05:16 GMT Feb 27
- SUP 1: 131.78 Low Feb 22 and the bear trigger
- SUP 2: 131.49 61.8% retracement of the Oct 4 - Dec 27 bull phase
- SUP 3: 130.47 Low Nov 24
- SUP 4: 129.76 76.4% retracement of the Oct 4 - Dec 27 bull phase
Bund futures remain in a bear mode condition and gains are considered corrective. Moving average studies have recently crossed and are in a bear-mode set-up, highlighting a downtrend. The focus is on 131.49 next, the 61.8% retracement of the Oct 4 - Dec 27 bull phase. Clearance here would strengthen a bearish theme. For bulls, a break of 136.29, the Feb 1 high, is required to signal a reversal. Initial resistance is 133.52, the 20-day EMA.
BOBL TECHS: (H4) Bear Cycle Still In Play
- RES 4: 117.880 High Feb 5
- RES 3: 117.730 High Feb 7
- RES 2: 117.336 50-day EMA
- RES 1: 116.947 20-day EMA
- PRICE: 116.140 @ 05:29 GMT Feb 27
- SUP 1: 115.920 Low Feb 23 and the bear trigger
- SUP 2: 115.739 Lower 2.0% Bollinger Band
- SUP 3: 115.820 Low Nov 24
- SUP 4: 115.650 Low Nov 14
A bearish cycle in Bobl futures remains in play and last week’s extension lower reinforces current conditions. The contract is trading closer to its recent lows. The move down confirms a resumption of the bear cycle that started Dec 27 and sights are on 115.820, the Nov 24 low. On the upside, initial firm resistance is seen at 116.947, the 20-day EMA, ahead of 117.336, the 50-day EMA. Short-term gains are considered corrective.
SCHATZ TECHS: (H4) Heading South
- RES 4: 105.751 50-day EMA
- RES 3: 105.585 High Feb 15
- RES 2: 105.513 20-day EMA
- RES 1: 105.310 High Feb 26
- PRICE: 105.120 @ 05:30 GMT Feb 27
- SUP 1: 105..075 Low Feb 23
- SUP 2: 105.000 2.236 projection of the Jan 12 - 25 - 31 price swing
- SUP 3: 104.940 2.50 projection of the Jan 12 - 25 - 31 price swing
- SUP 4: 104.880 2.618 projection of the Jan 12 - 25 - 31 price swing
The downtrend in Schatz futures remains intact and last week’s extension reinforces current conditions. The move down maintains the bearish price sequence of lower lows and lower highs and note too that moving average studies remain in a bear mode position. Short-term gains are considered corrective with firm resistance at the 20-day EMA - at 105.513. The next objective is 105.00, a Fibonacci projection.
GILT TECHS: (M4) Downtrend Intact
- RES 4: 99.42 1.236 projection of the Feb 22 - 26 price swing
- RES 3: 99.08 1.00 projection of the Feb 22 - 26 price swing
- RES 2: 98.74 0.764 projection of the Feb 22 - 26 price swing
- RES 1: 98.53 High Feb 26
- PRICE: 97.86 @ Close Feb 26
- SUP 1: 97.65 Low Feb 26
- SUP 2: 97.10 Low Feb 22
- SUP 3: 97.00 Round number support
- SUP 4: 96.67 Low Dec 5
A bear threat in Gilt futures remains present and the contract continues to trade closer to its recent lows. The recent breach of support levels strengthens a bearish theme and confirms a resumption of the downtrend. Sights are on the 96.00 handle next. On the upside, initial firm resistance is at 98.53, Monday’s high. Short-term gains would be considered corrective ahead of a resumption of weakness.
BTP TECHS: (H4) Bearish Theme
- RES 4: 121.43 High 27 and a key resistance
- RES 3: 120.40 High Dec 29
- RES 2: 119.77 High Jan 4
- RES 1: 119.27 High Jan 30 and key near-term resistance
- PRICE: 117.56 @ Close Feb 26
- SUP 1: 116.50 Low Feb 22
- SUP 2: 115.70 Low Dec 8
- SUP 3: 114.10 50.0% retracement of the Oct 19 - Dec 27 bull cycle
- SUP 4: 113.31 Low Nov 28
The trend condition in BTP futures remains bearish and short-term gains are considered corrective. Key support at 116.98, the Jan 25 low, has recently been cleared. The break signals a resumption of the bear cycle and sights are on 115.70, the Dec 8 low. Firm resistance has been defined at 119.27, the Jan 30 high. Clearance of this level could signal scope for a stronger recovery instead.
US 10YR FUTURE TECHS: (H4) Outlook Remains Bearish
- RES 4: 111-16+ High Feb 7
- RES 3: 111-07 High Feb 13
- RES 2: 110-26 50-day EMA
- RES 1: 110-16 20-day EMA
- PRICE: 109-19 @ 18:48 GMT Feb 26
- SUP 1: 109-09 Low Feb 23
- SUP 2: 109-05+ Low Nov 28
- SUP 3: 108-19+ 61.8% of the Oct 19 - Dec 27 bull phase
- SUP 4: 108-14 Low Nov 15
The trend direction in Treasuries remains down and the contract is trading closer to its recent lows. Price has pierced 109-17, 50.0% of the Oct - Dec bull cycle. A clear break of this retracement would strengthen the bearish condition and signal scope for an extension towards 108-19+, the 61.8% Fibonacci level. On the upside, initial firm resistance is seen at 110-26, the 50-day EMA.
EQUITIES
EUROSTOXX50 TECHS: (H4) Holding On To Its Recent Gains
- RES 4: 4950.50 3.0% Upper Bollinger Band
- RES 3: 4939.30 2.382 projection of the Nov 8 - 24 - 28 price swing
- RES 2: 4904.40 2.236 projection of the Nov 8 - 24 - 28 price swing
- RES 1: 4894.00 High Feb 23
- PRICE: 4863.00 @ 06:04 GMT Feb 27
- SUP 1: 4798.00/4747.70 High Feb 16 / 20-day EMA
- SUP 2: 4671.00 Low Feb 13
- SUP 3: 4633.70 50-day EMA
- SUP 4: 4596.00 Bull channel base drawn from the Oct 27 low
The bull cycle in Eurostoxx 50 futures remains firmly intact and the contract is holding on to its recent gains. Moving average studies are in a bull-mode position too, highlighting positive market sentiment. Sights are on 4904.40 next, a Fibonacci projection. Further out, scope is seen for a climb towards a bull channel top at 4968.50. The channel is drawn from the Oct 27 low. Initial firm support lies at 4747.70, the 20-day EMA.
E-MINI S&P TECHS: (H4) Bulls Remain In The Driver’s Seat
- RES 4: 5171.37 3.0% Bollinger Band
- RES 3: 5170.86 2.236 proj of Nov 10 - Dec 1 - 7 price swing
- RES 2: 5137.13 2.0% 10-dma envelope
- RES 1: 5123.50 High Feb 23 and bull trigger
- PRICE: 5077.50 @ 07:11 GMT Feb 27
- SUP 1: 5000.90 20-day EMA
- SUP 2: 4889.03/4866.000 50-day EMA / Low Jan 31 and key support
- SUP 3: 4702.00 Low Jan 5
- SUP 4: 4594.00 Low Nov 30
The trend condition in S&P E-Minis remains bullish following last week’s gains and pullbacks are considered corrective. The move higher continues to highlight the fact that corrections remain shallow - a bullish signal. Support to watch is 5000.90, the 20-day EMA. A clear break of this EMA would signal potential for a deeper retracement towards the 4866.00 key support, Jan 31 low. A resumption of gains would open vol-band based resistance at 5137.13.COMMODITIES
BRENT TECHS: (J4) Watching Resistance
- RES 4: $87.12 - High Oct 27
- RES 3: $86.03 - 76.4% retracement of the Sep 15 - Dec 13 bear cycle
- RES 2: $84.17 - High Jan 29 and key short-term resistance
- RES 1: $83.96 - High Feb 22
- PRICE: $82.70 @ 06:48 GMT Feb 27
- SUP 1: $80.61/76.62 - 50-day EMA / Low Feb 5 and key S/T support
- SUP 2: $74.82 - Low Jan 03
- SUP 3: $72.96 - Low Dec 13 and the bear trigger
- SUP 4: $70.99 - Low Jun 23 ‘23
Key short-term resistance in Brent futures at $84.17, the Jan 29 high, remains intact. A clear break of the Jan 29 high is required to cancel a bearish threat and instead highlight a stronger reversal. This would open $86.03, a Fibonacci retracement point. On the downside, the trigger for a resumption of the downtrend is $76.62, Feb 5 low. Initial pivot support to watch lies at $80.61, the 50-day EMA.
WTI TECHS: (J4) Monitoring Key Resistance
- RES 4: $85.75 - High Sep 15 and a key resistance
- RES 3: $84.66 - High Oct 20
- RES 2: $81.70 - 76.4% retracement of the Sep 19 - Dec 13 bear cycle
- RES 1: $79.09 - High Jan 29 and key resistance
- PRICE: $77.74 @ 07:03 GMT Feb 27
- SUP 1: $75.56/71.49 - 50-day EMA / Low Feb 5
- SUP 2: $69.79 - Low Jan 3
- SUP 3: $68.57 - Low Dec 13 and the bear trigger
- SUP 4: $65.41 - Low Jun 12
Recent gains in WTI futures still appear corrective at these levels and key short-term resistance at $79.09, the Jan 29 high, remains intact. Clearance of this level would alter the picture and highlight a bullish development. A break would open $81.70, a Fibonacci retracement. Support to watch lies at $71.49, the Feb 5 low. A breach of this level would reinstate the recent bearish theme and pave the way for a move towards $69.79, the Jan 3 low.
GOLD TECHS: Trading Between Its Directional Triggers
- RES 4: $2135.4 - High Dec 4 and all-time high
- RES 3: $2097.1 - 76.4% retracement of the Dec 4 - 13 bear leg
- RES 2: $2088.5 - High Dec 28
- RES 1: $2041.4/2065.5 - High Feb 23 / Feb 1 and key resistance
- PRICE: $2034.2 @ 07:07 GMT Feb 27
- SUP 1: $1984.3 - Low Feb 14
- SUP 2: $1973.2 - Low Dec 13 and key support
- SUP 3: $1931.7 - Low Nov 13
- SUP 4: $1908.3 - Low Oct 16
Recent price activity in Gold has defined key resistance at $2065.5, the Feb 1 high, and key support at $1984.3, the Feb 14 low. Both levels represent important short-term directional triggers. A clear break of the Feb 1 high would highlight a short-term reversal and open $2088.5, the Dec 28 high. For bears, clearance of $1984.3 would expose an important support and bear trigger at $1973.2, the Dec 13 low.
SILVER TECHS: Bearish Structure
- RES 4: $26.135 - High May 5 and a key resistance
- RES 3: $25.761 - High Dec 4 and key resistance
- RES 2: $24.606 - High Dec 22
- RES 1: $23.534 - High Jan 12 and a reversal trigger
- PRICE: $22.684 @ 07:53 GMT Feb 27
- SUP 1: $21.883 - Low Nov 13 and a key support
- SUP 2: $20.689 - Low Oct 3 and the bear trigger
- SUP 3: $19.904 - Low Mar 10 and a key support
- SUP 4: $19.904 - Low Mar 10 2023
A bearish theme in Silver remains intact and recent gains still appear to have been a correction. The recent breach (in January) of support at $22.510, the Dec 13 low, signals scope for $21.883, the Nov 13 low. A break of this level would further strengthen the bearish theme. Initial key resistance to watch is $23.534, the Jan 12 high. Clearance of this level would instead highlight a stronger reversal.
Why MNI
MNI is the leading provider
of intelligence and analysis on the Global Fixed Income, Foreign Exchange and Energy markets. We use an innovative combination of real-time analysis, deep fundamental research and journalism to provide unique and actionable insights for traders and investors. Our "All signal, no noise" approach drives an intelligence service that is succinct and timely, which is highly regarded by our time constrained client base.Our Head Office is in London with offices in Chicago, Washington and Beijing, as well as an on the ground presence in other major financial centres across the world.