
Why MNI
MNI is the leading provider
of intelligence and analysis on the Global Fixed Income, Foreign Exchange and Energy markets. We use an innovative combination of real-time analysis, deep fundamental research and journalism to provide unique and actionable insights for traders and investors. Our "All signal, no noise" approach drives an intelligence service that is succinct and timely, which is highly regarded by our time constrained client base.Our Head Office is in London with offices in Chicago, Washington and Beijing, as well as an on the ground presence in other major financial centres across the world.
Price Signal Summary - USDJPY Path Of Least Resistance Remains Down
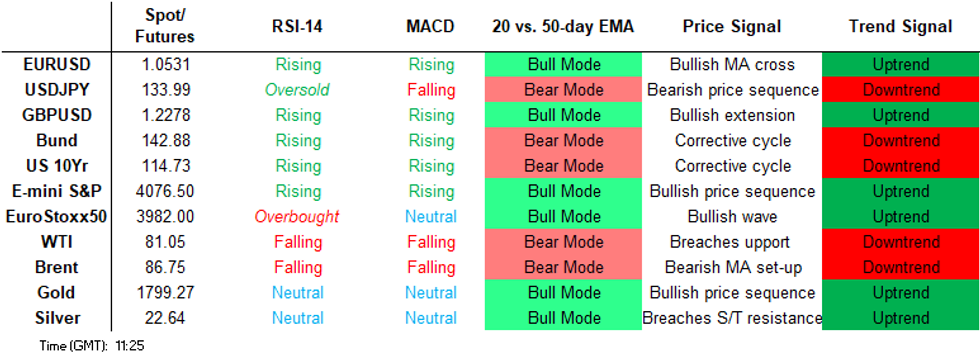
- In the equity space, S&P E-Minis remain in an uptrend and Wednesday’s gains reinforce a bullish theme. The rally resulted in a break of initial resistance at 4050.75, the Nov 15 high. This confirms a resumption of the uptrend and 4100.00 has been breached. The focus is on 4146.63, 76.4% of the Aug 16 - Oct 13 downleg On the downside, key short-term support has been defined at 3912.50, the Nov 17 low. EUROSTOXX 50 futures trend conditions remain bullish and the contract traded to a fresh cycle high Thursday. This maintains the uptrend that started in early October and confirms an extension of the price sequence of higher highs and higher lows. The 4000.00 handle has been pierced, this opens 4049.50 next, the Feb 23 high (cont). Initial firm support is at 3840, the Nov 17 low.
- In FX, EURUSD traded higher Thursday and in the process cleared Monday’s high of 1.0497. The break cancels Monday’s bearish signal - a shooting star candle pattern - and instead confirms a resumption of the current uptrend. The focus is on 1.0559, a Fibonacci projection. Key short-term support has been defined at Wednesday’s 1.0291 low. GBPUSD trend conditions remain bullish and Thursday’s gains reinforce this condition - the break higher has confirmed a resumption of the uptrend and price has cleared the 200-dma. The focus is on 1.2339,1.236 projection of the Sep 26 - Oct 5 - Oct 12 price swing. Key short-term support has been defined at 1.1901, Wednesday’s low. The USDJPY trend condition remains bearish and Thursday’s move lower confirmed a resumption of the downtrend. Today’s follow through reinforces the bear theme and maintains the bearish price sequence of lower lows and lower highs. Sights are on 132.56, Aug 15 low. Key short-term resistance to watch is 139.89, Wednesday’s high. Initial resistance is at today's intraday high of 135.60.
- On the commodity front, the trend condition in Gold is bullish and this week’s gains reinforce this condition. Yesterday’s rally resulted in a break of $1786.5, the Nov 15 high and a bull trigger, confirming a resumption of the uptrend. $1800.0 has also been cleared and sights are on resistance at $1807.9, the Aug 10 high. Key trend support has been defined at $1729.0, the Nov 23 low. In the Oil space, WTI futures are holding on to the bulk of this week’s gains. The latest bounce is considered corrective - for now. A resumption of weakness would refocus attention on Monday’s low of $73.60 where a break would confirm a resumption of bearish activity. Key resistance is at $89.35, the 50-day EMA. A break would alter the picture.
- In the FI space, Bund futures remain in a short-term uptrend. Price has cleared the 50-day EMA, highlighting a stronger short-term reversal. Resistance at 142.87, the Oct 4 high has been pierced and this opens 143.87, the Sep 14 high. The 20-day EMA marks initial firm support - it intersects at 140.20. Trend conditions in Gilt futures remain bullish. Fresh cycle highs last week maintain the bullish price sequence of higher highs and higher lows and moving averages appear to be highlighting a bull mode set-up. If confirmed this would reinforce the uptrend. The bull trigger for a continuation of gains is 107.06, the Nov 24 high. Initial firm support lies at 104.78, the Nov 23 low.
FOREIGN EXCHANGE
EURUSD TECHS: Resumes Its Uptrend
- RES 4: 1.0668 2.236 proj of the Sep 28 - Oct 4 - 13 price swing
- RES 3: 1.0615 High Jun 27
- RES 2: 1.0559 2.00 proj of the Sep 28 - Oct 4 - 13 price swing
- RES 1: 1.0545 Intraday high
- PRICE: 1.0523 @ 05:58 GMT Dec 2
- SUP 1: 1.0394/0291 Low Dec 1 / Low Nov 30
- SUP 2: 1.0223/0198 Low Nov 21 / High Sep 12
- SUP 3: 1.0132 50-day EMA
- SUP 4: 1.0094 High Oct 27 and a key near-term resistance
EURUSD traded higher Thursday and in the process cleared Monday’s high of 1.0497. The break higher cancels Monday’s bearish signal - a shooting star candle pattern - and instead confirms a resumption of the current uptrend. This also maintains the positive price sequence of higher highs and higher lows. The focus is on 1.0559, a Fibonacci projection. Key short-term support has been defined at Wednesday’s 1.0291 low.
GBPUSD TECHS: Clears The 200 DMA
- RES 4: 1.2667 High May 27
- RES 3: 1.2599 High Jun 7
- RES 2: 1.2506 1.382 proj of the Sep 26 - Oct 5 - Oct 12 price swing
- RES 1: 1.2339 1.236 proj of the Sep 26 - Oct 5 - Oct 12 price swing
- PRICE: 1.2228 @ 06:03 GMT Dec 2
- SUP 1: 1.2054/1901 Low Dec 1 / Low Nov 30
- SUP 2: 1.1869 20-day EMA
- SUP 3: 1.1683 50-day EMA
- SUP 4: 1.1500 Round number support
Trend conditions in GBPUSD remain bullish and Thursday’s gains reinforce this condition - the break higher has confirmed a resumption of the uptrend and price has cleared the 200-dma. This maintains a bullish price sequence of higher highs and higher lows and note that moving averages studies are in a bull-mode position. The focus is on 1.2339, a Fibonacci projection. Key short-term support has been defined at 1.1901, Wednesday’s low.
EURGBP TECHS: Tests Key Support
- RES 4: 0.8867 High Oct 12
- RES 3: 0.8829 High Nov 09 and the bull trigger
- RES 2: 0.8778 High Nov 16
- RES 1: 0.8675 50-day EMA
- PRICE: 0.8607 @ 06:30 GMT Dec 2
- SUP 1: 0.8547 Low Dec 1
- SUP 2: 0.8522 Low Aug 30
- SUP 3: 0.8471 Low Aug 28
- SUP 4: 0.8449 1.236 proj of the Oct 12 - 31 - Nov 9 price swing
The EURGBP outlook is unchanged and the short-term theme remains bearish. Attention is on the Oct 31 low of 0.8560 that was pierced Thursday. A clear break would strengthen a bearish theme. This would open 0.8522, the Aug 30 low. Note that moving average studies remain in a bull mode position and this does suggest that the broader uptrend remains intact. A break of 0.8560 would threaten this bullish theme. Key resistance is at 0.8829.
USDJPY TECHS: Heading South
- RES 4: 140.59 20-day EMA
- RES 2: 139.89 High Nov 30
- RES 3: 137.68 Low Nov 15 and a recent breakout level
- RES 1: 135.60 Intraday high
- PRICE: 134.07 @ 10:31 GMT Dec 2
- SUP 1: 133.63 Intraday low
- SUP 2: 132.56 Low Aug 15
- SUP 3: 131.08 1.00 proj of the Oct 31 - Nov 15 - 21 price swing
- SUP 4: 130.41 Low Aug 2
The short-term trend condition in USDJPY remains bearish and Thursday’s move lower confirmed a resumption of the downtrend. Today’s follow through reinforces the bear theme and maintains the bearish price sequence of lower lows and lower highs and sights are on 132.56, Aug 15 low. Moving average studies are in a bear mode position and this highlights current sentiment. Key short-term resistance to watch is 139.89, Wednesday’s high.
EURJPY TECHS: Bear Cycle Extends
- RES 4: 145.15 Trendline drawn from the Oct 21 high
- RES 3: 144.45 20-day EMA
- RES 2: 143.76 High Dec 1
- RES 1: 142.57 Low Nov 11 and a recent breakout point
- PRICE: 141.10 @ 10:53 GMT Dec 2
- SUP 1: 140.77 Intraday low
- SUP 2: 140.00 76.4% retracement of the Sep 26 - Oct 21 bull leg
- SUP 3: 139.44 Low Sep 29
- SUP 4: 138.06 Low Sep 28
EURJPY maintains a softer tone and price traded lower again Thursday and remains soft today. The cross has breached support at 142.57, the Nov 11 low. The clear break of this price point strengthens bearish conditions and paves the way for a move towards 140.00, a Fibonacci retracement. Key short-term resistance is at 145.15, the trendline drawn from the Oct 21 high. A break of this line is required to signal a reversal.
AUDUSD TECHS: Clears Resistance
- RES 4: 0.6976 2.00 proj of the Oct 13 - 27 - Nov 3 price swing
- RES 3: 0.6956 High Aug 30
- RES 2: 0.6909 76.4% retracement of the Aug 11 - Oct 13 downleg
- RES 1: 0.6845 High Dec 1
- PRICE: 0.6822 @ 06:52 GMT Dec 2
- SUP 1: 0.6782/6641 Low Dec 1 / Low Nov 29
- SUP 2: 0.6606/6585 50-day EMA / Low Nov 21
- SUP 3: 0.6387 Low Nov 10
- SUP 4: 0.6272 Low Nov 3 and a key support
The AUDUSD trend condition is bullish. Firm support to watch lies at 0.6606, the 50-day EMA. A clear break of this average would be seen as a bearish development and signal scope for a deeper retracement instead. On the upside, Wednesday’s gains and Thursday’s follow through have resulted in a break of 0.6797, the Nov 15 high. This confirms a resumption of the uptrend and opens 0.6909, a Fibonacci retracement.
USDCAD TECHS: Remains Below Trendline Resistance
- RES 4: 1.3855 High Oct 21
- RES 3: 1.3808 High Nov 3 and a key resistance
- RES 2: 1.3571 High Nov 10
- RES 1: 1.3646 High Nov 29
- PRICE: 1.3430 @ 06:54 GMT Dec 2
- SUP 1: 1.3383 Low Nov 28
- SUP 2: 1.3317/3226 Low Nov 24/25 / Low Nov 15 and bear trigger
- SUP 3: 1.3205 61.8% retracement of the Aug 11 - Oct 13 rally
- SUP 4: 1.3139 Low Sep 14
USDCAD has failed to confirm a clear break of trendline resistance drawn from the Oct-13 high. The trendline intersects at 1.3571. The reversal lower Wednesday, signals potential for a deeper pullback and this has opened support at 1.3317, the Nov 24/25 low. A breach of this support would expose 1.3226, the Nov 15 low and a bear trigger. Key resistance is at 1.3646, the Nov 29 high. A break is required to reinstate a bullish theme.
FIXED INCOME
BUND TECHS: (Z2) Trend Needle Points North
- RES 4: 144.29 1.236 proj of the Oct 21 - 28 - Nov 8 price swing
- RES 3: 144.00 Round number resistance
- RES 2: 143.87 High Sep 14
- RES 1: 143.05 Intraday high
- PRICE: 143.01 @ 10:41 GMT Dec 2
- SUP 1: 140.20/139.17 20-day EMA / Low Nov 14
- SUP 2: 138.26 Low Nov 18
- SUP 3: 136.92 Low Nov 9
- SUP 4: 135.76/65 Low Nov 8 / 76.4% of the Oct 21 - 28 bull phase
Bund futures remain in an uptrend and the contract is trading above support. Resistance at 142.60, the Nov 24 high, has been pierced. The break confirms a resumption of the current uptrend. Price has recently traded above the 50-day EMA at 140.30. The clear break of this EMA highlights a stronger reversal. Potential is seen for a climb to 143.87, the Sep 14 high. The 20-day EMA marks initial firm support - it intersects at 140.20.
BOBL TECHS: (Z2) Clears The 50-Day EMA
- RES 4: 122.510 High Sep 12
- RES 3: 121.950 High Oct 4 and a reversal trigger
- RES 2: 121.330 High Oct 5
- RES 1: 121.250 Intraday high
- PRICE: 121.230 @ 10:43 GMT Dec 2
- SUP 1: 119.900/390 20-day EMA / Low Nov 28 and a key S/T support
- SUP 2: 119.180 Low Nov 14
- SUP 3: 118.710 Low Nov 9
- SUP 4: 118.260 Low Nov 8 and a key support
Bobl futures have recently breached resistance at 120.530, the Nov 10 high. The outlook is bullish and note that the 50-day EMA, at 120.180, has also been cleared. The break of this average strengthens bullish conditions. 121.010, the Oct 28 high, has been cleared and this opens 121.950 further out, the Oct 4 high. On the downside, key short-term support has been defined at 119.390, the Nov 28 low.
SCHATZ TECHS: (Z2) Breaches The 50-Day EMA
- RES 4: 108.00 Round number resistance
- RES 3: 107.610 High Oct 5
- RES 2: 107.400 High Oct 28 and key resistance
- RES 1: 107.165 High Nov 1
- PRICE: 107.150 @ 10:49 GMT Dec 2
- SUP 1: 106.819 20-day EMA
- SUP 2: 106.615/415 Low Nov 10 / 8
- SUP 3: 106.350 Low Oct 21 and the bear trigger
- SUP 4: 106.270 2.50 proj of the Aug 25 - Sep 1 - Sep 6 price swing
Schatz futures traded higher Thursday and price remains above support at the Nov 10 low of 106.615. The contract has breached the 50-day EMA which intersects at 107.044. Clearance of this average signals scope for a stronger short-term recovery and opens 107.400, the Oct 28 high. Key support lies at 106.415, the Nov 8 low and 106.350, the Oct 21 low. The latter is the bear trigger. Initial support is at 106.819, the 20-day EMA.
GILT TECHS: (H3) Bullish Outlook
- RES 4: 109.47 High Aug 31 (cont)
- RES 3: 108.00 Round number resistance
- RES 2: 107.06 High Nov 24 and the bull trigger
- RES 1: 106.33 High Nov 28
- PRICE: 105.54 @ Close Dec 2
- SUP 1: 104.78 Low Nov 23
- SUP 2: 103.54 Low Nov 21 and key near-term support
- SUP 3: 103.00 Round number support
- SUP 4: 102.77 Low Nov 10 (cont)
Trend conditions in Gilt futures remain bullish and last week’s gains reinforced this condition. Fresh cycle highs maintain the current price sequence of higher highs and higher lows and moving averages appear to be highlighting a bull mode set-up - if confirmed this would reinforce the uptrend. The focus is on a climb to 109.47 next, the Aug 31 low on the continuation chart. Initial firm support lies at 103.54, the Nov 21 low.
BTP TECHS: (Z2) Trend Signals Remain Bullish
- RES 4: 124.35 76.4% retracement of the Aug 11 - Sep 28 bear leg
- RES 3: 123.71 123.6 proj of the Oct 21 - 27 - Nov 8 price swing
- RES 2: 122.00 Round number resistance
- RES 1: 121.81 Intraday high
- PRICE: 121.17 @ Close Dec 2
- SUP 1: 118.31/118.21 Low Nov 23 / 20-day EMA
- SUP 2: 116.79 50-day EMA
- SUP 3: 115.58 Low Nov 14
- SUP 4: 114.68 Low Nov 10
BTP futures trend signals remain bullish and the latest pullback appears corrective. The contract traded to fresh short-term cycle highs last week, confirming a resumption of the uptrend. This maintains the bullish price sequence of higher highs and higher lows. Price has also traded above the 120.00 handle, a clear break of it would reinforce current conditions. The focus is on 122.00 next. Initial firm support is at 118.21, the 20-day EMA.
US 10YR FUTURE TECHS: (H3) Bull Cycle Extends
- RES 4: 115-26 2.00 proj of the Oct 21 - 27 - Nov 3 price swing
- RES 3: 115-03 1.764 proj of the Oct 21 - 27 - Nov 3 price swing
- RES 2: 115-00 High Sep 19
- RES 1: 114-20+ 1.764 proj of the Oct 21 - 27 - Nov 3 price swing
- PRICE: 114-17+ @ 19:32 GMT Dec 1
- SUP 1: 112-24+ 50-day EMA
- SUP 2: 112-11+ Low Nov 21 and a key short-term support
- SUP 3: 112-05+ Low Nov 14
- SUP 4: 110-22 Low Nov 10
Treasury futures trend conditions remain bullish and today’s gains reinforce this theme. The contract has cleared resistance at 114-04, the Oct 4 high. The clear break of this hurdle strengthens bullish conditions and marks an extension of the positive price sequence of higher highs and higher lows. This opens 115-00, the Sep 19 high. Key trend support to watch is at 112-11+, the Nov 21 low.
EQUITIES
EUROSTOXX50 TECHS: (Z2) Uptrend Remains Intact
- RES 4: 4250.00 High Feb 2 (cont)
- RES 3: 4230.50 High Feb 10 (cont)
- RES 2: 4132.60 76.4/% of the Nov ‘21 - Mar ‘22 bear leg (cont)
- RES 1: 4049.50 High Feb 23 (cont)
- PRICE: 3969.00 @ 05:52 GMT Dec 2
- SUP 1: 3921.00/3840.00 Low Nov 29 / 17
- SUP 2: 3810.00/3697.00 High Aug 17 / Low Nov 10
- SUP 3: 3723.50 50-day EMA
- SUP 4: 3562.00 Low Nov 3
EUROSTOXX 50 futures trend conditions remain bullish and the contract traded to a fresh cycle high Thursday. This maintains the uptrend that started in early October and confirms an extension of the price sequence of higher highs and higher lows. The recent break of 3810.00, Aug 17 high, also strengthens the case for bulls. 4000.00 has been pierced, this opens 4049.50 next, Feb 23 high (cont). Initial firm support is 3840, Nov 17 low.
E-MINI S&P (Z2): Uptrend Remains Intact
- RES 4: 4234.25 High Aug 26
- RES 3: 4175.00 High Sep 13 and a key resistance
- RES 2: 4146.63 76.4% retracement of the Aug 16 - Oct 13 downleg
- RES 1: 4110.00 High Dec 1
- PRICE: 4075.25 @ 06:49 GMT Dec 2
- SUP 1: 3959.04 20-day EMA
- SUP 2: 3912.50/3904.81 Low Nov 17 / 50-day EMA values
- SUP 3: 3750.00 Low Nov 9
- SUP 4: 3704.25 Low Nov 3 and key short-term support
S&P E-Minis remain in an uptrend and Thursday’s gains reinforce a bullish theme. Gains this week have resulted in a break of resistance at 4050.75, the Nov 15 high. This confirms a resumption of the uptrend and marks an extension of the price sequence of higher highs and higher lows. Sights are on 4146.63, a Fibonacci retracement. On the downside, key short-term support has been defined at 3912.50, the Nov 17 low.
COMMODITIES
BRENT TECHS: (G3) Watching Resistance At The 50-Day EMA
- RES 4: $97.85 - High Nov 7 and a key resistance
- RES 3: $95.38 - High Nov 14
- RES 2: $91.63 - High Nov 17
- RES 1: $89.35/37 - 50-day EMA / High Dec 1
- PRICE: $86.73 @ 07:10 GMT Dec 1
- SUP 1: $84.45/80.81 - Low Nov 30 / 28
- SUP 2: $79.68 - Low Sep 26 and the bear trigger
- SUP 3: $77.04 - Low Jan 1 (cont)
- SUP 4: $75.75 - Low Dec 27 2021 (cont)
The trend condition in Brent futures remains bearish despite this week’s recovery - gains are considered corrective. Price has recently pierced support at $82.30, the Nov 21 low. A clear breach of this level would expose key support and the bear trigger at $79.68, the Sep 26 low. Moving averages are in a bear mode position, highlighting bearish sentiment. Resistance is at $89.35, the 50-day EMA. A clear break would alter the picture.
WTI TECHS: (F3) Remains Below Key Resistance
- RES 4: $92.53 - High Nov 7 and key resistance
- RES 3: $89.20 - High Nov 11
- RES 2: $86.90 - High Nov 16
- RES 1: $83.81 - 50-day EMA
- PRICE: $80.90 @ 07:13 GMT Dec 2
- SUP 1: $78.40 - Low Nov 30
- SUP 2: $73.38 - 1.00 proj of the Aug 30 - Sep 28 - Nov 7 price swing
- SUP 3: $70.00 - Round number support
- SUP 4: $68.86 - 1.236 proj of the Aug 30 - Sep 28 - Nov 7 price swing
Trend conditions in WTI futures remain bearish and this week’s gains are still considered corrective. Monday’s move lower resulted in a break of $74.96, Sep 28 low. This confirmed a resumption of the downtrend and has opened $73.38, a Fibonacci projection and the $70.00 psychological handle. MA studies are in a bear mode condition, highlighting the current trend direction. Resistance is at $83.81, the 50-day EMA. A break would alter the picture.
GOLD TECHS: Bull Trend Resumes
- RES 4: $1909.8 - High May 5
- RES 3: $1842.7 - 50.0% retracement of the Mar - Sep bear leg
- RES 2: $1833.0 - High Jun 29
- RES 1: $1807.9 - High Aug 10 and a key resistance
- PRICE: $1799.4 @ 07:17 GMT Dec 2
- SUP 1: $1742.1 - 20-day EMA
- SUP 2: $1729.0 - Low Nov 23 and key short-term support
- SUP 3: $1702.3 - Low Nov 9
- SUP 4: $1664.8 - Low Sep 8
Short-term trend conditions in Gold remain bullish and this week’s gains reinforce this condition. Yesterday’s rally resulted in a break of $1786.5, the Nov 15 high and a bull trigger, confirming a resumption of the uptrend. $1800.0 has also been cleared and sights are on resistance at $1807.9, the Aug 10 high. On the downside, key trend support has been defined at $1729.0, the Nov 23 low.
SILVER TECHS: Has Cleared Resistance
- RES 4: $23.567 - High Apr 29
- RES 3: $23.360 - 61.8% retracement of the Mar - Sep bear leg
- RES 2: $23.000 - Round number resistance
- RES 1: $22.913 - Intraday high
- PRICE: $22.727 @ 08:04 GMT Dec 2
- SUP 1: $21.245/20.585 - 20-day EMA / Low Nov 21 and key support
- SUP 2: $20.515 - 50-day EMA
- SUP 3: $19.416 - Low Nov 4
- SUP 4: $18.835 - Low Nov 3
The trend outlook in Silver remains bullish and the metal has traded higher to clear resistance at $22.251, the Nov 15 high. A continuation would reinforce bullish conditions and highlight an extension of the positive price sequence of higher highs and higher lows. This would open $23.00 and $23.360, a Fibonacci retracement. Key short-term trend support has been defined at $20.585, the Nov 21 low.
Why MNI
MNI is the leading provider
of intelligence and analysis on the Global Fixed Income, Foreign Exchange and Energy markets. We use an innovative combination of real-time analysis, deep fundamental research and journalism to provide unique and actionable insights for traders and investors. Our "All signal, no noise" approach drives an intelligence service that is succinct and timely, which is highly regarded by our time constrained client base.Our Head Office is in London with offices in Chicago, Washington and Beijing, as well as an on the ground presence in other major financial centres across the world.