
Why MNI
MNI is the leading provider
of intelligence and analysis on the Global Fixed Income, Foreign Exchange and Energy markets. We use an innovative combination of real-time analysis, deep fundamental research and journalism to provide unique and actionable insights for traders and investors. Our "All signal, no noise" approach drives an intelligence service that is succinct and timely, which is highly regarded by our time constrained client base.Our Head Office is in London with offices in Chicago, Washington and Beijing, as well as an on the ground presence in other major financial centres across the world.
FOREX: USD & JPY Firm Up, Trump-Biden Debate Fails To Impress
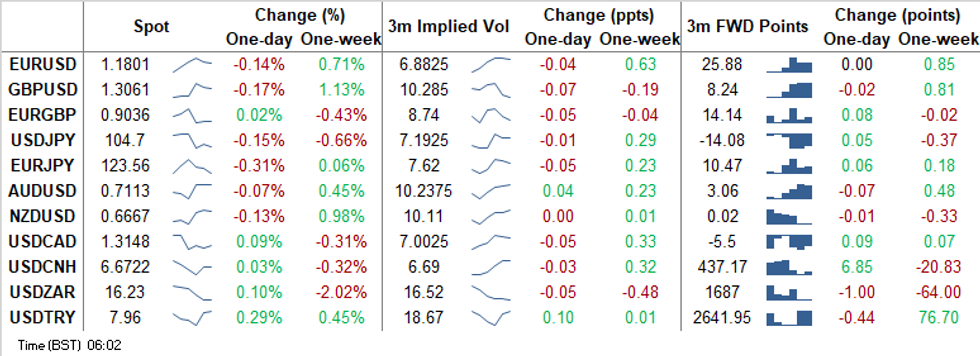
USD & JPY went bid in a relatively slow Asia-Pac session, which saw little in the way of market-moving catalysts. The final Trump-Biden debate was less chaotic than their earlier face-off, but provided nothing to alter the trajectory of the ongoing campaign. BBG trader sources flagged that USD & JPY were bought against EUR & GBP on above average turnover. EUR/JPY had a look under its 100-DMA, but failed to consolidate below the level.
- NZD was sold in reaction to a miss in New Zealand's CPI vs. both market & RBNZ expectations. That being said, price reaction was relatively limited, with participants already expecting further easing from the RBNZ.
- USD/CNH continued to tick away from cycle lows, with State Administration of Foreign Exchange (SAFE) confirming earlier reports that it wants to implement a phased increase in QDII quotas. SAFE also judged that the yuan has been more stable than exp. & its appreciation this year was driven by fundamentals.
- USD/KRW pushed higher initially, amid lingering concerns over a continued increase in South Korea's daily Covid-19 case count, which rose further above 100. The rate gradually trimmed gains and still trades within touching distance from its 19-month low.
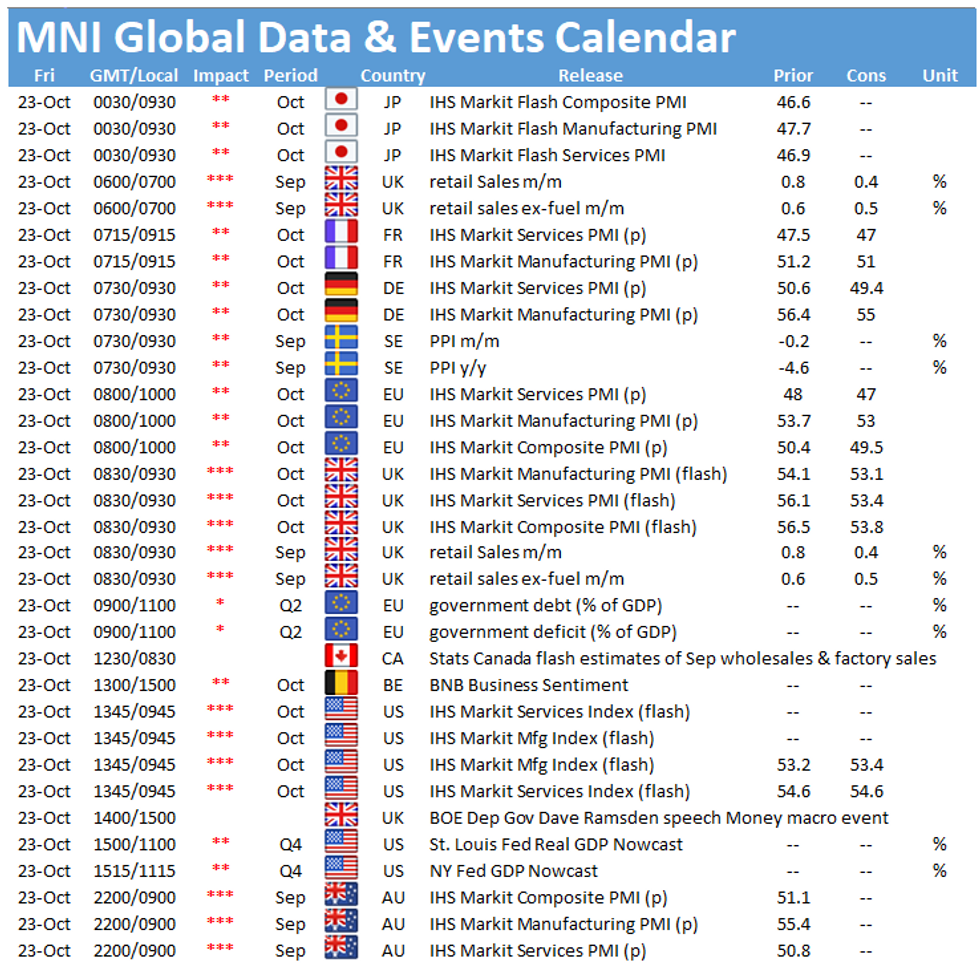
- A flurry of PMI data from across the globe, UK retail sales and a speech from BoE's Ramsden feature on today's economic docket.
MNI FX TECHNICALS:
EUR/USD: Pullback Considered Corrective
- RES 4: 1.2011 High Sep and key resistance
- RES 3: 1.1917 76.4% retracement of the Sep 1 - 25 sell-off
- RES 2: 1.1901 1.0% 10-dma envelope
- RES 1: 1.1881 High Oct 21
- PRICE: 1.1799 @ 05:47 BST Oct 23
- SUP 1: 1.1760 Low Oct 20
- SUP 2: 1.1739 50-day EMA
- SUP 3: 1.1723 Trendline support drawn off the Sep 28 low
- SUP 4: 1.1689 Low Oct 15 and a key support
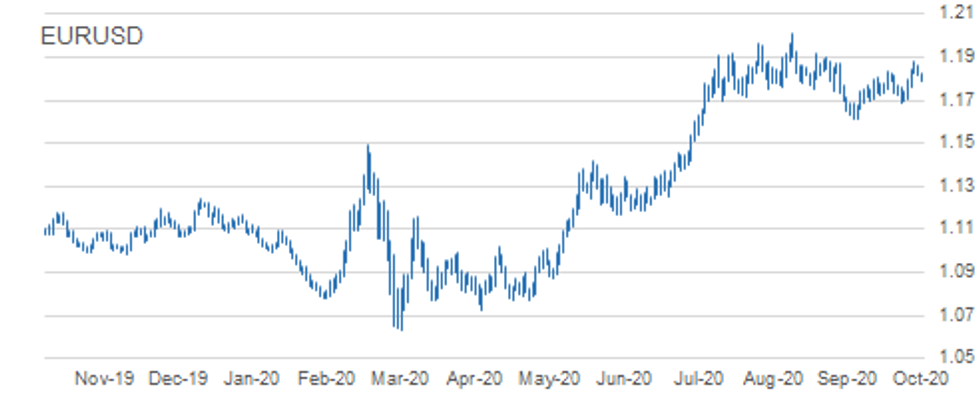
EURUSD is off recent highs however despite the pullback, maintains a positive tone. This week's bullish theme has been reinforced by the break of the former bull trigger at 1.1831, Oct 9 high. The breach signals scope for an extension towards 1.1917 next, a Fibonacci retracement level with the major resistance and hurdle for bulls at 1.2011, Sep 1 high. On the downside, initial firm support lies at 1.1760, Tuesday's low.
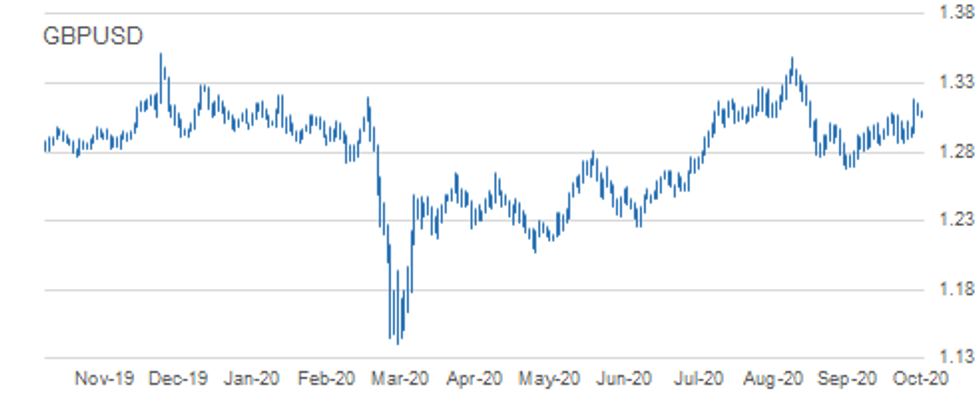
GBP/USD: Corrective Pullback
- RES 4: 1.3292 76.4% retracement of the Sep 1 - 23 sell-off
- RES 3: 1.3260 2.0% 10-dma envelope
- RES 2: 1.3233 Former trendline support drawn off the Mar 20 low
- RES 1: 1.3177 High Oct 21
- PRICE: 1.3062 @ 05:58 BST Oct 23
- SUP 1: 1.3025 High Oct 19
- SUP 2: 1.2940 Low Oct 21
- SUP 3: 1.2863 Low Oct 14 and key near-term support
- SUP 4: 1.2806 Low Sep 30
EUR/GBP: Focus Is On Key Support
- RES 4: 0.9162 High Oct 7
- RES 3: 0.9155 1.0% 10-dma envelope
- RES 2: 0.9149 Oct 20 high
- RES 1: 0.90783 20-day EMA
- PRICE: 0.9036 @ 06:01 BST Oct 23
- SUP 1: 0.9012 Low Oct 21
- SUP 2: 0.9007 Low Oct 14 and the bear trigger
- SUP 3: 0.8967 76.4% retracement of the Sep 3 - 11 rally
- SUP 4: 0.8925 Low Sep 7
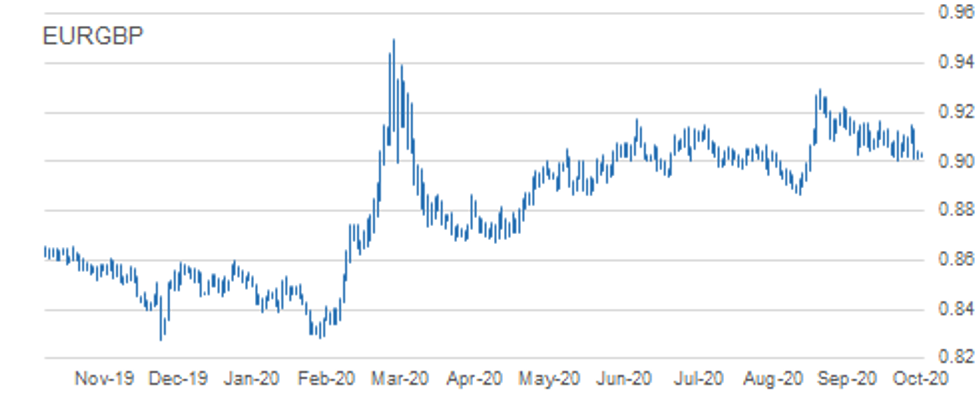
EURGBP remains vulnerable following Wednesday's sharp move lower. The cross has moved below the 50-day EMA once again and attention is on support at 0.9007, Oct 14 low and the near-term bear trigger. A break of 0.9007 would confirm a resumption of the downtrend that started Sep11 and open 0.8967, a retracement point. Key resistance has been defined at 0.9149, Tuesday's high. The outlook is bearish below this level.
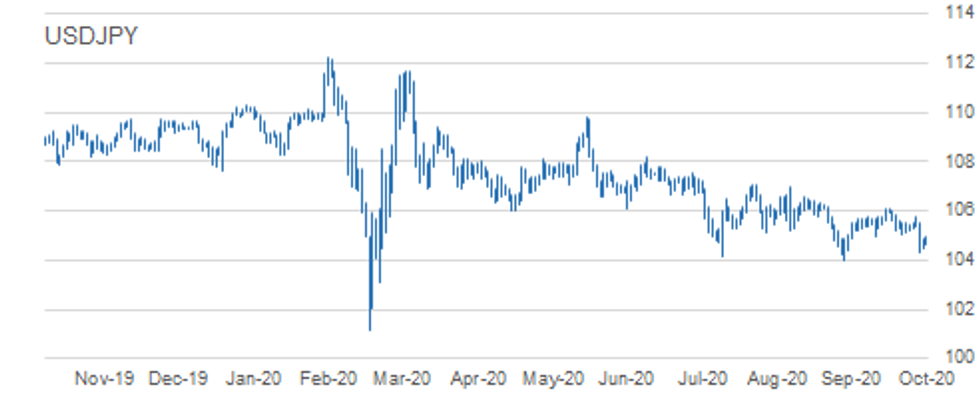
USD/JPY: Vulnerable
- RES 4: 106.11 High Oct 7 and key resistance
- RES 3: 105.75 High Oct 20
- RES 2: 105.53/65 High Oct 21 / 50-dma
- RES 1: 105.04 Low Oct 4 and a recent breakout level
- PRICE: 104.71 @ 06:08 BST Oct 23
- SUP 1: 104.34 Low Oct 21
- SUP 2: 104.00 Low Sep 21 and the bear trigger
- SUP 3: 103.67 76.4% retracement of the Mar 9 - 24 rally
- SUP 4: 103.09 Low Mar 12
USDJPY maintains a weaker outlook following the Wednesday sell-off and the confirmation of a resumption of the downleg from 106.11, Oct 7 high. A number of important supports have been cleared this week signalling scope for a deeper pullback towards the key 104.00 handle, Sep 21 low. A break of 104.00 would signal scope for further USD depreciation within the bear channel drawn off the Mar 24 high. Initial resistance is at 105.04.
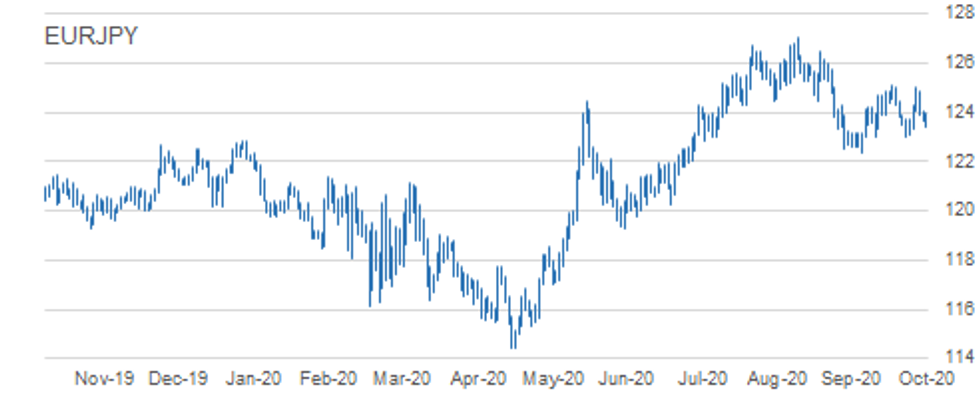
EUR/JPY: Edges Lower
- RES 4: 125.97 76.4% retracement of the Sep 1 - 28 sell-off
- RES 3: 125.28 61.8% of the Sep 1 - 28 sell-off
- RES 2: 125.00/09 High Oct 20 and Oct 9
- RES 1: 124.09 Oct 22 high
- PRICE: 123.59 @ 06:20 BST Oct 23
- SUP 1: 123415 Intraday low
- SUP 2: 123.03/02 Low Sep 29 and Oct 2 / Low Oct 15
- SUP 3: 122.38/28 Low Sep 28 / 61.8% of the Jun 22 - Sep 1 rally
- SUP 4: 122.25 38.2% retracement of the May - Sep rally
EURJPY continues to weaken, extending this week's correction. Attention turns to support at 123.03/02, low prints between Sep 29 and Oct 15. Low. A break of this level would undermine the recent bullish outlook and instead highlight risk for a deeper sell-off towards 122.38, Sep 28 low and the bear trigger. Moving average studies are in a neutral position. To strengthen a bullish argument, price needs to clear key resistance at 125.09, Oct9 high.
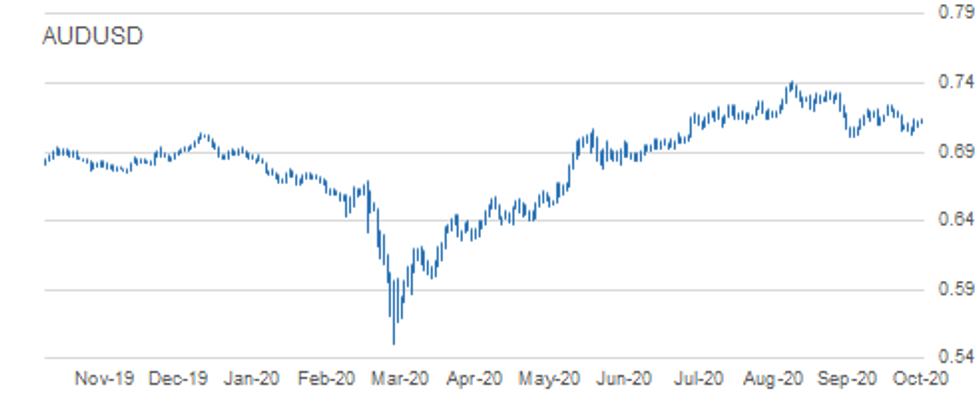
AUD/USD: Bearish Below Trendline Resistance
- RES 4: 0.7243 High Oct 10 and the intraday bull trigger
- RES 3: 0.7176 Trendline resistance drawn off the Sep 1 high
- RES 2: 0.7170 High Oct 15
- RES 1: 0.7139 Intraday high
- PRICE: 0.7107 @ 06:26 BST Oct 23
- SUP 1: 0.7021 Low Oct 20
- SUP 2: 0.7006 Low Sep 25 and the bear trigger
- SUP 3: 0.6965 23.6% retracement of the Mar - Sep rally
- SUP 4: 0.6931 0.764 projection of Sep 1 - 25 sell-off from Oct 9 high
AUDUSD remains vulnerable despite the recent recovery. The pair continues to trade below trendline resistance drawn off the Sep 1 high. The line intersects at 0.7176 and the recent failure at the trendline highlights the bearish risk. Attention is on the primary support and bear trigger at 0.7006, Sep 25 low. A trendline resistance break is needed to alter the picture and signal a stronger reversal.
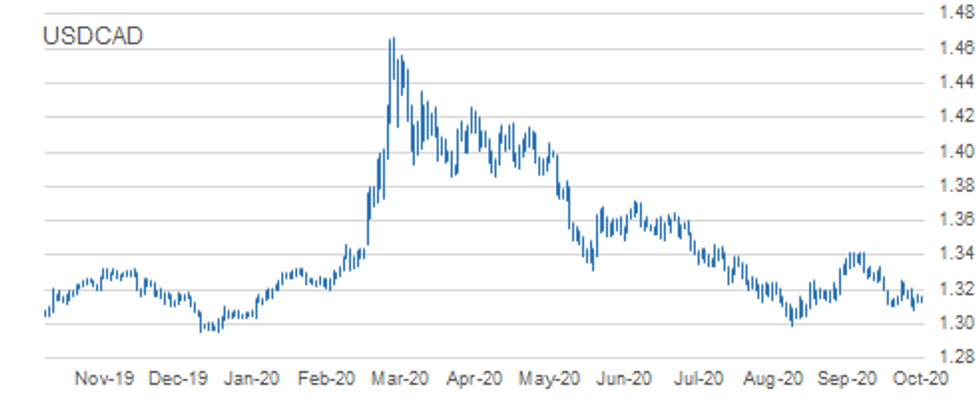
USD/CAD: Bearish Conditions Dominate
- RES 4: 1.3421 High Sep 30 and primary resistance
- RES 3: 1.3341 High Oct 7
- RES 2: 1.3246/59 50-day EMA / High Oct 15 and the bull trigger
- RES 1: 1. 3197 20-day EMA
- PRICE: 1.3151 @ 06:30 BST Oct 23
- SUP 1: 1.3081 Low Oct 21 and the intraday bear trigger
- SUP 2: 1.3047 Low Sep 7
- SUP 3: 1.3038 Low Sep 2
- SUP 4: 1.2994 Low Sep 1 and the major support
USDCAD bearish conditions dominate despite the most recent bounce. The pair weakened through key support at 1.3099 this week, Oct 13 low. The move lower confirms a resumption of the current downtrend that started Sep 30. Moving average studies are bearish too, reinforcing the current climate. Scope exists for a move towards the major support at 1.2994, Sep 1 low. Key resistance has been defined at 1.3259, Oct 15 high.
MNI KEY LEVELS:
EUR/USD: MNI Key Levels
- $1.1966 Aug18 high
- $1.1917/29 Sep10 high/Sep02 high
- $1.1897/00/08 Upper 1.0% 10-dma env/Sep15 high/Upper Boll Band (3%)
- $1.1867/81/82 Oct22 high/Oct21 high/Sep16 high
- $1.1851/57/60 Cloud top/100-mma/Upper Boll Band (2%)
- $1.1812/22/24 100-hma/Oct21 low/Intraday high
- $1.1796/97 55-dma/50-dma
- $1.1798 ***CURRENT MARKET PRICE 05:31BST FRIDAY***
- $1.1787/85/74 Intraday low/50% 1.1689-1.1881/200-hma
- $1.1762/60/57 61.8% 1.1689-1.1881/Oct20 low/21-dma
- $1.1747/34 50% 1.1612-1.1881/76.4% 1.1689-1.1881
- $1.1703/94/89 Oct19 low/Oct16 low/Oct15 low
- $1.1685 Sep30 low, Sep25 high
- $1.1666/62 Lower Boll Band (2%)/Lower 1.0% 10-dma env
- $1.1661 Sep29 low
GBP/USD: MNI Key Levels
- $1.3263 Upper 2.0% 10-dma envelope
- $1.3206 Upper Bollinger Band (3%)
- $1.3177 Oct21 high
- $1.3153 Oct22 high
- $1.3124/33 Upper Boll Band (2%)/Upper 1.0% 10-dma env
- $1.3094 Intraday high
- $1.3072 Cloud top
- $1.3061 ***CURRENT MARKET PRICE 05:33BST FRIDAY***
- $1.3057 Intraday low
- $1.3027/25/19 100-hma/Oct19 high/55-dma
- $1.3014 50-dma
- $1.2992 200-hma
- $1.2981/79 Cloud base/Oct20 high
- $1.2953/51/47 50-mma/21-dma/200-wma
- $1.2940 Oct21 low
EUR/GBP: MNI Key Levels
- Gbp0.9220 Sep22 high
- Gbp0.9176/81 Upper Boll Band (3%)/Sep24 high
- Gbp0.9151/57/62 Upper 1.0% 10-dma env/Sep30 high/Oct07 high
- Gbp0.9137/42/49 Oct21 high/Upper Boll Band (2%)/Oct20 high
- Gbp0.9079/80/94 21-dma, Cloud base/Oct20 low/Cloud top
- Gbp0.9062/65/68 55-dma, 200-hma/50-dma/100-hma
- Gbp0.9039/46 Intraday high/Oct22 high, 100-dma
- Gbp0.9035 ***CURRENT MARKET PRICE 05:38BST FRIDAY***
- Gbp0.9021/15/12 Intraday low/Oct22 low/Oct21 low
- Gbp0.9010/07 Lower Boll Band (2%)/Oct14 low
- Gbp0.8977/70 Lower Boll Band (3%)/Lower 1.0% 10-dma env
- Gbp0.8967 Sep08 low
- Gbp0.8925 Sep07 low
- Gbp0.8900/90 Sep04 low/200-dma
- Gbp0.8880/66 Lower 2.0% 10-dma env/Sep03 low
USD/JPY: MNI Key Levels
- Y105.61/62 50-dma/Cloud base
- Y105.53 Oct21 high
- Y105.41/43 76.4% 105.75-104.34/21-dma
- Y105.21/23 61.8% 105.75-104.34/200-hma
- Y105.11 100-hma
- Y105.04/05/06 Oct14 low, 50% 105.75-104.34/Cloud Tenkan Sen/Cloud Kijun Sen
- Y104.94 Intraday high
- Y104.70 ***CURRENT MARKET PRICE 05:42BST FRIDAY***
- Y104.68/67 Lower Boll Band (2%)/Intraday low
- Y104.48 Oct22 low
- Y104.34/31 Oct21 low/Lower Bollinger Band (3%)
- Y104.14/00 Lower 1.0% 10-dma env/Sep21 low
- Y103.94 200-mma
- Y103.09 Lower 2.0% 10-dma env, YTD Mar12 low
- Y102.04/02 Lower 3.0% 10-dma env/Mar10 low
EUR/JPY: MNI Key Levels
- Y124.16 100-hma
- Y124.09 Oct22 high
- Y124.02 Intraday high
- Y124.01 Cloud Tenkan Sen
- Y123.95 21-dma
- Y123.90 200-hma
- Y123.68/74 Cloud base/Cloud Kijun Sen
- Y123.57 ***CURRENT MARKET PRICE 05:52BST FRIDAY***
- Y123.53/41 100-dma/Intraday low
- Y123.37 Oct19 low
- Y123.12 Oct16 low
- Y123.03 Oct02 low, Sep29 low
- Y123.02 Oct15 low
- Y122.96 Lower Bollinger Band (2%)
- Y122.67 Lower 1.0% 10-dma envelope
AUD/USD: MNI Key Levels
- $0.7244/54 200-wma/Sep17 low
- $0.7235/43 Upper Boll Band (2%), Sep22 high, Oct12 high/Oct09 high
- $0.7218 Oct13 high
- $0.7198 50-dma
- $0.7189/91/94 Upper 1.0% 10-dma env/Oct14 high/55-dma
- $0.7168/70/82 Cloud base/Oct15 high/Falling Trend Sep1
- $0.7131/39 21-dma/Intraday high
- $0.7113 ***CURRENT MARKET PRICE 05:56BST FRIDAY***
- $0.7108/07 Intraday low/200-hma, 100-dma
- $0.7087/85 100-hma/Oct22 low
- $0.7047/36 Oct21 low, Lower 1.0% 10-dma env/Lower Boll Band (2%)
- $0.7021/06 Oct20 low/Sep25 low
- $0.6986/75 Lower Boll Band (3%)/Lower 2.0% 10-dma env
- $0.6973/63 Jul20 low/Jul16 low
- $0.6921 Jul14 low
USD/CAD: MNI Key Levels
- C$1.3320 Cloud top
- C$1.3288 Upper 1.0% 10-dma envelope
- C$1.3259/73 Oct15 high/Oct08 high
- C$1.3227/38 21-dma/Oct16 high
- C$1.3199/04/06 50-dma/Oct20 high/55-dma
- C$1.3175/78 50-mma/Oct22 high
- C$1.3150/58/60 100-hma/Intraday high/200-wma, 200-hma
- C$1.3148 ***CURRENT MARKET PRICE 06:01BST FRIDAY***
- C$1.3143 Cloud base
- C$1.3124 Oct22 low, Intraday low
- C$1.3081 Oct21 low
- C$1.3044/38 Lower Boll Band (2%)/Sep02 low
- C$1.3024 Lower 1.0% 10-dma envelope
- C$1.2994 Sep01 low
- C$1.2976/69 Jan08 low/YTD Jan02 low
OPTIONS: Expiries for Oct23 NY cut 1000ET (Source DTCC)
- EUR/USD: $1.1750-55(E1.3bln), $1.1800(E2.0bln), $1.1830-50(E2.0bln), $1.1975(E518mln), $1.2000(E1.4bln)
- USD/JPY: Y103.00($1.3bln), Y105.00($751mln), Y105.40-60($1.2bln), Y105.85($628mln)
- GBP/USD: $1.3090-1.3100(Gbp1.1bln-GBP calls)
- AUD/USD: $0.7180(A$827mln)
- USD/CAD: C$1.3080($936mln), C$1.3190-00($576mln)
Larger Option Pipeline
- EUR/USD: Oct26 $1.1500(E1.8bln), $1.1650-60(E1.6bln), $1.1830-45(E1.1bln); Oct28 $1.1745-60(E1.1bln),
$1.1800-05(E1.5bln), $1.2000-05(E2.9bln); Oct30 $1.1800(E1.1bln), $1.1850(E1.2bln), $1.1950(E1.7bln-EUR calls), $1.2000(E1.1bln); Nov03 $1.1900-05(E1.1bln) - USD/JPY: Oct26 Y103.95-104.00($2.5bln-USD puts), Y105.30-40($1.7bln), Y105.60-75($1.2bln),
Y106.95-107.00($1.6bln); Oct27 Y105.00($1.3bln), Y106.00-05($1.2bln); Oct28 Y104.85-90($1.2bln), Y105.00($1.5bln); Oct29 Y103.20-25($1.6bln), Y104.00($1.6bln), Y105.25($1.3bln), Y105.55-65($2.2bln), Y106.00($1.2bln); Oct30 Y104.50($1.9bln), Y104.80-85($1.1bln), Y106.00-05($2.2bln); Nov03 Y105.45-49($1.3bln); Nov04 Y105.00($1.1bln); Nov05 Y106.06-09($1.6bln) - EUR/JPY: Oct26 Y122.80(E1.2bln); Nov05 Y124.50(E1.0bln)
- EUR/GBP: Oct26 Gbp0.8900(E880mln), Gbp0.9000(E2.1bln-EUR puts); Nov02 Gbp0.8900(E1.6bln-EUR puts)
- AUD/USD: Oct27 $0.6680(A$1.1bln); Nov02 $0.7140-45(A$1.5bln)
- AUD/JPY: Oct29 Y73.20(A$1.0bln-AUD puts), Y76.35-40(A$2.4bln-AUD calls)
- AUD/NZD: Oct27 N$1.0809-20(A$2.5bln); Oct30 N$1.0750(A$1.2bln)
- USD/CNY: Nov03 Cny6.5334($1.1bln); Nov05 Cny6.75($1.0bln), Cny6.80($1.9bln), Cny6.85($1.3bln)
Why MNI
MNI is the leading provider
of intelligence and analysis on the Global Fixed Income, Foreign Exchange and Energy markets. We use an innovative combination of real-time analysis, deep fundamental research and journalism to provide unique and actionable insights for traders and investors. Our "All signal, no noise" approach drives an intelligence service that is succinct and timely, which is highly regarded by our time constrained client base.Our Head Office is in London with offices in Chicago, Washington and Beijing, as well as an on the ground presence in other major financial centres across the world.