
Why MNI
MNI is the leading provider
of intelligence and analysis on the Global Fixed Income, Foreign Exchange and Energy markets. We use an innovative combination of real-time analysis, deep fundamental research and journalism to provide unique and actionable insights for traders and investors. Our "All signal, no noise" approach drives an intelligence service that is succinct and timely, which is highly regarded by our time constrained client base.Our Head Office is in London with offices in Chicago, Washington and Beijing, as well as an on the ground presence in other major financial centres across the world.
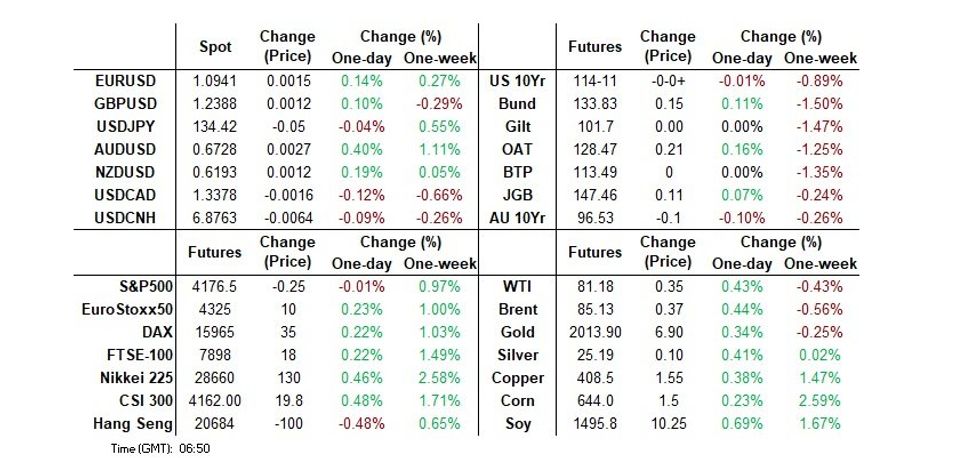
- The AUD is the strongest performer in the G-10 FX space. The AUD firmed after the minutes of the April RBA meeting left the door open for more tightening, with gains marginally extended as Chinese GDP was firmer than expectations.
- Asian equities are mostly lower, with Japan markets the only real positive standout. China related shares haven't received much benefit from the Q1 GDP beat, but monthly March activity figures were mixed. U.S. futures have been relatively quiet, but sit down slightly at this stage.
- In Europe today we have UK labour market data and the German ZEW survey. Further out U.S. housing starts and Canadian CPI will cross. Central bank speak comes from the Fed, ECB, Norges Bank & BoC.
US TSYS: Marginally Richer In Asia
TYM3 deals at 114-11, -0-00+, with a 0-04 range observed on volume of ~70k.
- Cash tsys sit ~1bp richer across the major benchmarks.
- In early dealing Asia-Pac participants faded the cheapening seen in NY yesterday after stronger than expected Empire Manufacturing, perhaps using opportunity to close out short positions/enter fresh longs.
- Tsys held richer through the session looking through the RBA minutes, which left scope for further tightening, and firmer than forecast GDP from China albeit ticking away from best levels after a ~2.1k screen sale weighed.
- A block buyer in FV, 3k lots, helped provide support to the space.
- In Europe today we have UK Unemployment and the German ZEW Survey. Further out US House Starts will cross as will Fedspeak from Governor Bowman.
JGBS: Stronger, But Off Session Bests
JGB futures are slightly stronger after the lunch break, sitting at +7, but still off the best levels set in morning trade. There wasn't much in the way of domestic drivers to flag today, outside of the previously outlined JiJi sources piece re: BoJ inflation projections.
- BoJ Governor Ueda went over old ground re: BoJ JGB purchases, playing down desires to finance government spending.
- In the afternoon session, any positive impact from solid demand at the latest liquidity enhancement auction covering off-the-run 5- to 15.5 Year JGBs appeared offset by US Tsys moving away from session bests after China's Q1 GDP beat expectations.
- Cash JGBs are 0.1-1.6bp richer across the curve with the benchmark 10-year yield 0.9bp lower at 0.476%, below BoJ's YCC limit of 0.50%.
- Swap spreads are mixed with the short end marginally tighter and the long end marginally wider.
- Monthly final industrial production readings headline the limited local docket on Wednesday.
AUSSIE BONDS: At Cheaps, RBA Minutes Flag Tightening Risk
ACGBs sit at or near session cheaps (YM -13.0 & XM -11.0) after the RBA Minutes for April make a special point that “monetary policy may need to be tightened at subsequent meetings”. ACGBs were cheaper ahead of the Minutes in sympathy with the weaker lead from US Tsys in NY trade but then added 3-6bp to the cheapening in the post-Minutes trade.
- In the Minutes, the RBA discussed a 25bp hike or pausing but “on balance” decided to leave rates unchanged to have more time to assess the economic outlook and impact of the significant tightening to date.
- Cash ACGBs are 11-12bp cheaper with the AU-US 10-year yield differential +2bp at -11bp.
- Swap rates are 12-14bp higher with the curve 2bp flatter and EFPs 1-2bp wider.
- Bills strip is steeper with pricing -8 to -17.
- RBA dated OIS pricing is 6-10bp firmer for meetings beyond July. A 32% chance of a 25bp hike in May is priced with a cumulative 18bp of tightening priced by August.
- The AOFM announced the launch via syndication of the new Dec-34 bond today with expected pricing tomorrow.
- With the local calendar light until next week, the local market will remain guided by US Tsys which have cheapened for three consecutive sessions.
AUSTRALIA: CBA Spending Intentions Volatile But Annual Growth Easing
The CBA’s household spending intentions for March rose 8% m/m to be up 3.8% y/y after -0.1% and 4.6% the previous month. The series is nominal and not seasonally- or calendar-day adjusted and March is usually a strong month and so it is more useful to look at the annual percent change. But March this year faced strong headwinds from base effects due to the bounce in post-Covid spending in 2022. The series peaked at 15.2% y/y in August 2022.
- It is worth noting that spending intentions in March 2018 and 2019, pre-pandemic, were 6.4% m/m and 6.2% respectively, less than March 2023. So, this month’s strength may be a tentative signal that spending is holding up but the CBA still expects it to moderate further going ahead.
- The strength in March was driven by transport (+19% m/m), entertainment (+17.2%), retail (+12.6%) and travel (+12.6%).
- Home buying spending intentions rose 6.2% m/m to be down 20.9% y/y but they do appear to have troughed consistent with house prices rising again. Given the volume of mortgage refis due to take place this year and the lagged impact of 350bp of tightening to date, CBA sees further downside to home buying intentions.

Source: MNI - Market News/ABS/CBA
NZGBS: Closed At Cheaps, ACGBs Weaker After RBA Minutes
NZGBs closed at session cheaps with yields 14-15bp higher. A weaker lead from US Tsys saw NZGB yields open higher, but some early Asia-Pac strength in US Tsys helped to contain the early session cheapening. When ACGBs weakened after the RBA Minutes for April made a special point that “monetary policy may need to be tightened at subsequent meetings”, the local market weakened in sympathy. Stronger than expected China Q1 GDP also supported the move.
- At the close, the NZ/US and NZ/AU 10-year yield differentials were respectively 6bp and 3bp wider.
- Swap rates closed 9-10bp weaker with implied swap spreads 5bp tighter.
- RBNZ dated OIS closed 2-8bp firmer across meetings.
- REINZ house prices rose (1.4% M/M) for the first time in 18 months giving some hope that the retreat may have bottomed out.
- The local calendar is light ahead of Q1 CPI on Thursday. With the release yesterday of the final pieces in the CPI forecasting puzzle (March food and rental price data) BBG consensus is expecting a print of +1.5% Q/Q and 6.9% Y/Y after +1.4% and 7.2% in Q4.
- Until then, the local market will remain guided by US Tsys which have cheapened for three consecutive sessions.
FOREX: AUD Firms After RBA Minutes, China GDP
The AUD is the strongest performer in the G-10 space at the margins. The AUD firmed after the minutes of the April RBA meeting left the door open for more tightening, with gains marginally extended as Chinese GDP was firmer than expectations.
- AUD/USD prints at $0.6715/20 ~0.2% firmer today. March Household Spending rose 8.0% up from a fall of -0.1% in February. Bulls target a break of the 50-Day EMA ($0.6736), on the downside support is seen at $0.6620 the low from April 10.
- Kiwi is also firmer, however NZD/USD has been mostly rangebound against USD respecting a $0.6180/95 range in today's Asian session.
- Yen is little changed from yesterdays closing levels. USD/JPY did briefly break Monday's high before gains were pared to sit at ¥134.40/50.
- Elsewhere in G-10 ranges have been narrow with little follow through on moves.
- Cross asset flows remain muted, US Treasury Yields are ~1bp softer and e-minis are flat. BBDXY is also little changed.
- In Europe today we have UK Unemployment and the German ZEW Survey. Further out US House Starts and Canadian CPI will cross.
NZD: No Standout Macro Driver Last Week
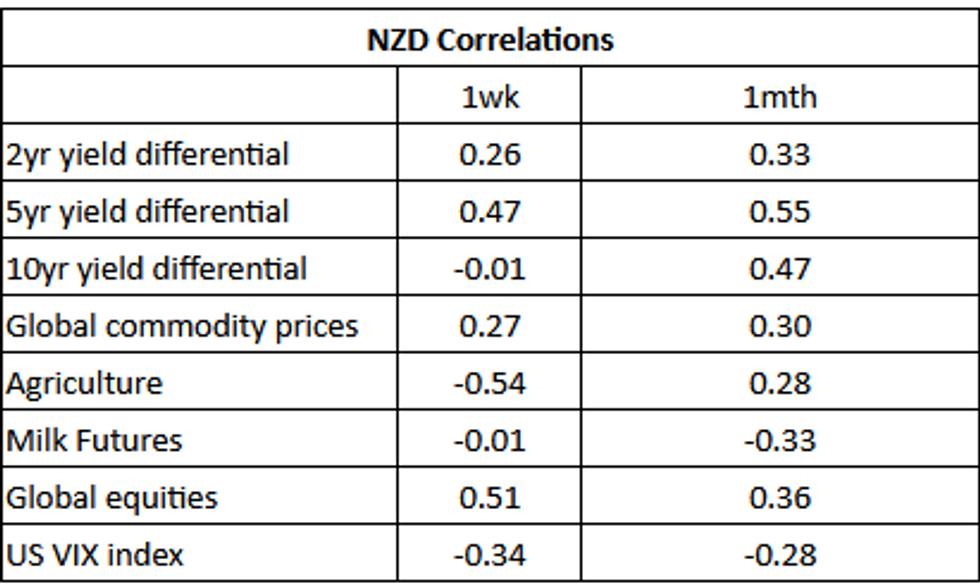
NZD/USD was pressured last week, down ~1%, dealing in a 1.4 cent range through the week. The table below presents levels of correlations between NZD and key macro drivers (note the yield differential reflects swap rates).
- There was no standout macro driver in NZD/USD last week however Global Equities and 5-Year Yield Differentials showed the strongest correlation to the pair.
- NZD/USD looked through stronger agriculture prices last week.
- Over the longer time frame there is, again, no standout macro driver. Correlations with Yield Differentials have weakened a touch however they remain the more dominant macro driver for NZD/USD over the last month.
Source: MNI/Bloomberg
FX OPTIONS: Expiries for Apr18 NY cut 1000ET (Source DTCC)
- EUR/USD: $1.0865-70(E1.3bln), $1.1000(E1.5bln), $1.1050-60(E1.4bln)
- AUD/USD: $0.6600(A$686mln), $0.6665-70(A$614mln) $0.6800(A$1.1bln)
- USD/CAD: C$1.3650($889mln)
- USD/CNY: Cny6.7375($1.6bln), Cny6.9500($1.1bln)
ASIA FX: USD/CNH Steady, But Other USD/Asia Pairs Showing Upside Bias
USD/Asia pairs are mostly higher, with Asian currencies underperforming relative to the majors, which have shown more resilience against the dollar. Mostly weaker regional equities hasn't helped, while some catch up with USD gains through NY trade is also likely weighing. China's Q1 GDP beat didn't have a lasting positive impact on sentiment. Still to come is the BI decision, with no change expected. Outside of Malaysian trade figures, the data calendar is light tomorrow.
- USD/CNH got sub 6.8650 not long after the Q1 GDP beat, but didn't see any follow through. We are back to 6.8770/80 now, only slightly firmer for the session in CNH terms. Onshore equities are muted, with the March monthly activity data showing a strong consumer led rebound, but IP and property related activity was less positive.
- 1 month USD/KRW has tracked recent ranges, with dips below 1315 supported, we currently sit just near 1316. Onshore equities are down, led by automakers, while offshore investors have sold -$93.2mn of local equities so far.
- USD/PHP remains on the front foot, with the pair gaining a further 0.50% today. We were last around the 56.15/20 region, fresh highs back to the start of the year. We are right on the 200-day MA as well. A break through this level would target Dec 28 highs near 56.30. Beyond that there doesn't appear to be too many levels before 57.00 is reached, at least from a technical standpoint. On the downside, the 200-day EMA is around 55.14. Much like yesterday, there doesn't appear to a standout catalyst for PHP weakness, but rather a host of factors, centered on higher US yields.
- USD/IDR has firmed again, the pair around 14865. This is around levels the pair broke lower through last week and also coincided with previous YTD lows in early February. The rupiah has lost around 0.50% so far in trading today. This is line with USD gains elsewhere, with the firmer yield backdrop dominating for now. In terms of upside levels, the 20-day EMA sits at 14966, while on the downside we are more than 200IDR above lows from late last week at 14645.
- USD/INR has drifted higher, last near 82.10, in line with the generally stronger USD tone. Technically we continue to consolidate. Bears look to target the 200-Day EMA at 81.09. Bulls look to target the 83 handle, however they will first need to clear the 20-Day EMA (82.16). Wholesale Prices for March printed below expectations at 1.34% yesterday, this was the lowest monthly rise in Wholesale Prices since October 2020.
CHINA: Consumers Support Q1 Growth But Uncertainties Weigh On Outlook
The stream of data from China for March was mixed relative to expectations. The data showed a solid bounce back following the reopening of the economy.
- Q1 GDP rose 2.2% q/q to be up 4.5% y/y, the highest annual rate since Q1 2022, after 2.9% y/y in Q4. YTD GDP is also 4.5% higher. It remains below pre-pandemic rates through.Consumption contributed two-thirds of Q1 growth. Increased government infrastructure investment also lifted growth.
- The outlook for activity continues to be uncertain and China’s NBS said that there are considerable uncertainties around external demand and constraints around domestic demand, as indicated by weak inflation. These could weigh on growth going forward. The NBS expects a pickup in Q1 growth but Q3 and Q4 to be slower due to base effects. But with government spending up 6.8% y/y, there should be support from the fiscal side.
- Retail sales were very robust rising 10.6% y/y in March after 3.5%. Services spending also saw a solid recovery. The fall in the unemployment rate to 5.3% from 5.6% should also support consumption going forward.
- IP growth improved to 3.9% y/y in March from 2.4%, but was lower than the 4.4% expected. IP is now up 3% YTD. Fixed asset investment also disappointed as it moderated to 5.1% y/y YTD from 5.5%.
- The property sector saw weak investment but strong sales. Investment fell 5.8% y/y YTD but sales were up 7.1% from 3.5%, signalling a tentative recovery. However, the government reported that revenue from land sales fell 17.1% y/y.

Source: MNI - Market News/Refinitiv
EQUITIES: Mostly Down (Ex Japan), China Q1 GDP Beat Fails To Inspire
Regional equities are mostly lower, with Japan markets the only real positive standout. China related shares haven't received much benefit from the Q1 GDP beat, but monthly March activity figures were mixed. US futures have been relatively quiet, but sit down slightly at this stage.
- The China Q1 GDP report showed a beat (4.5% y/y, 4.0% forecast), while Q4 growth was revised up from flat to positive. Still the CSI 300 is only just positive, the Shanghai Composite around flat. Monthly activity indicators for March showed IP and property related investment still trailing expectations. Retail sales provided a solid beat though.
- The HSI popped higher on the data releases but lost traction soon after. We now sit 0.75% lower, with tech and bank related stocks weighing.
- Bank stocks in Japan have helped the main index post a gain, likely reflecting positive spillover from recent US bank earning results. The Topix headline is up around 0.7% at this stage.
- The Kospi is down 0.50%, weighed by automakers, as their EVs were deemed ineligible for a $7500 US tax credit. The Taiex is down 0.6%, in line with a softer SOX tone during Monday's session.
- In SEA, outside of Indonesia stocks (up around 0.60%) we are tracking lower.
GOLD: Bullion Stabilises But Struggling To Hold Above $2000
Gold prices fell 0.5% on Monday due to higher Treasury yields and US dollar following the robust Empire manufacturing index. Today it is 0.2% higher but struggling to hold above $2000/oz. it is currently around $1999.32, below the intraday high of $2001.86. The USD index is down slightly.
- While gold is struggling to rise beyond $2000, it is holding above support at $1981.70, the April 10 low, today. During Monday’s NY session it did break this level briefly reaching an intraday low of $1981.25. It remains well above the 50-day simple moving average.
- Gold has been softer in recent days due to higher US consumer inflation expectations and leading output indicators pointing to further Fed tightening. Recession risk provides support though.
- There are housing starts/permits data for March out in the US later, which are expected to decline on the month after a strong February. The Fed’s Bowman discusses central bank currencies as well.
OIL: Solid Data From China Support Crude As Fed Hike Fears Weigh On Market
Oil prices are off their Monday low but have been moving in a narrow range. Prices are up around 0.2% today after falling around 2% yesterday, supported by data showing solid growth in China following its reopening. Brent is trading around $84.90/bbl and WTI $80.95. The USD index is down slightly.
- WTI rose to a high of $81.22 today after reaching a low of $80.71 earlier. Brent has had an intraday high of $85.20 which followed a low of $84.59. Both are hovering just above their 200-day simple moving averages.
- China’s Q1 GDP rose a higher-than-expected 2.2% q/q to be up 4.5% y/y, the highest annual rate since Q1 2022, after 2.9% y/y in Q4, which is positive for the oil demand outlook. (See Consumers Support Q1 Growrh But Uncertainties Weigh On Outlook)
- On the supply front, Russian oil shipments were back above 3mbd last week, according to Bloomberg. It had said that it would reduce output to the end of 2023. India has said that it will continue to demand Russian crude.
- API US inventory data is released later and given the sensitivity of the market to supply developments is likely to be watched closely. Last week’s data showed a 377k barrel crude build, according to Bloomberg.
- There are housing starts/permits data for March out in the US later, which are expected to decline on the month after a strong February. The Fed’s Bowman discusses central bank digital currencies as well. There is also UK wages/employment data and Canadian March CPI.
UP TODAY (TIMES GMT/LOCAL)
| Date | GMT/Local | Impact | Flag | Country | Event |
| 18/04/2023 | 0600/0700 | *** |  | UK | Labour Market Survey |
| 18/04/2023 | 0900/1100 | * |  | EU | Trade Balance |
| 18/04/2023 | 0900/1100 | *** |  | DE | ZEW Current Conditions Index |
| 18/04/2023 | 0900/1100 | *** | | DE | ZEW Current Expectations Index |
| 18/04/2023 | 0900/1000 | ** | | UK | Gilt Outright Auction Result |
| 18/04/2023 | 1230/0830 | *** |  | CA | CPI |
| 18/04/2023 | 1230/0830 | *** |  | US | Housing Starts |
| 18/04/2023 | 1255/0855 | ** | | US | Redbook Retail Sales Index |
| 18/04/2023 | 1300/1500 | | EU | ECB Elderson in Basel Committee on Banking Supervision | |
| 18/04/2023 | 1500/1100 | | CA | BOC Governor testifies to House of Commons committee | |
| 18/04/2023 | 1530/1130 | ** | | US | US Treasury Auction Result for 52 Week Bill |
| 18/04/2023 | 1700/1300 | | US | Fed Governor Michelle Bowman |
Why MNI
MNI is the leading provider
of intelligence and analysis on the Global Fixed Income, Foreign Exchange and Energy markets. We use an innovative combination of real-time analysis, deep fundamental research and journalism to provide unique and actionable insights for traders and investors. Our "All signal, no noise" approach drives an intelligence service that is succinct and timely, which is highly regarded by our time constrained client base.Our Head Office is in London with offices in Chicago, Washington and Beijing, as well as an on the ground presence in other major financial centres across the world.