
Why MNI
MNI is the leading provider
of intelligence and analysis on the Global Fixed Income, Foreign Exchange and Energy markets. We use an innovative combination of real-time analysis, deep fundamental research and journalism to provide unique and actionable insights for traders and investors. Our "All signal, no noise" approach drives an intelligence service that is succinct and timely, which is highly regarded by our time constrained client base.Our Head Office is in London with offices in Chicago, Washington and Beijing, as well as an on the ground presence in other major financial centres across the world.
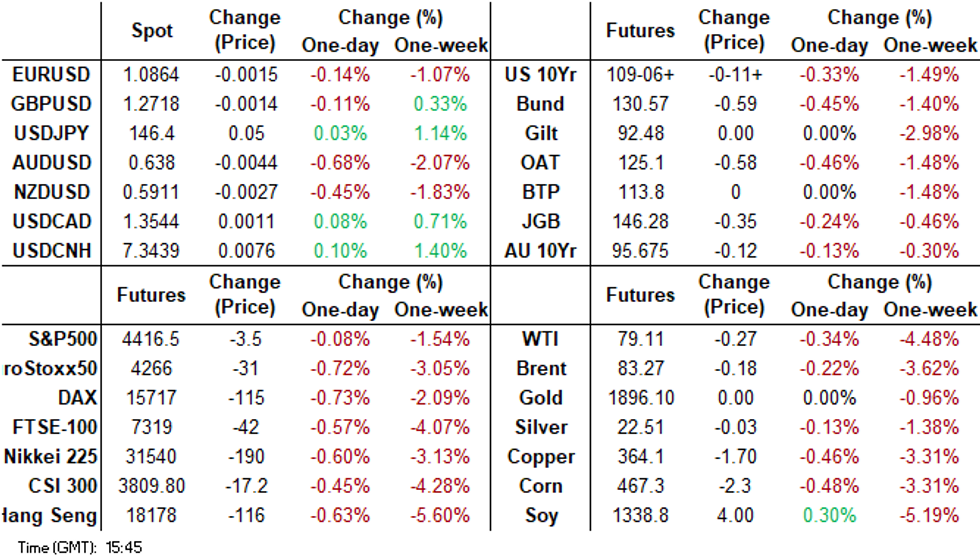
- JGB futures pushed to a new Tokyo session low of 146.26 in afternoon trade. The catalyst for the move was very poor digestion of today's 20-year supply. For the US, cash tsys sit ~3bps cheaper across the major benchmarks. ACGBs (YM -5.0 & XM -9.0) sit weaker, well off session bests. July employment was weaker and the unemployment rate higher than expected but it seems to be driven by school holidays, just as the softer April data was.
- Still, the AUD is the weakest performer in the G10 space, AUD/USD sits ~0.7% lower. Broader USD gains continued, with the BBDXY nudging up by a further 0.10%.
- China and Hong Kong equities recovered from early lows but have struggled to maintain positive momentum. USD/Asia FX dips are being supported.
- There is a thin docket in Europe today, further out we have US initial jobless claims and US Conf. Board leading index.
MARKETS
US TSYS: Marginally Cheaper In Asia
TYU3 deals at 109-10+, -0-07+, a range of 0-12+ has been observed on volume of 146k.
- Cash tsys sit ~3bps cheaper across the major benchmarks.
- TY extended contact lows in early dealing as weaker regional equities and US equity futures weighed on risk sentiment as concerns over the Chinese economy continued to escalate.
- Tsys held cheaper through the session dealing in narrow ranges for the most part, despite a recovery from session lows in regional & US equities and the USD ticking away from best levels.
- There is a thin docket in Europe today, further out we have US initial jobless claims and US Conf. Board leading index.
JGBS: Futures Pressured By A Very Poor 20Y Auction, National CPI Tomorrow
JGB futures pushed to a new Tokyo session low of 146.26 in afternoon trade. The catalyst for the move was very poor digestion of today's 20-year supply.
- The highest outright yield since February and the steepest 10/20 curve since March were unable to facilitate a successful takedown of this month's 20-year supply. The low price fell well below dealer expectations (95.55 versus 96.75 est.), the cover ratio tumbled to 2.795x from 3.382x last month and the tail lengthened to its longest since 1987.
- Currently, JBU3 is 146.39, -24 compared to settlement levels.
- The cash JGB curve has bear steepened in the afternoon session, with yields 0.1bp to 4.8bp higher. The benchmark 10-year yield is 1.4bp higher at 0.645%, above BoJ's YCC old limit of 0.50% but below its new hard limit of 1.0%.
- The 20-year JGB yield is currently 4.8bp higher on the day at 1.357%, after hitting a session high of 1.381% in the aftermath of the 20-year auction result.
- The swaps curve has bear steepened, with rates 0.8bp to 5.0bp higher. Swap spreads are generally wider across the curve.
- Tomorrow the local calendar sees National CPI.
JAPAN DATA: Trade Figures Close To Expectations, Exports To China Weaken
July trade figures were close to expectations. The trade deficit printed at -¥78.7bn, versus a ¥47.9bn forecast. In adjusted terms we were also slightly below expectations, -¥557.2bn, versus -¥460.9bn projected. This deficit was very similar to the June print.
- Exports eased to -0.3% y/y, close to the -0.2% forecast, while the prior outcome was +1.5%. This was the first y/y fall since early 2021. By region, export volumes were firm to the US, +2.5% y/y, but weakened to China, -15.9% y/y. We are above earlier 2023 lows in terms of export momentum to China, but lost ground versus the June pace.
- On the import side, we were also close to expectations. The outcome printing at -13.5% y/y, versus -15.2% forecast. The prior outcome was -12.9% y/y.
AUSSIE BONDS: Post-Jobs Data Gains Pared, Pressured By US Tsys & JGBs
ACGBs (YM -5.0 & XM -9.0) sit weaker, well off session bests, despite the July employment report printing significantly weaker than expected. Employment fell 14,644 versus the +15,000 estimate. The unemployment rate unexpectedly rose to 3.7% versus expectations of 3.6% and 3.5% prior.
- ACGBs had richened 3-5bp immediately after the data, but subsequently unwound those gains, particularly at the long end as the local market got caught in spillover selling after the 20-year JGB auction saw a very poor outcome. The cover ratio declined sharply, and the auction tail lengthened to its longest since 1987.
- Cash ACGBs are 4-9bp cheaper on the day, but flat to 2bp richer after the data. The AU-US 10-year yield differential is 3bp tighter at flat.
- Longer-end ACGBs have been relatively pressured by US tsys, which sit ~3bp weaker and at Asia-Pac lows.
- Swap rates are 4-8bp higher on the day, with the 3s10s curve steeper.
- The bill strip has bear steepened with pricing flat to -6.
- RBA-dated OIS pricing is 1-2bp firmer for meetings beyond Feb’24.
- Tomorrow the local calendar is empty.
- There is a thin docket in Europe today, further out we have US initial jobless claims and US Conf. Board leading index.
AUSTRALIAN DATA: Disappointing Jobs Data Impacted By Holidays
July employment was weaker and the unemployment rate higher than expected but it seems to be driven by school holidays, just as the softer April data was. We will need the August data to ascertain if there has been a turn in employment. The RBA noted in its August minutes that there have been “early signs that the labour market might be at a turning point” and the July data probably have not made this statement more definite but have made it even more likely the RBA will be on hold in September.
- Employment fell 14.6k in July after rising 31.6k, which was weaker than expected but within the range of forecasts. But it is still 235.8k higher in 2023 with full-time +189.1k and part-time only +46.7k signalling that labour shortages have been eased by making employees full-time. While FT employment fell 24.2k in July it is still running at 4.1% y/y but PT is now seeing a pickup in 3-month momentum. The participation rate eased 0.1pp to 66.7% but labour force growth continued at around 3% y/y.
- The unemployment rate rose 0.2pp to 3.7% in July with the number of unemployed rising 35.6k but holiday months January and April also saw rises. The number of unemployed is up 55.5k y/y. The RBA cited the trough in the underemployment rate but it didn’t rise further in July staying at 6.4%. But it is now 0.5pp higher than the February trough.
- Hours worked rose 0.2% m/m with part-timers taking up the slack (+1.9% m/m) as FT hours fell 0.1% m/m. Total hours are up 5.2% y/y compared with employment’s 2.8% and the ABS noted that the strength “shows that it continues to be a tight labour market”.
- The ABS observed that there is a change in when holidays are taken and so when jobs are started/left and that this needs to be considered when looking at the monthly data.

Source: MNI - Market News/ABS
NZGBS: Closed Sharply Cheaper, Pressured By US Tsys & JGBs
NZGBs closed sharply cheaper, resulting in benchmark yields surging by 9bp. This downward trend was attributed to the local market being affected by the upward movement of global bond yields. Initially, despite the weakness observed in US tsys overnight, NZGBs commenced the day with only a slight cheapening. However, as weakness in US tsys persisted throughout the Asia-Pac session, NZGBs progressively weakened.
- A temporary pause in the selling occurred when ACGBs saw an uptick in response to unexpectedly weak employment data. Nonetheless, the selling pressure resumed after global bonds were negatively impacted by a subpar 20-year JGB auction.
- US tsys sit ~3bps cheaper across the major benchmarks in Asia-Pac trade.
- The situation was exacerbated by lacklustre demand witnessed at the weekly NZGB auction, where cover ratios ranged from 2.11x to 2.93x.
- Swap rates closed 9-12bp higher with the 2s10s curve steeper.
- RBNZ dated OIS pricing closed 2-6bp firmer across meetings.
- Tomorrow the local calendar is empty tomorrow.
- There is a thin docket in Europe today, further out we have US initial jobless claims and US Conf. Board leading index.
RBNZ: MNI RBNZ Review - August 2023: Prolonged Pause
- The RBNZ left the cash rate at 5.5% at its August meeting as was widely expected as restrictive policy is constraining domestic demand but it needs to remain “restrictive” for the “foreseeable future” in order to bring inflation back to target.
- The revised OCR profile showed rates around 5.5% for almost two years, which Governor Orr is “confident” should be enough to return inflation to target. His comments signal that the RBNZ is on hold for now but continues to “watch, worry and wait”. But Orr doesn’t feel a “rush” to change rates in either direction.
- The OCR profile was revised up with the peak at 5.6% in H1 2024, which Orr said was not a signal. The revisions seem to suggest more that rates will be “higher for longer” rather than the next move will be a hike. Thus it looks as though there will be an extended pause well into 2024 and possibly to early 2025.
- See full review here.
RBNZ: No “Rush” To Change Rates But “Higher For Longer” To Contain Inflation
RBNZ Governor Orr has spoken to Bloomberg TV and stated that the RBNZ doesn’t feel a “rush” to change rates any time soon but that it is firmly in the “higher for longer” camp. Its OCR profile published yesterday has rates around 5.5% for almost two years, which the central bank believes is “restrictive”. Orr said today that that should be enough to return inflation to target but the RBNZ is in a position to tighten or loosen policy depending on its assessment of new information. These comments, in addition to Tuesday’s, signal that the RBNZ is on hold for now.
- Orr reiterated that the 10bp increase in the OCR projections for H1 2024 is not a signal but a projection. There are too many uncertainties to be able to give “forward guidance”. He believes that a rate at 5.5% balances risks around inflation but he’s aware that core inflation is sticky and that the effect of increased migration is uncertain. But the focus remains on the medium-term.
- With rates restrictive the RBNZ has the time to “watch, worry and wait”.
- The projected recession is the bare minimum that NZ requires to contain inflation, as growth needs to be below potential. There should be sustained, subdued domestic demand to achieve this.
- Orr was not worried about NZD weakness as it can be comfortably explained.
- Any adjustments to the budget from a change in government in October will be important to the RBNZ.
FOREX: AUD Extends Losses After July Jobs Report
The AUD is the weakest performer in the G10 space, AUD/USD sits ~0.7% lower. The Unemployment Rate ticked higher in July to 3.7%, higher than the expected rise to 3.6%, and there was a net loss of 14.6k jobs.
- AUD/USD prints at $0.6380/85, a touch off the lowest level since November 2022. Support now comes in at $0.6285, low from 4 Nov 2022.
- Kiwi is also pressured after the negative lead from regional equities weighed in early trade before spillover from the AUD saw losses extended. NZD/USD sits at touch above the $0.59 handle, a break through here opens $0.5813, a Fibonacci projection.
- Yen is little changed and has dealt in narrow ranges for the most part.
- Elsewhere in G-10, the Scandies are pressured however liquidity is generally poor in Asia.
- Cross asset wise; US Tsy Yields are ~3bps firmer across the curve and BBDXY is up ~0.1%. The Hang Seng has recouped an early ~2.3% loss to sit little changed, however spillover into FX is limited at this stage.
- There is a thin docket in Europe today, further out Initial Jobless Claims headlines an otherwise thin calendar.
JAPAN DATA: Offshore Investors Sell Local Bonds For 5th Straight Week
Offshore buying of Japan equities recovered some ground in the week ending August 11. We saw net inflows of ¥227.2bn, versus a modest outflow from the week prior. This pace of inflow is still down on what we saw through the Q2 period. Offshore investors continued to sell local debt though, with a further -¥871.1bn in outflows. This was down on the prior week, in terms of pace of outflows, but still marked the fifth straight week of outflows.
- In terms of Japan outbound flows. Offshore purchases of both bonds and equities were negative last week, see the table below.
Table 1: Japan Weekly Investment Flows
| Billion Yen | Week ending August 11 | Prior Week |
| Foreign Buying Japan Stocks | 227.2 | -59.6 |
| Foreign Buying Japan Bonds | -871.1 | -1964.1 |
| Japan Buying Foreign Bonds | -334.6 | 1119.5 |
| Japan Buying Foreign Stocks | -54.7 | -352.2 |
Source: MNI - Market News/Bloomberg
EQUITIES: HK/China Recoup Early Losses, Japan Bank Stocks Rise With Local Yields
Regional equities are mostly tracking lower, albeit away from session lows. Hong Kong and China equities opened sharply lower, but have recouped a large proportion of losses to the lunchtime break. Also helping has been a recovery in US equity futures from earlier session lows. Eminis last tracked near 4424, slightly firmer for the session, against earlier lows at 4409.5. Nasdaq futures have also firmed from intra-day lows.
- Japan shares are lower but like elsewhere have recovered from earlier lows. The Topix was last around 2244, down ~0.60% for the session. Some support has come from firmer bank stocks, which have risen with local yields (yields have been supported by a weak 20-yr debt sale).
- The HSI opened down around 2%, but sits back at the break close to flat. The HSTECH index is into positive territory, after being down 2.5% at one stage. Some support is evident around the simple 200-day MA for this index.
- China's CSI 300 saw demand sub 3800 level, with the index back to 3816 at the break. The HS China Enterprise Index is also back in positive territory reversing earlier losses.
- The Kospi is tracking down around 0.5% at this stage, while the Taiex in Taiwan is slightly firmer.
- In SEA, most markets are down, but losses are generally less than 0.50% at this stage.
OIL: Crude Off Intraday Lows As Correction Stalls During APAC Trading
Oil prices are off their intraday lows to be steady during the APAC session. US yields are higher and the USD index is up 0.1% to be +0.7% on the week.
- WTI fell just below $79/bbl earlier but found support there. It reached a low of $78.95 but is now trading around $79.31, just off the high of $79.49. Support is at $78.69, August 2 low. Brent has held above $83 with the intraday low at $83.05. It is now trading around $83.47, close to the high of $83.63.
- Risk appetite has been weakened by lacklustre growth in China and ongoing problems in the property sector, and a hawkish Fed. This is also impacting commodity markets. Equities are down across the region today.
- If the correction continues, Saudi Arabia is likely to step in again to try and support prices. A fall in US inventories to their lowest level since early January suggests that supply is tightening.
- Later US jobless claims and August Philly Fed print.
GOLD: Falls Below the 200-Day Moving Average
Gold is little changed in the Asia-Pac session, after closing 0.5% lower at 1891.81 on Wednesday. The close was below the June 29 low and the bear trigger identified by MNI’s technicals team. The precious metal also breached its 200-day moving average, a key support level. The next level on the downside is $1885.8, the March 15 low.
- Bullion was pressured by more hawkish than expected FOMC minutes for the July meeting. The minutes revealed that a majority of participants maintain a perspective of substantial upward risks to inflation, potentially necessitating additional measures to tighten monetary policy. Furthermore, the minutes highlighted that forthcoming data in the following months would offer insights into the ongoing trajectory of the disinflation process.
- US tsys finished 1-4bps cheaper across the major benchmarks on Wednesday, with the belly underperforming. Higher bond yields are typically negative for the precious metal, which doesn’t earn interest income.
- The continued rise in the USD also added downward pressure on the yellow metal.
ASIA FX: USD/Asia Pairs Still Biased Higher
USD/Asia pairs are mostly higher, in line with broader USD trends and regional equity market weakness (for the most part). USD/CNH is away from earlier highs, but dips remain supported as local equities struggle to sustain positive momentum. USD gains have been slightly firmer against the likes of THB, MYR and PHP in SEA. We still have the BSP decision to come, no change is expected. Tomorrow, we have Q2 Malaysia GDP on tap and July trade figures. Taiwan Q2 GDP revisions are also due.
- USD/CNH got close to 7.3500 in early trade, before correcting lower. We pulled back to 7.3330/40 but dips have been supported. The CNY fixing was again very strong relative to the consensus, while onshore equities opened noticeably weaker. Equities have recouped some losses, but are struggling to gain positive traction. Onshore USD/CNY spot has pushed higher, breaking above 7.3150.
- The USD/HKD recovery continues, the pair currently just below recent highs, last tracking near 7.8330. Dips sub 7.8300 have generally been support today and we are tracking higher for the 4th straight session. We are above all key EMAs now, with the 200-day back near 7.8300 potentially a support point. Yield momentum remains skewed in the USDs favor. 3 month Hibor continues to edge down from recent highs, last at 5.02%, we were at 5.43% near the start of August.
- USD/INR has re-opened, after being closed for 2 days due to the observance of national holidays, sitting a touch above the 83 handle as broader USD trends dominate flows. The pair sits a touch off its highest level since October 2022 and has firmed ~1% in August. The latest CDS data shows that a total net of $182mn in Indian equities have been bought by foreign investors in August. A reminder that the domestic data calendar is empty until 31 August when Q2 GDP crosses.
- USD/PHP is firmer for the session so far, last in the 56.65/70 region. This is 0.30% weaker in PHP terms versus yesterday's closing level, but the pair remains within recent ranges. Recent highs are around the 57.00 level, while early August highs in the 56.45/50 region may provide some USD support if we see a concerted pull back.• Coming up later is the BSP decision. No change is expected, with focus on BSP rhetoric, particularly around the policy bias. Fallout for PHP could materialize if the central bank sounds too dovish, although that seems unlikely given recent commentary from the Governor.
- USD/MYR is holding at August highs, as of yet on Thursday the pair has been unable to follow through on an early breach of month to date highs . Broader greenback trends continue to dominate flows, as higher US Tsy Yields weigh on the Ringgit. A reminder that tomorrow Q2 GDP and July Trade Balance are due. GDP is forecasted at 1.1% Q/Q for Q2.
- The SGD NEER (per Goldman Sachs estimates) is little changed in early dealing this morning and is well within recent ranges, we currently sit ~0.8% below the top of the band. Broader USD trends continue to dominate flows, USD/SGD ticked higher extending YTD highs. The pair is marginally firmer in early dealing on Wednesday and last prints a touch above the $1.36 handle. July export data was weaker than expected for Singapore. For the month we fell -3.4%, versus +1.3% forecast. The prior read was +5.2%. Electronic exports were down -26.1% y/y, versus -16.0% prior.
- USD/THB has remained on the front foot during today's session, the pair last in the 35.50/55 region, down slightly from session highs. Yesterday we closed at 35.37, as the market saw some relief with the next PM vote scheduled to go ahead on August 22. Still, firmer USD levels post the onshore spot close have weighed. All key EMAs for USD/THB sit back below 35.00, while YTD highs in late June at 35.71, aren't too far away.
UP TODAY (TIMES GMT/LOCAL)
| Date | GMT/Local | Impact | Flag | Country | Event |
| 18/08/2023 | 0600/0700 | *** |  | UK | Retail Sales |
| 18/08/2023 | 0800/1000 |  | EU | ECB's Lane appears in ECB podcast | |
| 18/08/2023 | 0900/1100 | *** | | EU | HICP (f) |
| 18/08/2023 | 0900/1100 | ** | | EU | Construction Production |
| 18/08/2023 | 0900/0500 | * |  | US | Business Inventories |
| 18/08/2023 | 1230/0830 | * |  | CA | Industrial Product and Raw Material Price Index |
| 18/08/2023 | 1400/1000 | * | | US | Services Revenues |
Why MNI
MNI is the leading provider
of intelligence and analysis on the Global Fixed Income, Foreign Exchange and Energy markets. We use an innovative combination of real-time analysis, deep fundamental research and journalism to provide unique and actionable insights for traders and investors. Our "All signal, no noise" approach drives an intelligence service that is succinct and timely, which is highly regarded by our time constrained client base.Our Head Office is in London with offices in Chicago, Washington and Beijing, as well as an on the ground presence in other major financial centres across the world.