-
Policy
Policy
Exclusive interviews with leading policymakers that convey the true policy message that impacts markets.
LATEST FROM POLICY: -
EM Policy
EM Policy
Exclusive interviews with leading policymakers that convey the true policy message that impacts markets.
LATEST FROM EM POLICY: -
G10 Markets
G10 Markets
Real-time insight on key fixed income and fx markets.
Launch MNI PodcastsFixed IncomeFI Markets AnalysisCentral Bank PreviewsFI PiFixed Income Technical AnalysisUS$ Credit Supply PipelineGilt Week AheadGlobal IssuanceEurozoneUKUSDeep DiveGlobal Issuance CalendarsEZ/UK Bond Auction CalendarEZ/UK T-bill Auction CalendarUS Treasury Auction CalendarPolitical RiskMNI Political Risk AnalysisMNI Political Risk - US Daily BriefMNI Political Risk - The week AheadElection Previews -
Emerging Markets
Emerging Markets
Real-time insight of emerging markets in CEMEA, Asia and LatAm region
-
Commodities
-
Credit
Credit
Real time insight of credit markets
-
Data
-
Global Macro
Global Macro
Actionable insight on monetary policy, balance sheet and inflation with focus on global issuance. Analysis on key political risk impacting the global markets.
Global MacroDM Central Bank PreviewsDM Central Bank ReviewsEM Central Bank PreviewsEM Central Bank ReviewsBalance Sheet AnalysisData AnalysisEurozone DataUK DataUS DataAPAC DataInflation InsightEmployment InsightGlobal IssuanceEurozoneUKUSDeep DiveGlobal Issuance Calendars EZ/UK Bond Auction Calendar EZ/UK T-bill Auction Calendar US Treasury Auction Calendar Global Macro Weekly -
About Us
To read the full story
Sign up now for free trial access to this content.
Please enter your details below.
Why MNI
MNI is the leading provider
of intelligence and analysis on the Global Fixed Income, Foreign Exchange and Energy markets. We use an innovative combination of real-time analysis, deep fundamental research and journalism to provide unique and actionable insights for traders and investors. Our "All signal, no noise" approach drives an intelligence service that is succinct and timely, which is highly regarded by our time constrained client base.Our Head Office is in London with offices in Chicago, Washington and Beijing, as well as an on the ground presence in other major financial centres across the world.
Real-time Actionable Insight
Get the latest on Central Bank Policy and FX & FI Markets to help inform both your strategic and tactical decision-making.
Free AccessMNI UST Issuance Deep Dive: Dec 2024
MNI US Employment Insight: Soft Enough To Keep Fed Cutting
MNI ASIA MARKETS ANALYSIS: Jobs Data Green Lights Rate Cuts
MNI EUROPEAN MARKETS ANALYSIS: USD Continues To Firm As FOMC Comes Into View
- US Tsy future TYM4 is at 107-16, +0-02 from NY closing levels, after dealing in a narrow range ahead of the FOMC Policy Decision later today. NZGBs closed flat to 2bps cheaper after today’s Q1 Employment Report printed weaker than expected. NZD was weaker early, but sits away from lows. The USD sits mostly higher against the rest of the G10.
- Australian home prices continued to rise at 0.6% m/m in April to be up 8.7% y/y but not all cities are rising at the same pace with Sydney and Melbourne lagging the other capitals. South Korean trade figures for April showed continued export growth, led by shipments to the US.
- Overall though, it has been a relatively steady Asia Pac session, with only Japan, Australia & New Zealand markets open. Much of the rest of the region has been closed for Labour Day holidays.
- Later the Fed decision is announced and April ADP employment, ISM/PMI manufacturing and March JOLTS job openings print. UK April manufacturing PMI is released, while Europe ex UK is closed.

MARKETS
US TSYS: Slightly Richer Ahead Of FOMC Policy Decision Later Today
TYM4 is at 107-16, +0-02 from NY closing levels, after dealing in a narrow range in today’s Asia-Pac session ahead of the FOMC Policy Decision later today.
- Cash US tsys are dealing ~1bp richer in today’s Asia-Pac session after yesterday’s heavy session, where the 2-year yield closed above 5.0% for the first time since November.
- Analysts generally look for a more hawkish message from the FOMC in May compared with March, in light of strong inflation and economic activity data.
- Fed Chair Powell is expected to tilt more cautious on the inflation outlook than in previous appearances, with potential flashpoints for markets including whether he acknowledges that 3 cuts are less likely to be the base case for the FOMC in 2024, and/or whether June is too early for the first cut. (See MNI’s FOMC Preview here)
JGBS: Cheaper Ahead Of FOMC Decision Later Today, BoJ March Minutes Tomorrow
JGB futures are holding weaker in the Tokyo afternoon session, -24 compared to the settlement levels, after dealing in a relatively narrow range ahead of the FOMC Policy Decision later today.
- There hasn’t been much in the way of domestic drivers to flag, outside of the previously outlined Jibun Bank PMI Mfg.
- Cash US tsys are dealing little changed in the Asia-Pac session after yesterday's heavy session.
- Cash JGBs are mostly cheaper, with yields flat to 3bps higher. The benchmark 10-year yield is 1.3bps higher at 0.892% versus the YTD high of 0.930%.
- The swaps curve continues to twist-steepen, pivoting at the 20s, with rates -2bps to +3bps. Swap spreads are tighter out to the 10-year and wider beyond.
- Tomorrow sees the BoJ Minutes of the March Meeting alongside Monetary Base and Consumer Confidence data.
- The MoF will also conduct a Liquidity Enhancement Auction for 1-5-year OTR JGBs.
AUSSIE BONDS: Cheaper, Narrow Ranges Ahead Of FOMC Policy Decision
ACGBs (YM -6.0 & XM -6.5) are holding weaker after dealing in narrow ranges in today’s Sydney session. With the local calendar light and the FOMC Policy Decision due later today, local participants sat on the sidelines.
- Cash US tsys are dealing ~1bp richer in today’s Asia-Pac session after yesterday’s heavy session.
- Analysts generally look for a more hawkish message from the FOMC in May compared with March, in light of strong inflation and economic activity data.
- (AFR) The US and Australian central banks are expected to take a tougher stance on tackling inflation at their upcoming meetings, cementing expectations that interest rates will have to stay high for longer and risking a further sell-off in the market. (See link)
- Cash ACGBs are 5-6bps cheaper, with the AU-US 10-year yield differential at -19bps.
- Today’s May-34 bond auction went smoothly with strong demand metrics, including a jump in the cover ratio to 3.9813x from 3.6437x at the March auction.
- Swap rates are 4-5bps higher, with the 3s10s curve steeper.
- The bills strip has bear-steepened, with pricing -2 to -6.
- RBA-dated OIS pricing is 4-6bps firmer for late 2024/early 2025 meetings.
- Tomorrow, the local calendar will see Building Approvals and Trade Balance data.
AUSTRALIAN DATA: House Prices Continue Uneven Climb Higher, Affordability Deteriorates
Australian home prices continued to rise at 0.6% m/m in April to be up 8.7% y/y but not all cities are rising at the same pace with Sydney and Melbourne lagging the other capitals, according to CoreLogic data. With the working age population rising almost 3% y/y in March and Q1 average building approvals running 10.1% below Q4, housing shortages and price pressures are likely to persist.
- CoreLogic notes that the lower end of the market is seeing strong growth in most regions, as poor affordability bites. Price growth for units has exceeded houses over the last 3 months.
- Transactions tend to be a lead indicator of prices and sales have stabilised since November’s RBA hike but they are still 5.1% higher than average. CoreLogic expects sales to remain lacklustre until the RBA eases providing some relief for affordability.
- We estimate that affordability deteriorated further in Q1 falling to 44% below trend from 43%, which would be the worst since our series begins in 1980. We assume that nominal disposable income rose 1.2% q/q, in line with the 2023 average. House prices rose a similar amount in Q1 and variable housing loan rates increased just under 0.1pp.
- Q1 rents increased 7.8% y/y up from 7.3% in Q4. House prices-to-rents, our measure of valuation, fell slightly in the quarter but housing is still just under 10% overvalued down from 11% in Q4.
Source: MNI - Market News/Refinitiv/CoreLogic
NZGBS: Closed Slightly Cheaper After A Post-Employment Data Rally
NZGBs closed flat to 2bps cheaper after today’s Q1 Employment Report printed weaker than expected. The local market had been as much as 5bps cheaper early after a negative lead-in from US tsys.
- Q1 employment fell 0.2% q/q to be up only 1.2% y/y after rising 0.4% and 2.7% in Q4 respectively. The unemployment rate rose 0.3pp to 4.3%, its highest since Q4 2018. The labour market is softening as demand weakens and labour supply strengthens, which was also reflected in moderating wage growth.
- The labour cost index rose 0.9% to be up 4.1% y/y, the lowest quarterly rate since Q1 2022. It remains elevated though and only 0.2pp lower than its 4.3% peak.
- The progress should reassure the RBNZ but is unlikely to shift the MPC to an easing bias at its May 22 meeting.
- Swap rates closed -1bp to +2bp., with the 2s10s curve steeper.
- RBNZ dated OIS pricing closed 2-4bps softer for meetings beyond August. A cumulative 37bps of easing is priced by year-end.
- RBNZ officials will appear in parliament to discuss the Financial Stability Report tomorrow. Building Permits for March are also due.
- Tomorrow, the NZ Treasury plans to sell NZ$250mn of the 4.5% May-30 bond and NZ$250mn of the 3.5% Apr-33 bond.
NEW ZEALAND DATA: Labour Market Weakens, Wage Growth Elevated
Q1 employment was weaker-than-expected falling 0.2% q/q to be up only 1.2% y/y after rising 0.4% and 2.7% in Q4 respectively. The unemployment rate rose 0.3pp to 4.3%, its highest since Q4 2018. The labour market is softening as demand weakens and labour supply strengthens, which was also reflected in moderating wage growth. The progress should reassure the RBNZ but is unlikely to shift the MPC to an easing bias at its May 22 meeting.
NZ unemployment rate %
Source: MNI - Market News/Refinitiv
- The labour data were weaker than the RBNZ had forecast in February but labour costs were above their expectations. Q1 unemployment rate was 0.1pp higher, annual employment growth 0.3pp lower but annual labour cost growth 0.3pp higher. Revised forecasts will be provided at the May meeting.
- The underutilisation rate rose 0.5pp to 11.2% in Q1, which was driven by the 15-24 yrs age group accounting for half the deterioration. Aggregate hours worked rose 0.4% q/q though to be up 2.2% y/y.
- Weakness was seen in both full-time and part-time employment with them falling 0.3% and 0.5% q/q respectively.
- The labour cost index rose 0.9% to be up 4.1% y/y, the lowest quarterly rate since Q1 2022. It remains elevated though and only 0.2pp lower than its 4.3% peak. Average hourly earnings rose 5.2% y/y but this is down from the 7.6% peak. The strength is being driven by the healthcare & social assistance, education and public administration sectors. Private ordinary time earnings rose 0.8% q/q down from 1.0% q/q in Q4.
Source: MNI - Market News/Refinitiv
FOREX: USD Grind Higher Continues As Fed Comes Into View
The USD has continued to edge higher through Asia Pac trade on Wednesday. We were last +0.10% firmer, with the BBDXY index up to 1267.1 This is fresh highs in the index back to Apr 19.
- Overall moves have been contained though, with much of the region out for labor day holidays. We also have the Fed outcome later.
- We started off with NZD on the back foot, which came after weaker Q1 employment data and a tick up in the unemployment rate. However, lows at 0.5875 saw support emerge, the pair last tracking close to 0.5885/90, little changed for the session.
- Selling interest in the AUD/NZD cross above 1.1000 (highs of 1.1019) helped NZD at the margins. The cross is back to 1.0985/90 this afternoon.
- AUD/USD is down 0.1% to 0.6467 after trading in a range of 0.6465-0.6485.
- The S&P e-mini is slightly lower. Oil prices have continued sinking with WTI down 1% to $81.12/bbl. Copper is 0.8% lower and iron ore around $115.50/t.
- US yields sit less than 1bp lower across the benchmarks, with Tsy futures off earlier highs.
- USD/JPY is a touch higher, last near 157.85/90, a steady grind up, but we haven't recaptured the 158.00 handle yet. USD/CHF has seen more upside, the pair above 0.9210, +0.20% firmer for the session.
- Later the Fed decision is announced (see MNI Fed Preview) and April ADP employment, ISM/PMI manufacturing and March JOLTS job openings print. UK April manufacturing PMI is released, while Europe ex UK is closed.
AUD/NZD FOREX: AUD/NZD Can't Sustain +1.10 Handle, But Uptrend Still looks Intact
AUD/NZD hit fresh highs back to June last year post the weaker than expected Q1 NZ jobs report. We got to 1.1019, but now sit around 30pips lower, last near 1.0990/95. Recent moves above 1.1000 haven't been sustained in the pair but we still remain in an uptrend.
- In terms of technicals, the 20-day EMA continues to track higher, last near 1.0930. All key EMAs are pushing higher, with the 200-day back around 1.0810. A clean break above 1.1000 could see mid April highs from last year around 1.1055/60 targeted. Beyond that lies the Feb 2023 highs close to 1.1090.
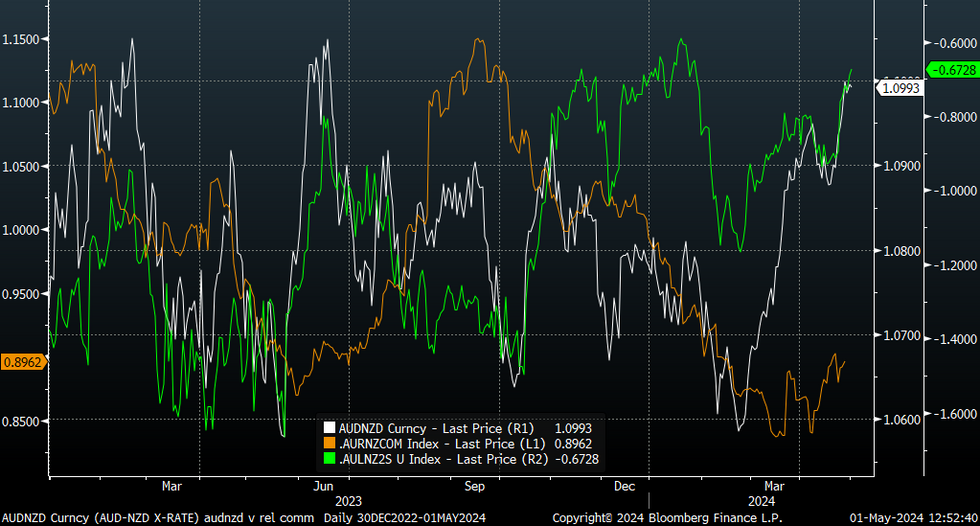
- AU-NZ 2yr swap differentials continue to track higher, last around -67bps, still sub earlier 2024 highs, see the chart below. Relative commodity prices have also improved in AUD's favor, aided by the iron ore bounce. NZ dairy prices are also off recent highs. The other line on the chart is AU to NZ commodity prices.
- The next major event for the cross is next week's RBA decision. No changes are expected, but the RBA tone will be eyed closely given recent stronger than expected Q1 inflation pressures.
Fig 1: AUD/NZD Versus AU-NZ 2yr Swap Spreads, & Relative Commodity Prices

Source: DB/CBA/MNI - Market News/Bloomberg
OIL: Crude Continues Slide Ahead Of Fed, Israel-US Meetings & EIA Data
Oil prices have continued to sink during APAC trading today ahead of the Fed decision later. Also US secretary of state Blinken is in Israel for discussions with Netanyahu and other government officials. There is hope that a Gaza ceasefire deal will be agreed, the prospect of which has eroded oil’s geopolitical risk premium this week. A rise in US crude stocks and stronger US inflation indicators have also pressured markets. The stronger USD is also weighing on prices with the index up another 0.1%.
- WTI is down 1.0% today to $81.12/bbl after a low of $81.06. It has traded below support at $81.20 for most of the session. Brent is 0.9% lower at $85.57/bbl close to the low of $85.54 but it remains above support at $85.32. Volumes have been light given most of Asia is closed for holidays.
- Bloomberg reported that US crude inventories rose 4.91mn barrels last week but gasoline fell 1.48mn and distillate -2.19mn, according to people familiar with the API data. The official EIA figures are released today.
- Later the Fed decision is announced (see MNI Fed Preview) and April ADP employment, ISM/PMI manufacturing and March JOLTS job openings print. UK April manufacturing PMI is released, while Europe ex UK is closed.
GOLD: Steady After Yesterday’s Large Drop, Eyes On The FOMC
Gold is little changed in the Asia-Pac session, after closing 2.1% lower at $2286.25 on Tuesday.
- Bullion's drop reflected a sharp rise in US Treasury yields after Q1 ECI printed hotter than expected. The employment cost index (ECI), which is closely monitored by the Federal Reserve, rose by 1.2% in Q1 versus +0.9% est.
- The unexpected strength in inflation-related data added weight against any potential rate cuts ahead of the FOMC Policy Decision later today.
- Analysts generally look for a more hawkish message from the FOMC in May compared with March, in light of strong inflation and economic activity data. Powell is expected to tilt more cautious on the inflation outlook than in previous appearances, with potential flashpoints for markets including whether he acknowledges that 3 cuts are less likely to be the base case for the FOMC in 2024, and/or whether June is too early for the first cut.
- According to MNI’s technicals team, the 20-day EMA has given way, signalling scope for an extension towards the 50-day EMA at $2239.90.
- ETF holdings continue to pull lower, with related participants continuing to trim exposure during the rally from the early October lows.
ASIAN EQUITY FLOWS: Mixed End For April Offshore Flows, Trend Still Positive For China
In the final trading day of April, Asian equity flows were mixed. We saw northbound stock connect outflows from China. Still the trend for the past 5-days remains strong, see the table below.
- The market may also take comfort from details from the Politburo meeting, with efforts to revive demand and address housing market problems key focus points. Note onshore markets are closed today, re-opening next Monday after the Labor day break.
- Even with weakness yesterday in the CSI 300 we are above all key EMAs, and finished April above the 3600 level.
- Elsewhere, trends in the tech sensitive markets of South Korea and Taiwan remained positive, albeit more modest compared to previous session. The 5-day trends for both markets remains firm.
- The higher yield backdrop in Tuesday US trade (post firmer data) weighed on tech equity sentiment. We also have the Fed decision later on Wednesday.
- Indonesian flows were more positive yesterday, but the trend has been negative for the past week. Finally, we saw a large outflow from the Philippines to end the month. Philippine equities fell 1% yesterday.
| Yesterday | Past 5 Trading Days | 2024 To Date | |
| China (Yuan bn)* | -8.6 | 29.7 | 74.2 |
| South Korea (USDmn) | 131 | 871 | 13983 |
| Taiwan (USDmn) | 37 | 1960 | -99 |
| India (USDmn)** | 1 | -188 | 40 |
| Indonesia (USDmn) | 45 | -193 | 568 |
| Thailand (USDmn) | 26 | 55 | -1825 |
| Malaysia (USDmn) | 95 | 132 | -513 |
| Philippines (USDmn) | -287 | -292.6 | -250 |
| Total (Ex China USDmn) | 46 | 2345 | 11903 |
| * Northbound Stock Connect Flows | |||
| ** Data Up To Apr 29 |
Source: MNI - Market News/Bloomberg
SOUTH KOREA DATA: Trade Growth Firms, But As Expected, US Export Share Continues To Rise
Full month April trade figures for South Korea were reasonably close to market expectations. Export growth was 13.8% y/y (consensus was 15.0%, prior 3.1%). Imports rose 5.4% y/y, against a 6.8% forecast and -12.3% prior. The trade balance was in surplus at $1.5bn, slightly above expectations but down from the prior $4.291bn print.
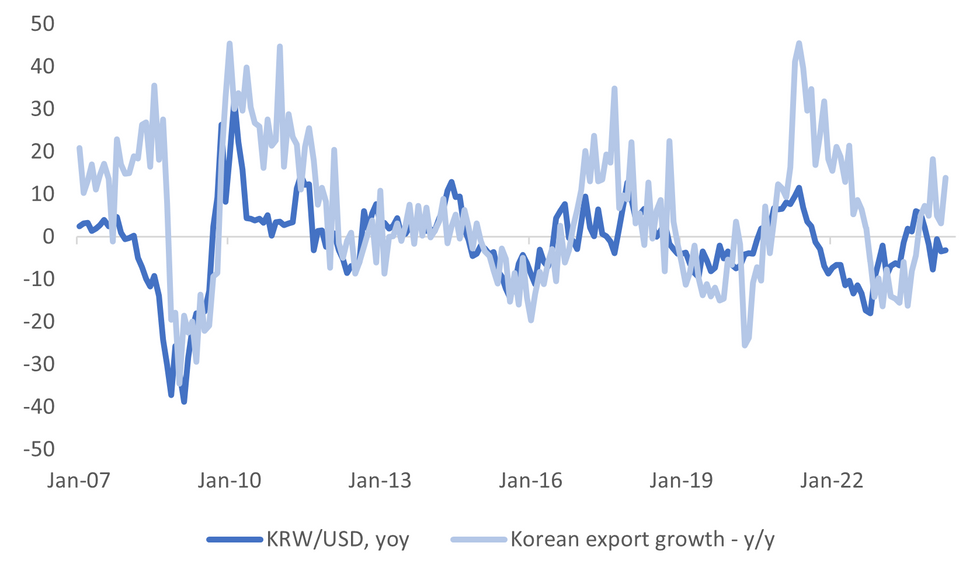
- Earlier data for the month hinted at a resilient export backdrop for April. The won still looks too weak relative to the better export trend, see the chart below. Shifting Fed expectations, coupled with domestic capital outflows, are providing a clear offset.
- Chip exports remain a source of strength, up 56% y/y, the March read was 35.7%. Base effects still remain favorable for the next few months for y/y momentum.
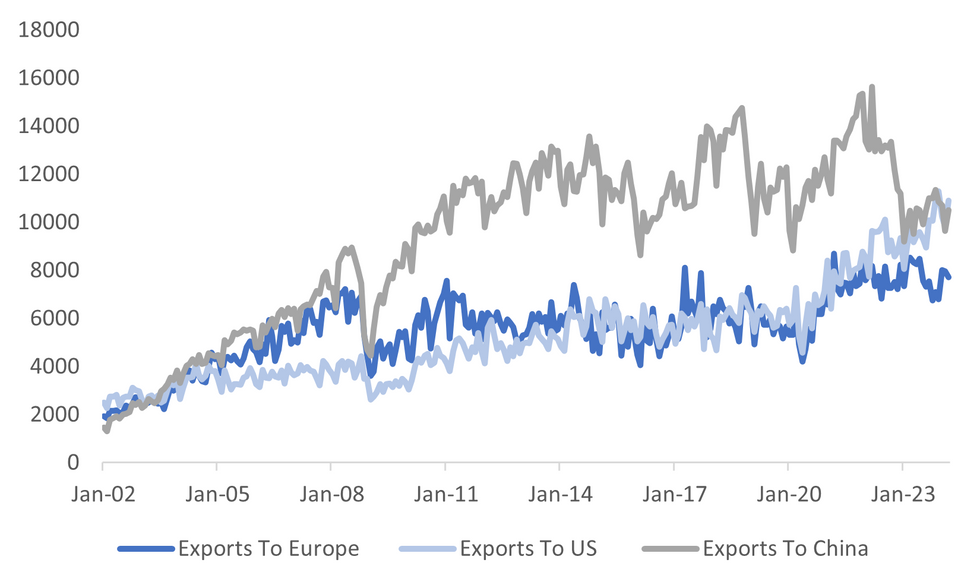
- Exports to the US rose 24% y/y, up from March's pace of 11.6%. Export levels to the US hit a fresh record high. Export momentum continued to recover to China as well, up 9.9% y/y, from around flat in March.
- Base effects should support a further recovery in exports to China (in y/y terms), although the trend has clearly been towards more exports to the US, relative to China in recent years, see the second chart below.
- Despite the import bounce and the lower trade surplus, the trend around the trade surplus remains healthy for now.
Fig 1: South Korean Export Growth & KRW/USD Y/Y Trends

Source: MNI - Market News/Bloomberg
Fig 2: South Korean Export Trends By Major Economy - USDmn

Source: MNI - Market News/Bloomberg
UP TODAY (TIMES GMT/LOCAL)
| Date | GMT/Local | Impact | Flag | Country | Event |
| 01/05/2024 | 0830/0930 | ** |  | UK | S&P Global Manufacturing PMI (Final) |
| 01/05/2024 | 0900/1000 | ** |  | UK | Gilt Outright Auction Result |
| 01/05/2024 | 1100/0700 | ** |  | US | MBA Weekly Applications Index |
| 01/05/2024 | - | *** |  | US | Domestic-Made Vehicle Sales |
| 01/05/2024 | 1215/0815 | *** |  | US | ADP Employment Report |
| 01/05/2024 | 1230/0830 | *** |  | US | Treasury Quarterly Refunding |
| 01/05/2024 | 1345/0945 | *** |  | US | IHS Markit Manufacturing Index (final) |
| 01/05/2024 | 1400/1000 | *** |  | US | ISM Manufacturing Index |
| 01/05/2024 | 1400/1000 | * |  | US | Construction Spending |
| 01/05/2024 | 1400/1000 | *** |  | US | JOLTS jobs opening level |
| 01/05/2024 | 1400/1000 | *** |  | US | JOLTS quits Rate |
| 01/05/2024 | 1430/1030 | ** |  | US | DOE Weekly Crude Oil Stocks |
| 01/05/2024 | 1800/1400 | *** |  | US | FOMC Statement |
| 01/05/2024 | 2015/1615 |  | CA | BOC Governor at Senate Banking Committee |
To read the full story
Sign up now for free trial access to this content.
Please enter your details below.
Why MNI
MNI is the leading provider
of intelligence and analysis on the Global Fixed Income, Foreign Exchange and Energy markets. We use an innovative combination of real-time analysis, deep fundamental research and journalism to provide unique and actionable insights for traders and investors. Our "All signal, no noise" approach drives an intelligence service that is succinct and timely, which is highly regarded by our time constrained client base.Our Head Office is in London with offices in Chicago, Washington and Beijing, as well as an on the ground presence in other major financial centres across the world.
