
Why MNI
MNI is the leading provider
of intelligence and analysis on the Global Fixed Income, Foreign Exchange and Energy markets. We use an innovative combination of real-time analysis, deep fundamental research and journalism to provide unique and actionable insights for traders and investors. Our "All signal, no noise" approach drives an intelligence service that is succinct and timely, which is highly regarded by our time constrained client base.Our Head Office is in London with offices in Chicago, Washington and Beijing, as well as an on the ground presence in other major financial centres across the world.
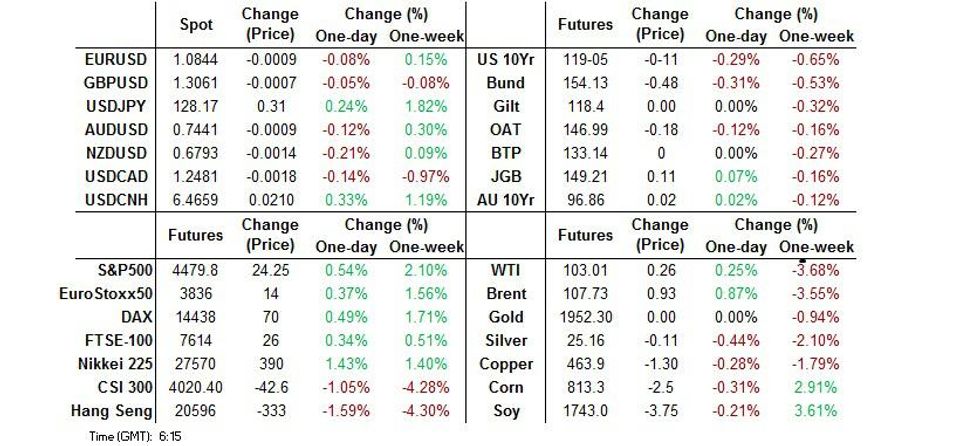
- Asia-Pac participants were happy to sell Wednesday's Tsy rally, while macro headline flow was limited in Asia. ECB's Wunsch sounded hawkish in early London hours, while Macron beat out Le Pen when it came to the early polls in the wake of last night's French Presidential debate.
- The kiwi dollar sank after New Zealand's Q1 inflation data missed expectations. The annual rate of price growth rose to a multi-decade high of +6.9% Y/Y, slightly below the median estimate of +7.1%. The data failed to move the needle when it comes to RBNZ rate-hike pricing, as data confirmed that price pressures remain acute, with key metrics of core inflation (tradable CPI & sectoral factor model) advanced to fresh all-time highs.
- U.S. weekly jobless claims & final EZ CPI will take focus later today, alongside comments from Fed's Powell, ECB's Lagarde and BoE's Bailey & Mann.
US TSYS: Cheaper Overnight
Asia-Pac participants were seemingly comfortable when it came to selling into Wednesday’s European/NY richening. That leaves the major cash Tsy benchmarks 3.0-4.5bp cheaper on the day into London dealing, with the belly leading the way lower, while TYM2 is -0-09 at 119-07, 0-03 off session lows.
- It wasn’t all one-way trade, with a light early Asia bid developing on the back of an evacuation of the U.S. Capitol, which was later deemed to be a false alarm surrounding a plane and parachute jump at a nearby sporting event.
- Broader macro headline flow was light, with one of Russian President Putin’s staunchest allies pointing to the fall of the Ukrainian city of Mariupol at some point today.
- Overnight flow was dominated by and FV/UXY flattener block (-6,718/+2,734)
- Looking ahead, Thursday will see the latest Philly Fed business survey and weekly jobless claims data cross, with Fedspeak from Powell & 5-Year TIPS supply also due.
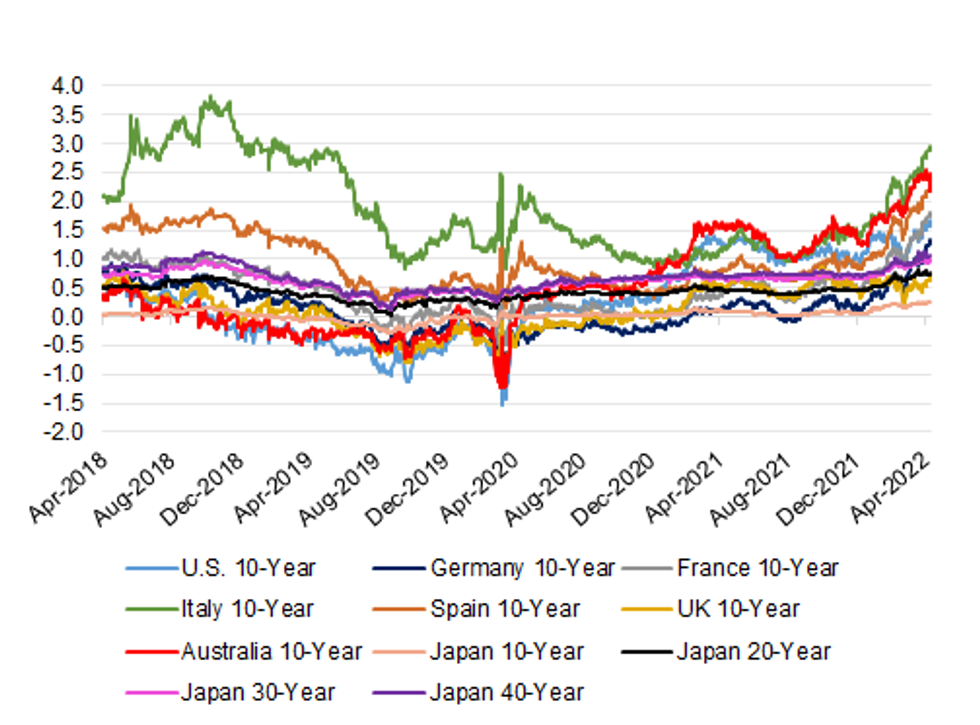
BONDS: An Overview Of The Global Bond Landscape From Japan
The recent failure of 10-Year U.S. Tsy yields when it comes to breaching the 3.00% yield marker is generating some discussion re: the formation of a potential short-term top in the space. Could that be enough to lure Japanese investors back into the international bond space?
- Japanese investors have been relatively neutral when it comes to net flows surrounding foreign bonds over the first two full weeks of the new Japanese FY.
- While there are plenty of FX-hedged yield pickups on offer for Japanese investors there are several matters that we should be aware of.
- A 3-month FX-hedged approach to investments may allow the Japanese investor base to be nimble enough to deal with market gyrations, while evading the more extreme hedging costs related to longer horizons. However, this may note provide a long enough horizon for the investor base to deploy meaningful levels of capital.
- Other factors that may mitigate the potential for the deployment of Japanese capital offshore include the relative steepness of the JGB yield curve (aided by the BoJ’s commitment to its current YCC settings), the risk of the well-documented global inflationary pressures become more entrenched & impacting yields, prolonged BoJ easing impacting the cost of the roll of FX-hedging if investors decide to hold a position for longer than initially expected and the threat of continued market vol.
- Focus now moves to the semi-annual investment intentions declarations from the Japanese life insurer community, which should cross over the next couple of weeks.
- Note that the following tables & charts use 3-month FX hedging costs from the perspective of a Japanese investor.
| FX-Hedged Yield For Japanese Investor (%) | Conventional Yield (%) | FX-Hedged Pickup Vs. 10-Year JGB Yields (%) | |
|---|---|---|---|
| U.S. 10-Year | 1.5759 | 2.8532 | 1.3249 |
| Germany 10-Year | 1.2669 | 0.8550 | 1.0159 |
| France 10-Year | 1.7451 | 1.3340 | 1.4941 |
| Italy 10-Year | 2.9188 | 2.5080 | 2.6678 |
| Spain 10-Year | 2.2113 | 1.8000 | 1.9603 |
| UK 10-Year | 0.6508 | 1.9150 | 0.3998 |
| Australia 10-Year | 2.1848 | 3.0637 | 1.9338 |
| Japan 10-Year | -- | 0.2510 | -- |
| Japan 20-Year | -- | 0.7650 | -- |
| Japan 30-Year | -- | 0.9650 | -- |
| Japan 40-Year | -- | 1.0500 | -- |
 Source: MNI - Market News/Bloomberg
JGBS: Twisting Steeper After Soft Liquidity Enhancement Auction For Long OTRs
The longer end of the JGB curve struggled in afternoon dealing after the latest 15.5- to 39-Year liquidity enhancement auction saw a very wide tail (albeit with a more favourable average yield spread when compared to the previous auction), while the cover ratio remained little changed around the 2.00x level. Market vol. and a relative lack of BoJ control over the area of the curve covered by the liquidity enhancement auction, and the fact that liquidity enhancement auctions cover the less liquid, off-the run JGBs, likely limited bidders when it came to the overall aggression shown at today’s auction, resulting in the wide tail. The curve has twisted steeper on the day post-auction, pivoting around 10s.
- Futures are off of post-auction reaction lows, but still sit comfortably below late morning levels, last +8. Note that futures had already softened a little during the morning session, owing to the move in U.S. Tsys.
- Note that 10-Year JGB yields remain pinned to the 0.25% mark, even with the BoJ outlining its plan to enforce the top end of its permitted -/+0.25% trading band over the next few sessions (after being drawn into the market yesterday).
- Messrs Kuroda & Suzuki offered little new of the FX front, with Suzuki stressing that the matter didn’t present a major point of discussion in the latest G7 FinMin & central banker meeting.
- Elsewhere, local reports noted that Japan’s ruling LDP and its junior coalition partner have agreed to compile an extra budget for FY22, as the government seeks to finance a relief package that is focused on alleviating the inflationary burden faced by households and businesses.
- National CPI & flash PMI data headlines Friday’s domestic docket.
AUSSIE BONDS: Cross-Market Matters At The Fore
Marginally softer than expected NZ CPI data provided an early Sydney bid (note that the +6.9% Y/Y reading still represented a multi-decade high, missing by 0.2ppt vs. BBG consensus), before the aforementioned weakness in U.S. Tsys dragged the space away from best levels, with the sell off accelerating as we move towards the last hour of Sydney dealing. The latest leg lower may have been aided by the uptick in the latest RBNZ sectoral factor inflation reading (+4.2% Y/Y vs. +3.8% in Q4), in what would have been a second round of trans-Tasman impetus observed during the session.
- That leaves YM -3.5 & XM +1.5, as the front end feels the brunt of the pressure and the curve twist flattens. 7s provided the pivot point in cash ACGB trade, with longer dated cash ACGBs running ~3bp richer at typing.
- The 3-/10-Year EFP box has steepened on the day.
- There wasn’t anything in the way of immediate reaction to the latest uptick in the 3-month BBSW fixing.
- Bills are 3-11 ticks lower through the reds, with weakness there accelerating as YM pulled lower.
- Prelim PMI data and the release of the weekly AOFM issuance slate will headline domestic matters on Friday.
JAPAN: Japanese Flows Relatively Neutral On Foreign Assets, Foreigners Buy Japan
Japanese weekly international security flow data revealed limited net flows into international bonds and equities on the part of Japanese investors during last week.
- International investor flows surrounding Japanese investors were more interesting.
- Foreign investors lodged a second consecutive weekly round of net purchases of Japanese bonds, aided by the BoJ’s support for its YCC settings (which has been tested once again this week) and perhaps by the relative steepness of the JGB curve/x-ccy basis related yield pickups.
- Elsewhere, foreign investors lodged a third consecutive week of net purchases of Japanese equities.
- Note that net purchases of Japanese bonds and equities on the part of foreign investors pulled back from the levels observed in the previous week.
| Latest Week | Previous Week | 4-Week Rolling Sum | |
|---|---|---|---|
| Net Weekly Japanese Flows Into Foreign Bonds (Ybn) | -72.7 | 10.2 | -2431.9 |
| Net Weekly Japanese Flows Into Foreign Stocks (Ybn) | 58.0 | -1146.7 | -1845.4 |
| Net Weekly Foreign Flows Into Japanese Bonds (Ybn) | 1224.9 | 874.4 | -1633.6 |
| Net Weekly Foreign Flows Into Japanese Stocks (Ybn) | 406.5 | 1675.3 | 2374.4 |
Source: MNI - Market News/Bloomberg/Japanese Ministry Of Finance
FOREX: Yen Sales Resume, Kiwi Takes Hit From CPI Miss
The kiwi dollar sank after New Zealand's Q1 inflation data missed expectations. The annual rate of price growth rose to a multi-decade high of +6.9% Y/Y, slightly below the median estimate of +7.1%. The data failed to move the needle when it comes to RBNZ rate-hike pricing, as data confirmed that price pressures remain acute, with key metrics of core inflation (tradable CPI & sectoral factor model) advanced to fresh all-time highs.
- NZD weakness spilled over into its Antipodean cousin, which struggled to regain poise, even as firmer crude oil prices lent support to CAD and NOK. A rally in AUD/NZD was capped by the psychologically significant NZ$1.1000 figure and the rate pared gains.
- Participants returned to dumping the yen, which landed at the bottom of the G10 pile. Better risk backdrop sapped strength from the embattled currency, despite continued warnings from Japanese officials.
- Offshore yuan caught a bid after an in-line yuan fixing from the PBOC, which came on the heels of strong weak bias in yesterday's fixing. Spot USD/CNH bounced later in the session, soaring to fresh multi-month highs.
- U.S. weekly jobless claims & final EZ CPI will take focus later today, alongside comments from Fed's Powell, ECB's Lagarde and BoE's Bailey & Mann.
FOREX OPTIONS: Expiries for Apr21 NY cut 1000ET (Source DTCC)
- EUR/USD: $1.0700(E920mln), $1.0800(E871mln), $1.0900-05(E3.2bln), $1.0925-35(E578mln), $1.1000(E1.3bln)
- USD/JPY: Y124.85-00($1.4bln)
- GBP/USD: $1.3050(Gbp860mln)
- AUD/USD: $0.7400-20(A$954mln)
- USD/CAD: C$1.2500($770mln), C$1.2650($565mln)
ASIA FX: In-Line PBOC Fix Brings Short-Lived Reprieve To Yuan
The yuan showed some volatility around the PBOC fix in a generally mixed session for USD/Asia crosses.
- CNH: Offshore yuan briefly strengthened as the PBOC set the mid-point of permitted USD/CNY trading band virtually in line with sell-side expectations. The uninspiring fixing came on the heels of fairly strong weak bias (~100 pip deviation) displayed by the PBOC on Wednesday. While this return to normalcy signalled the PBOC's measured approach in managing yuan moves, resultant redback strength proved short-lived. Spot USD/CNH staged a dynamic rebound, rallying to its best levels since Oct 6.
- KRW: Spot USD/KRW crept higher, despite solid preliminary trade data released out of South Korea. Shipments grew 16.9% Y/Y in the first 20 days of the month, driven by buoyant demand for semiconductors.
- IDR: The rupiah firmed at the margin, struggling to find notable catalysts. Indonesian Planning Min Monoarfa said the government targets 2023 GDP growth of +5.3%-5.9% Y/Y.
- MYR: Spot USD/MYR continued its sharp rally, but failed to take out yesterday's multi-month high of MYR4.2915. Malaysia's CPI data will hit the wires tomorrow.
- PHP: Spot USD/PHP edged lower. Philippine FinSec Dominguez said that the authorities are watching the pace of policy normalisation in the U.S. as they are drafting their own stimulus withdrawal plans. He also outlined ambitious growth targets, pointing to the need to reduce debt burden associated with Covid-19.
- THB: The baht weakened, but stayed within a familiar range. Spot USD/THB printed fresh multi-month highs on Wednesday.
EMERGING MARKETS: Geopolitical Uncertainty, USD Strength Leave Equities Vulnerable (1/2)
- The deceleration in Chinese economic activity, strong momentum on the USD amid elevated uncertainty and more recently the deterioration in the Russia/Ukraine conflict have been weighing on EM equities in the past year.
- EM equities are down over 11% since the start of the year, driven by the weakness in Asia (ex-Japan) and CEEMEA equities.
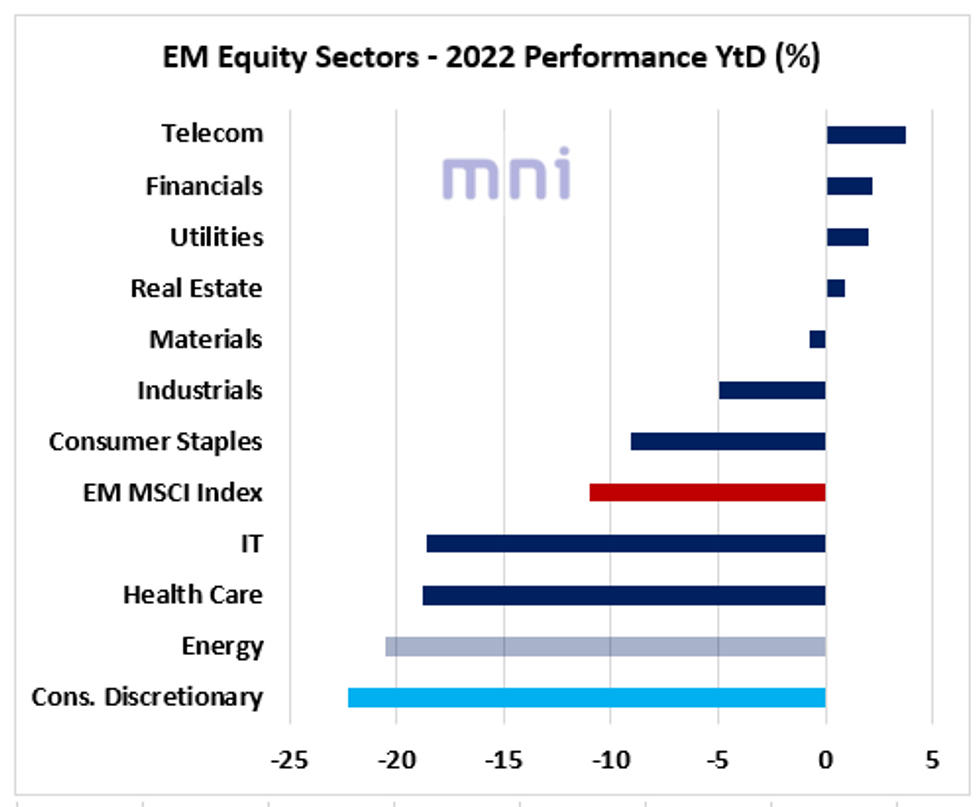
- The chart below shows the performance of equity sectors since the start of the year.
- Defensive sectors Telecom and Utilities stand among the best performing equity sectors this year, up 3.8% and 2%, respectively, and significantly outperforming the EM equity market.
- In addition, the sharp increase LT bond yields have been supporting financial equities, up 2.2%.
- We recently noted the divergence between EM banks, which have outperformed the equity market, and Europe/US banks, which have been underperforming the market despite the significant surge in LT yields.
Source: Bloomberg/MNI.
EMERGING MARKETS: Geopolitical Uncertainty, USD Strength Leave Equities Vulnerable (2/2)
- At the bottom, we find that consumer discretionary equities continue to remain vulnerable, down over 22% since the start of the year.
- Consumer Discretionary remains the worst performing sector in the past year as consumer confidence indicators continue to stand at 'depressed' levels due to Covid uncertainty and surging inflation.
- Health care and IT sectors have also been performing poorly since the start of the year, both down over 18% in 2022.
- Consumer Discretionary remains the worst performing sector in the past year as consumer confidence indicators continue to stand at 'depressed' levels due to Covid uncertainty and surging inflation.
- EM IT equities have been significantly impacted by China crackdowns on tech sector.
- We are leaving the energy sector on the side for now as we are not confident that the performance of the EM energy sub index reflects the performance of the sector given the significant rise in energy this year.
- One explanation could be that all the losses occurred during the start of the Ukraine war, driven by the fall in Russia energy companies. Hence, MSCI new weighing following the collapse of Russian assets did not readjust the February/March losses, therefore the MSCI EM Energy sub-index still remains very low despite the positive bounce in energy stocks in most EM economies.

Source: Bloomberg/MNI.
EQUITIES: Mixed As Hong Kong, Chinese Equities Notch One-Month Lows
Major Asia-Pac equity indices are mixed, tracking a similarly mixed lead from Wall St. Chinese and Hong Kong equities struggled, with sentiment in the former softening as a relatively slow pace of easing in pandemic control measures continues to mix with recent disappointment re: smaller-than-expected policy easing.
- The Hang Seng sits 1.7% lower at typing, hitting fresh five-week lows in the process. China-based tech underperformed, with the Hang Seng Tech Index (-3.6%) following the NASDAQ Golden Dragon China Index (-4.8%) lower. To elaborate, worry surrounding a possible de-listing of Chinese ADRs over previously-flagged audit disputes continues to rise, with BBG data pointing to a falling proportion of shares circulating in the U.S. vs. Hong Kong for several large cap names.
- The CSI 300 deals 1.4% weaker at typing, operating at one-month lows and on track for a fourth straight day of declines.
- The Nikkei 225 outperformed, dealing 1.0% firmer at typing on gains in large caps Tokyo Electron, Fast Retailing, and Daikin Industries. Semiconductor and export-related names caught a bid as the JPY has weakened in Asia-Pac dealing, while sentiment in energy and utilities was notably weaker.
- U.S. e-mini equity index futures are 0.3% to 0.6% better off at typing, led by gains in NASDAQ contracts after closing lower on Wednesday. A note that Dow Jones e-minis are on track for a third straight day of gains, mirroring recent outperformance in the underlying cash index as its peer indices (the S&P500 and Nasdaq 100) have come under pressure from severe sell-offs in tech-related names such as Netflix (-35.1%).
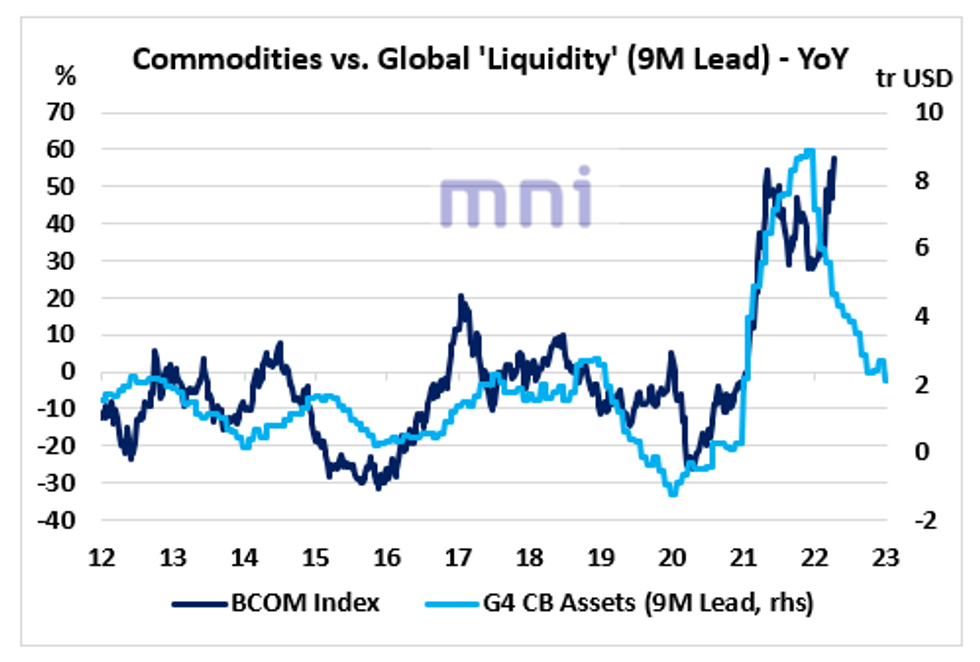
COMMODITIES: Another Bear Chart For Commodities
- Investors have been questioning if the trend in commodity prices could persist in the medium term as global demand keeps weakening and a growing range of ‘fundamental’ indicators keep pricing in ‘cheaper’ commodities. that the sharp.
- We have seen that commodity prices have been constantly reaching new highs despite China imports plunging in recent months.
- As China represents over 50% of the total demand for some commodities (i.e. copper), the two times series have historically strongly co-moved together in the past 20 years.
- The chart below shows that the sharp decrease in the annual change in ‘liquidity’ (G4 CB assets) has been also pricing in ‘cheaper’ commodities in the coming months.
- Significant changes in central banks’ total assets have strongly led commodity prices in the past cycle (by 9 months).
Source: Bloomberg/MNI..
GOLD: Lower In Asia; Haven Demand Provides Some Support
Gold is ~$6/oz worse off to print $1,952/oz at writing, operating below Wednesday’s best levels amidst an uptick in nominal U.S. Tsy yields.
- To recap, the precious metal rose from one-week lows on Wednesday to close at session highs ~$8/oz firmer, aided by U.S. real yields broadly backing away from recent highs, with U.S. 10-Year real yields closing below neutral levels after a brief sojourn into positive territory for the first time since early ‘20.
- Gold has operated clear above its March troughs despite a nearly one-way surge in U.S. real yields over the same period, likely finding some support from rising demand for havens. Concern over geopolitical risks (i.e. the Russia-Ukraine conflict) and the ability of central banks to control inflation without crimping economic growth remains elevated, particularly after global economic growth downgrades by the World Bank and the International Monetary Fund (IMF) earlier this week.
- Known ETF holdings of gold continue to record fresh highs for ‘22, suggesting strong demand for the yellow metal (although the metric remains below its previous peak in Oct ‘20).
- From a technical perspective, a bearish reversal is on the cards for gold following its pullback from recent highs. Initial support is seen around ~$1,925.2/oz, (50-Day EMA), while resistance is some distance away at $1,998.4/oz (Apr 18 high and bull trigger).
OIL: A Little Higher In Asia
WTI is ~+$1.00 and Brent is ~+$1.10, operating around the upper end of their respective ranges for Wednesday at typing.
- Both benchmarks closed virtually unchanged on Wednesday, with familiar concerns re: demand destruction (arising from lowered global growth forecasts and China’s ongoing COVID outbreak) countering well-documented worry over tight global crude supplies.
- Looking to China, a straightforward recovery in industrial activity seems unlikely despite a phased re-opening of factories in affected regions, with initial reports pointing to difficulties in resuming production owing to supply chain disruptions, with some factories re-entering lockdowns as well (e.g. Taiwan’s Unimicron Technology suspended production from today to Apr 27, just one day after emerging from their previous suspension on Apr 19).
- Elsewhere, the latest round of U.S. EIA data crossed on Wednesday, showing a large, surprise drawdown in crude inventories (~8mn bbl drawdown vs WSJ median 2.2mn build) that was attributed to a surge in U.S. oil exports to over two-year highs, coming as a larger than expected drawdown in distillate stocks was observed as well. A decline in gasoline stockpiles came in largely within expectations, while Cushing hub inventories edged downwards.
- The drawdown in crude and distillate inventories largely corroborated reports of Tuesday’s API inventory estimates of the same, while differing on gasoline and Cushing hub stockpile figures.
UP TODAY (Times GMT/Local)
| Date | GMT/Local | Impact | Flag | Country | Event |
| 21/04/2022 | 0645/0845 | ** |  | FR | Manufacturing Sentiment |
| 21/04/2022 | 0900/1100 | *** |  | EU | HICP (f) |
| 21/04/2022 | - | | EU | ECB Lagarde & Panetta in IMF/World Bank Meetings | |
| 21/04/2022 | 1230/0830 | ** |  | US | Jobless Claims |
| 21/04/2022 | 1230/0830 | ** | | US | Philadelphia Fed Manufacturing Index |
| 21/04/2022 | 1230/0830 | ** | | US | WASDE Weekly Import/Export |
| 21/04/2022 | 1300/1400 |  | UK | BOE Mann Speaks at BOE Webinar | |
| 21/04/2022 | 1400/1600 | ** | | EU | Consumer Confidence Indicator (p) |
| 21/04/2022 | 1430/1030 | ** | | US | Natural Gas Stocks |
| 21/04/2022 | 1500/1100 | | US | Fed Chair Jerome Powell | |
| 21/04/2022 | 1530/1130 | ** | | US | NY Fed Weekly Economic Index |
| 21/04/2022 | 1530/1130 | ** | | US | US Bill 04 Week Treasury Auction Result |
| 21/04/2022 | 1530/1130 | * | | US | US Bill 08 Week Treasury Auction Result |
| 21/04/2022 | 1630/1730 | | UK | BOE Bailey at Peterson Institute Event | |
| 21/04/2022 | 1630/1230 | | US | St. Louis Fed's James Bullard | |
| 21/04/2022 | 1700/1300 | ** | | US | US Treasury Auction Result for TIPS 5 Year Note |
| 21/04/2022 | 1700/1300 | | US | Fed Chair Jerome Powell | |
| 21/04/2022 | 1700/1900 | | EU | ECB Lagarde at IMF Debate |
Why MNI
MNI is the leading provider
of intelligence and analysis on the Global Fixed Income, Foreign Exchange and Energy markets. We use an innovative combination of real-time analysis, deep fundamental research and journalism to provide unique and actionable insights for traders and investors. Our "All signal, no noise" approach drives an intelligence service that is succinct and timely, which is highly regarded by our time constrained client base.Our Head Office is in London with offices in Chicago, Washington and Beijing, as well as an on the ground presence in other major financial centres across the world.