
Why MNI
MNI is the leading provider
of intelligence and analysis on the Global Fixed Income, Foreign Exchange and Energy markets. We use an innovative combination of real-time analysis, deep fundamental research and journalism to provide unique and actionable insights for traders and investors. Our "All signal, no noise" approach drives an intelligence service that is succinct and timely, which is highly regarded by our time constrained client base.Our Head Office is in London with offices in Chicago, Washington and Beijing, as well as an on the ground presence in other major financial centres across the world.
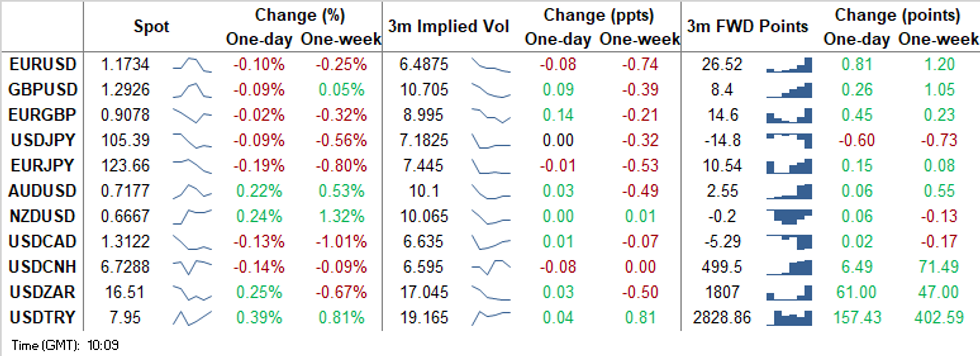
FOREX SUMMARY
A mixed session for FX this morning.
- Safer asset, like Core bonds, Gold and of course the USD were initially favoured, as US stimulus, Covid cases, J&J and Eli Lilly & Co, pausing their studies have limited Equity upside.
- Nonetheless, Equities slowly reversed the small early pressure, to trade back into green territory.
- As such, USD reversed early gains and trade mix against G10
- Biggest move of the day was seen in the GBP, when Cable spiked some 69 pips, following a headline hitting our screens:
- "UK signals it won't walk from EU trade talks".
- Cable spiked from 1.2907 to 1.2976, but there was nothing really new in the story, and Cable settled back towards 1.2927, now at 1.2930 at the time of typing.
- Turnovers have been below averages, around 30% versus 5 days.
- Looking ahead, Earning season continues, with BofA, UTD Health and Wells.
- Speaker's schedule is packed, with ECB Mersch, Lane, Villeroy, and de Cos. Fed Barkin, Clarida, Quarles, Logan, and Kaplan. BoE Haldane is also set to speak.
- ALL EYES are on the call between EU Ursula and UK Boris, but no official timing has been released.
- On the data front, US PPI is the highlight
TECHNICALS:
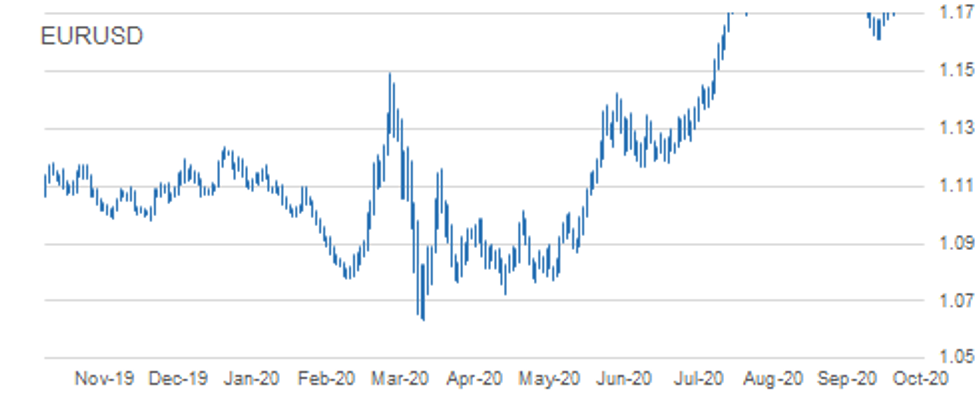
EUR/USD: Testing Key Short-Term Support
- RES 4: 1.2011 High Sep 1 and major resistance
- RES 3: 1.1917 High Sep 10 and 76.4% of the Sep 1 - 25 sell-off
- RES 2: 1.1859 61.8% retracement of the Sep 1 - 25 sell-off
- RES 1: 1.1817/31 High Oct 13 / High Oct 10 and the bull trigger
- PRICE: 1.1729 @ 10:28 BST Oct 14
- SUP 1: 1.1725 Low Oct 7 and key near-term support
- SUP 2: 1.1685 Low Sep 30
- SUP 3: 1.1612/1581 Low Sep 25 and the bear trigger / Low Jul 24
- SUP 4: 1.1584 100-dma
EURUSD reversed course Tuesday selling off sharply. Attention is on the near-term key support that lies at 1.1725, Oct 7 low. It has been tested this morning. A break of this level would negate recent bullish signals and signal scope for deeper pullback, exposing support at 1.1612, Sep 25 low and the key bear trigger. If 1.1725 holds, the focus will once again turn to key resistance at 1.1831, Oct 10 high. A break resumes recent bullish pressur
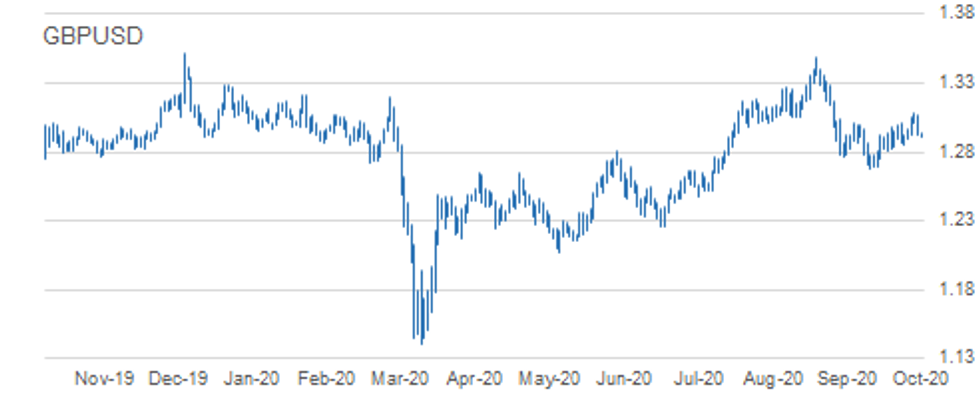
GBP/USD: Bounces Off The Day Low
- RES 4: 1.2280 High Sep 7
- RES 3: 1.3174 61.8% retracement of the Sep 1 - 23 sell-off
- RES 2: 1.3151 Former trendline support drawn off the Mar 20 low
- RES 1: 1.3083 High Oct 12
- PRICE: 1.2930 @ 10:35 BST Oct 14
- SUP 1: 1.2863 Intraday low
- SUP 2: 1.2846 Low Oct 7 and key near-term support
- SUP 3: 1.2806 Low Sep 30
- SUP 4: 1.2745 Low Sep 28
GBPUSD is choppy this morning, bouncing off the earlier low. Cable traded close to a key resistance at 1.3139 Tuesday. This marks the former trendline support that was breached on Sep 10 and intersects at 1.3151 today While this resistance remains intact, recent gains are likely a correction. A clear breach of 1.3151 would strengthen a bullish argument though. The key support to watch to signal a stronger reversal lower is 1.2846, Oct 7 low.
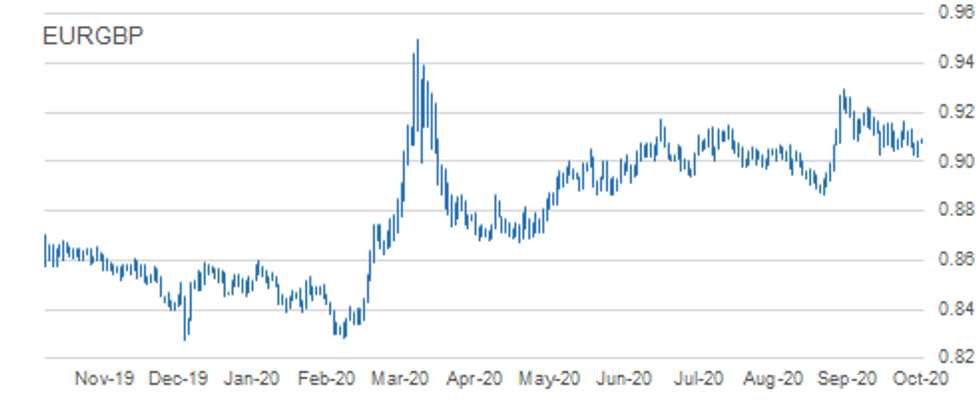
EUR/GBP: Unable Still To Maintain Levels Above Trendline Resistance
- RES 4: 0.9190 61.8% retracement of the Sep 11 - 28 sell-off
- RES 3: 0.9162 High Oct 7 and the bull trigger
- RES 2: 0.9132 High Oct 10
- RES 1: 0.9122 Intraday high
- PRICE: 0.9067 @ 10:39 BST Oct 14
- SUP 1: 0.9020 Low Oct 13
- SUP 2: 0.9000 Round number support
- SUP 3: 0.8967 76.4% retracement of the Sep 3 - 11 rally
- SUP 4: 0.8808 Low May 13
EURGBP traded lower Tuesday but did find support at the day low. Despite the bounce, the outlook remains bearish. The continued inability to hold above trendline resistance drawn off the Sep 11 high weighs on the cross. Key support at 0.9025, Sep 28 low has been probed this week. A clear break would confirm a resumption of bearish trending conditions and open 0.8967, a retracement level. On the upside, firm resistance is at 0.9162, Oct 7 high.
USD/JPY: Pullback Considered A Correction
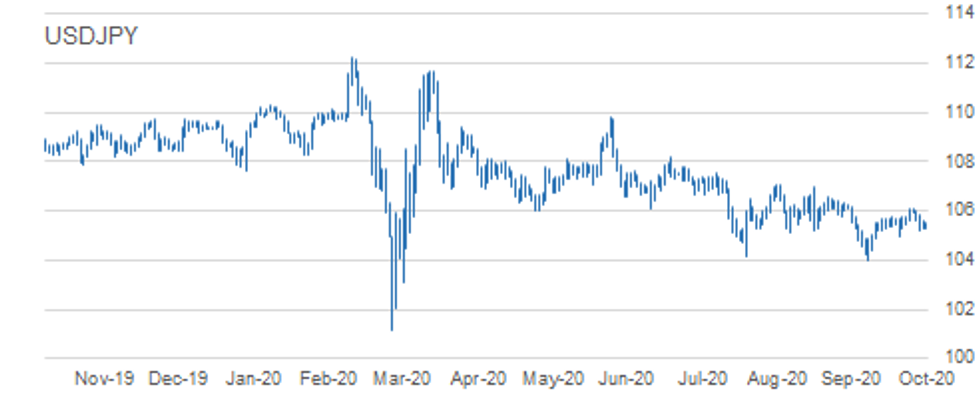
- RES 4: 106.62 Bear channel resistance drawn off the Mar 24 high
- RES 3: 106.55 High Sep 3
- RES 2: 106.11/38 High Oct 7 and the bull trigger / High Sep 8
- RES 1: 105.85 High Oct 12
- PRICE: 105.47 @ 10:42 BST Oct 14
- SUP 1: 105.24 Low Oct 12
- SUP 2: 104.94 Low Oct 2 and key near-term support
- SUP 3: 104.41 Low Sep 22
- SUP 4: 104.00 Low Sep 21 and the bear trigger
USDJPY is trading closer to recent lows following the pullback from last week's high of 106.11, Oct 7 high. Short-term weakness however is considered a correction following recent gains. Intraday momentum studies still point south however to strengthen a bearish theme price needs to trade below key support at 104.94, Oct 2 low. This would open 104.00, Sep 21 low. The bull trigger is at 106.11. A break resumes the recent uptrend.
EUR/JPY: Extends This Week's Sell-Off
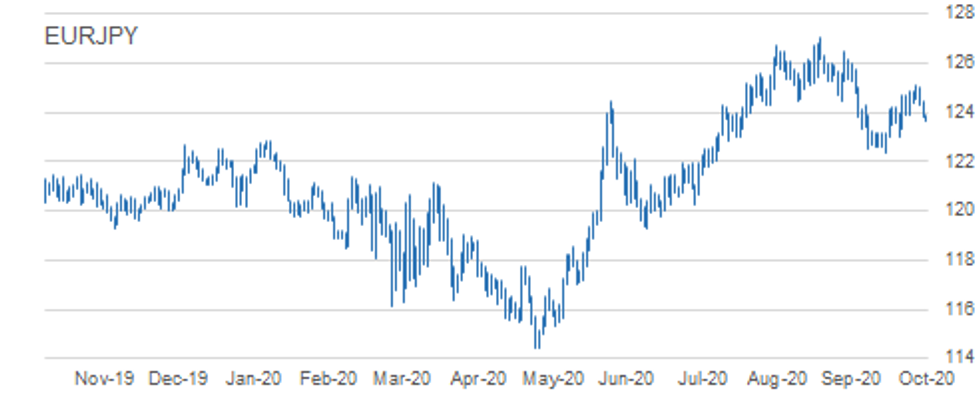
- RES 4: 126.46 High Sep 10 and a key resistance
- RES 3: 125.77 High Sep 15
- RES 2: 125.09/28 High Oct 9 / 61.8% of the Sep 1 - 28 sell-off
- RES 1: 124.48 High Oct 13
- PRICE: 123.61 @ 10:45 BST Oct 14
- SUP 1: 123.31 Low Oct 5
- SUP 2: 123.03 Low Sep 29 and Oct 2 and key near-term support
- SUP 3: 122.38/28 Low Sep 28 / 61.8% of the Jun 22 - Sep 1 rally
- SUP 4: 122.25 38.2% retracement of the May - Sep rally
EURJPY is off recent highs and still extending this week's move lower. While near term weakness is considered a correction, attention turns to support at 123.03, Oct 6 low with the former support at 123.86, Oct 6 low breached. The move below 123.86 strengthens the intraday bearish tone and clearance of 123.03 would highlight scope for a deeper pullback. Resistance has been defined at 125.09, Oct 9 high. A break is required to resume bullish pressure.
AUD/USD: Pulls Away From Trendline Resistance
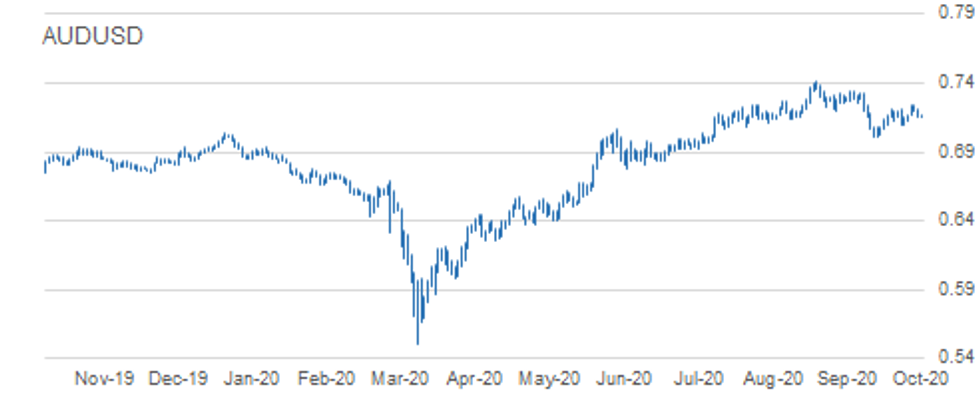
- RES 4: 0.7318 High Sep 21
- RES 3: 0.7258 61.8% retracement September Sell-Off
- RES 2: 0.7243 High Oct 10 and the intraday bull trigger
- RES 1: 0.7220 Trendline resistance drawn off the Sep 1 high
- PRICE: 0.7171 @ 10:48 BST Oct 14
- SUP 1: 0.7150 Low Oct 13
- SUP 2: 0.7096 Low Oct 7 and the near-term bear trigger
- SUP 3: 0.7070 Low Sep 29
- SUP 4: 0.7006 Low Sep 25 and the bear trigger
AUDUSD cleared resistance at 0.7209, Oct 1 and 6 high on Oct 9. This brought the pair into contact with trendline resistance drawn off the Sep 1 high. The line intersects at 0.7220 today. A move above the Oct 9 high of 0.7243 would confirm a breach of the line and reinforce S/T bullish conditions, opening 0.7258, a Fibonacci retracement. Tuesday's print below support at 0.7161, Sep 9 low however signals a failure at the trendline.
USD/CAD: Outlook Remains Bearish
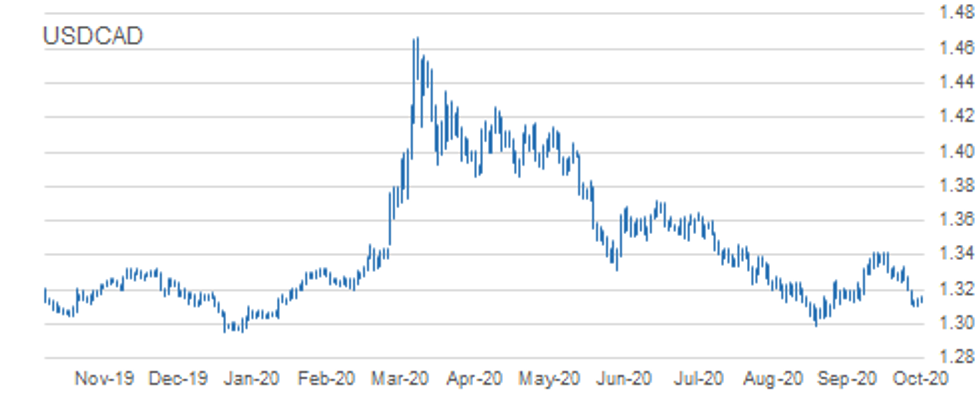
- RES 4: 1.3341 High Oct 7 and a reversal trigger
- RES 3: 1.3273 High Oct 7 and 50-day EMA
- RES 2: 1.3233 20-day EMA
- RES 1: 1.3202 Oct 9 high
- PRICE: 1.3136 @ 10:50 BST Oct 14
- SUP 1: 1.3099 Low Oct 13
- SUP 2: 1.3095 76.4% retracement of the Sep 1 - 30 rally
- SUP 3: 1.3038 Low Sep 2
- SUP 4: 1.2994 Low Sep 1
USDCAD edged lower again Tuesday, extending the pullback that started on Sep 30. The pair did however find support at the day low. Despite the bounce, the outlook remains bearish. Recent weakness follows the clear break on Oct 8 of trendline support drawn off the Sep 1 low. 1.3157, a Fibonacci retracement has been cleared paving the way for a move towards 1.3095. Initial resistance is at Friday's high of 1.3202. Heavy!
MNI LEVELS:
- *$1.1966 Aug18 high
- *$1.1917/24/29 Sep10 high/Upper Boll Band (3%)/Sep02 high
- *$1.1900 Sep15 high
- *$1.1882 Sep16 high
- *$1.1872/74/81 Sep21 high/Cloud top/Upper 1.0% 10-dma env
- *$1.1856/64 100-mma/Upper Boll Band (2%)
- *$1.1817/27/31 Oct13 high/Oct12 high/Oct09 high
- *$1.1799/00 50-dma/55-dma
- *$1.1769/84 200-hma/100-hma
- *$1.1748/54/56 21-dma/Intraday high/Oct09 low
- *$1.1742 ***CURRENT MARKET PRICE 09:55BST WEDNESDAY***
- *$1.1729 Intraday low
- *$1.1725 Oct07 low/50% 1.1612-1.1831
- *$1.1696/85 Oct02 low, 61.8% 1.1612-1.1831//Sep30 low, Sep25 high
- *$1.1664/61 76.4% 1.1612-1.1831/Sep29 low
- *$1.1645 Lower 1.0% 10-dma envelope
- *$1.1625/12 Lower Boll Band (2%)/Sep25 low
- *$1.1598/91 Cloud base/100-dma
- *$1.1581 Jul24 low
- *$1.1565 Lower Bollinger Band (3%)
- *$1.1541/28 Jul23 low/Lower 2.0% 10-dma env
- *$1.3231 Cloud top
- *$1.3208 Upper 2.0% 10-dma envelope
- *$1.3173/79 Sep08 high/Upper Boll Band (3%)
- *$1.3083 Oct12 high
- *$1.3072/78/82 Oct13 high/Upper 1.0% 10-dma env/Upper Boll Band (2%)
- *$1.3022/28 50-dma/55-dma
- *$1.3006/07 Oct12 low/Oct06 high, Sep16 high
- *$1.2990 100-hma
- *$1.2962 200-hma*$1.2940/44/50 200-wma/Intraday high/50-mma
- *$1.2909 ***CURRENT MARKET PRICE 09:59BST WEDNESDAY***
- *$1.2892 21-dma
- *$1.2867/63 Cloud base/Intraday low
- *$1.2846/38/31 Oct07 low/Oct02 low/61.8% 1.2676-1.3083
- *$1.2824/20/19 100-dma/Oct01 low/Lower 1.0% 10-dma env
- *$1.2806 Sep30 low
- *$1.2781/72 Sep24 high/76.4% 1.2676-1.3083
- *$1.2763/50 Sep11 low/100-wma
- *$1.2745 Sep28 low
- *$1.2711 200-dma*$1.2694/91/90 Lower Boll Band (2%)/Sep24 low/Lower 2.0% 10-dma env
EUR/GBP: MNI KEY LEVELS
- *Gbp0.9292 Sep11 high
- *Gbp0.9264 Upper 2.0% 10-dma envelope
- *Gbp0.9244 Upper Bollinger Band (3%)
- *Gbp0.9220 Sep22 high
- *Gbp0.9200 Upper Bollinger Band (2%)
- *Gbp0.9173/81 Upper 1.0% 10-dma env/Sep24 high
- *Gbp0.9156/57/62 Oct01 high/Sep30 high/Oct07 high
- *Gbp0.9132 Oct09 high
- *Gbp0.9112/21/23 21-dma/Intraday high/Oct08 high
- *Gbp0.9080/82 200-hma/10-dma
- *Gbp0.9075 ***CURRENT MARKET PRICE 10:02BST WEDNESDAY***
- *Gbp0.9072/61/58 100-hma/50-dma/55-dma
- *Gbp0.9048/38 Intraday low/100-dma
- *Gbp0.9024/21/20 Lower Boll Band (2%)/Cloud top/Oct13 low
- *Gbp0.8991/79 Lower 1.0% 10-dma env/Lower Boll Band (3%)
- *Gbp0.8969/67 Cloud base/Sep08 low
- *Gbp0.8925 Sep07 low*Gbp0.8900 Sep04 low, Lower 2.0% 10-dma env
- *Gbp0.8872/66/64 200-dma/Sep03 low/Jun09 low
- *Gbp0.8830/26/17 May15 low/May14 low/100-wma
- *Gbp0.8810/08/07 Lower 3.0% 10-dma env/May13 low/200-wma
- *Y106.04 Oct09 high
- *Y105.85 Oct12 high
- *Y105.78 50-dma
- *Y105.76 55-dma
- *Y105.65 200-hma
- *Y105.63 Oct13 high
- *Y105.61 100-hma
- *Y105.53 Cloud Tenkan Sen
- *Y105.52 Intraday high
- *Y105.37 21-dma
- *Y105.37 ***CURRENT MARKET PRICE 10:04BST WEDNESDAY***
- *Y105.31/28/24 Intraday low/Oct13 low/Oct12 low
- *Y105.20 Aug28 low
- *Y105.15 Cloud Kijun Sen
- *Y105.10 Aug19 low
- *Y105.08 Sep22 high
- *Y104.94 Oct02 low
- *Y104.88 Sep23 low
- *Y104.60 Lower Bollinger Band (2%)
- *Y104.54 Lower 1.0% 10-dma envelope
- *Y104.41 Sep22 low
EUR/JPY: MNI KEY LEVELS
- *Y124.93 Fibo 38.2% 149.78-109.57
- *Y124.81 50-dma*Y124.80 55-dma
- *Y124.79 50-mma
- *Y124.48 Oct13 high
- *Y124.45 100-hma
- *Y124.42 Cloud Kijun Sen
- *Y124.34 200-hma
- *Y124.06 Cloud Tenkan Sen
- *Y123.80/94 21-dma/Intraday high
- *Y123.70 ***CURRENT MARKET PRICE 10:05BST WEDNESDAY***
- *Y123.64/57 Intraday low/Cloud base
- *Y123.35 100-dma
- *Y123.31 Oct05 low
- *Y123.03 Oct02 low, Sep29 low
- *Y122.97 Lower 1.0% 10-dma envelope
- *Y122.47 Lower Bollinger Band (2%)
- *Y122.38 Sep28 low*Y122.06 Jul20 low
- *Y121.95 100-wma
- *Y121.82 Jul15 low, Jul16 low
- *$0.7382/84/87 Sep02 high/Upper Boll Band (3%)/Upper3.0% 10-dma env
- *$0.7340 Sep03 high
- *$0.7324/34 Sep21 high/Sep18 high
- *$0.7310/16 Upper Boll Band (2%)/Upper 2.0% 10-dma env
- *$0.7286 Cloud top
- *$0.7264 50-mma
- *$0.7245/54 200-wma/Sep17 low
- *$0.7235/43/44 Sep22 high, Oct12 high/Oct09 high/Upper 1.0% 10-dma env
- *$0.7205/09/18 55-dma/50-dma/Oct13 high
- *$0.7182/91 Intraday high/100-hma
- *$0.7178 ***CURRENT MARKET PRICE 10:07BST WEDNESDAY***
- *$0.7173/68 200-hma/21-dma
- *$0.7153/50 Intraday low/Oct13 low
- *$0.7124/23 Cloud base/Oct08 low
- *$0.7100/96/89 Lower 1.0% 10-dma env/Oct07 low/100-dma
- *$0.7070 Sep29 low
- *$0.7029 Sep28 low, Lower 2.0% 10-dma env
- *$0.7013/06 Lower Boll Band (2%)/Sep25 low
- *$0.6973/63 Jul20 low/Jul16 low
- *$0.6957 Lower 3.0% 10-dma envelope
- *$0.6939 Lower Bollinger Band (3%)
USD/CAD: MNI KEY LEVELS
- *C$1.3341/44/50 Oct07 high/Upper 1.0% 10-dma env/Cloud top
- *C$1.3273 Oct08 high
- *C$1.3261 21-dma
- *C$1.3242 Oct06 low
- *C$1.3230 55-dma
- *C$1.3214/17 200-hma/50-dma
- *C$1.3202 Oct09 high
- *C$1.3174 50-mma
- *C$1.3158/62/63 Intraday high/Cloud base/200-wma
- *C$1.3147 100-hma
- *C$1.3119 ***CURRENT MARKET PRICE 10:08BST WEDNESDAY***
- *C$1.3117 Intraday low
- *C$1.3099 Oct13 low
- *C$1.3087/80 Sep08 low/Lower 1.0% 10-dma env
- *C$1.3074 Lower Bollinger Band (2%)
- *C$1.3038 Sep02 low
- *C$1.2994 Sep01 low
- *C$1.2978/76 Lower Boll Band (3%)/YTD Jan08 low
- *C$1.2952/47 Dec31-2019 low/Lower 2.0% 10-dma env
- *C$1.2917 Oct16-2018 low
- *C$1.2891 Oct05-2018 low
Why MNI
MNI is the leading provider
of intelligence and analysis on the Global Fixed Income, Foreign Exchange and Energy markets. We use an innovative combination of real-time analysis, deep fundamental research and journalism to provide unique and actionable insights for traders and investors. Our "All signal, no noise" approach drives an intelligence service that is succinct and timely, which is highly regarded by our time constrained client base.Our Head Office is in London with offices in Chicago, Washington and Beijing, as well as an on the ground presence in other major financial centres across the world.