
Why MNI
MNI is the leading provider
of intelligence and analysis on the Global Fixed Income, Foreign Exchange and Energy markets. We use an innovative combination of real-time analysis, deep fundamental research and journalism to provide unique and actionable insights for traders and investors. Our "All signal, no noise" approach drives an intelligence service that is succinct and timely, which is highly regarded by our time constrained client base.Our Head Office is in London with offices in Chicago, Washington and Beijing, as well as an on the ground presence in other major financial centres across the world.
FOREX SUMMARY
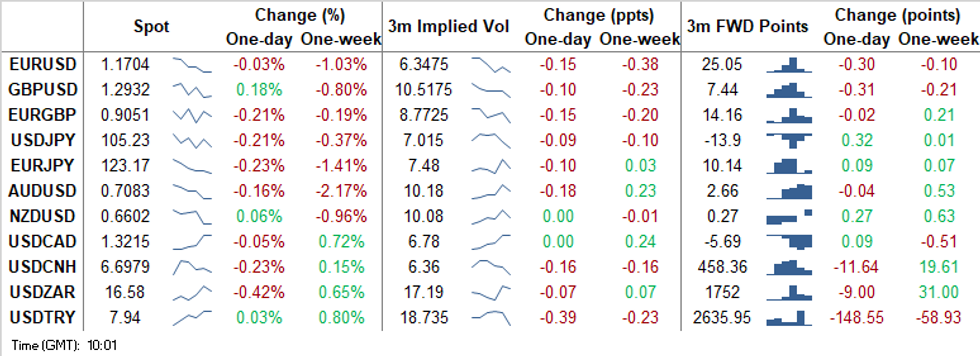
USD started the European session better bid, a continuation of the Asia session, but gains have been unwound.
- Investors and market participants are mostly sitting on the sideline ahead of the EU Summit and potential Brexit deal or no deal, extension or no extension outcomes.
- GBP took couple of legs higher, and remain sensitive on any Brexit/Trade headline.
- USD unwinding also helped Cable.
- Earlier, Raab: "We Are Close To Brexit Deal,", and later following Ireland Martin, noting constructive talks.
- ALL EYES are on potential timing for Boris, but NO set time yet.
- More likely that we will hear from him after the EU summit outcome, but these summits are notoriously known for not sticking at timings.
- EMFX are generally better bid against the USD, as Risk trade in green territory, following overnight news that US Trump would be willing to put forward any Stimulus that would be agreed between Pelosi and Mnuchin.
- Rand is the best performer in EM against the Greenback up 0.53%, but local desk report fairly subdued turnovers, as the Global awaits on the EU Summit.
- Looking ahead, US Retail sales, industrial production & the Uni of Michigan confidence. Fed William and Bullard.
- Earning season continues with State Street reporting today.
- All attention of course on the EU Summit conclusion.
TECHNICALS:
EUR/USD: Remains Vulnerable
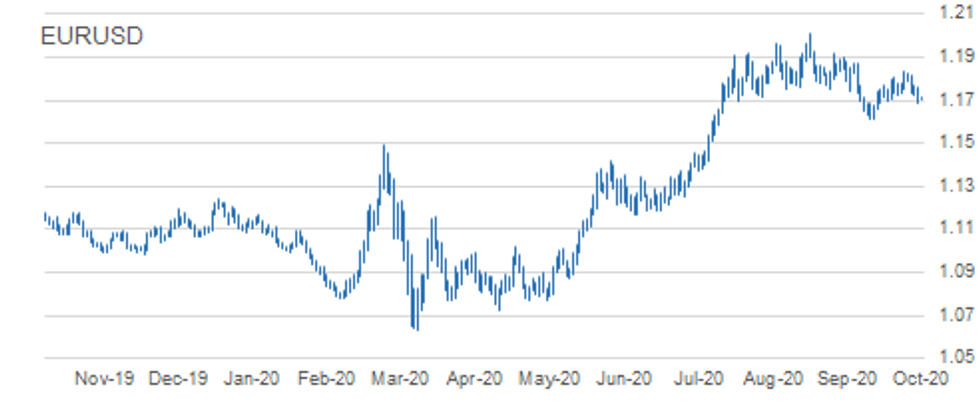
- RES 4: 1.1917 High Sep 10 and 76.4% of the Sep 1 - 25 sell-off
- RES 3: 1.1859 61.8% retracement of the Sep 1 - 25 sell-off
- RES 2: 1.1817/31 High Oct 13 / High Oct 9 and the bull trigger
- RES 1: 1.1771 High Oct 14
- PRICE: 1.1712 @ 10:28 BST Oct 16
- SUP 1: 1.1685 Low Sep 30
- SUP 2: 1.1612/1581 Low Sep 25 and the bear trigger / Low Jul 24
- SUP 3: 1.1597 100-dma
- SUP 4: 1.1541 Low Jul 23
EURUSD is consolidating following yesterday's weakness. The move lower follows the recent rejection off the 1.1831 high on Oct 9. Attention turns to the next important support handle at 1.1685, Sep 30 low. A break of would set the scene for a deeper decline and expose the key 1.1612 level, Sep 25 low. 1.1612 also represents the trigger for a resumption of the downtrend that started on Sep 1. Resistance is at 1.1771 Wednesday's high.
GBP/USD: Still Trading Below Monday's High
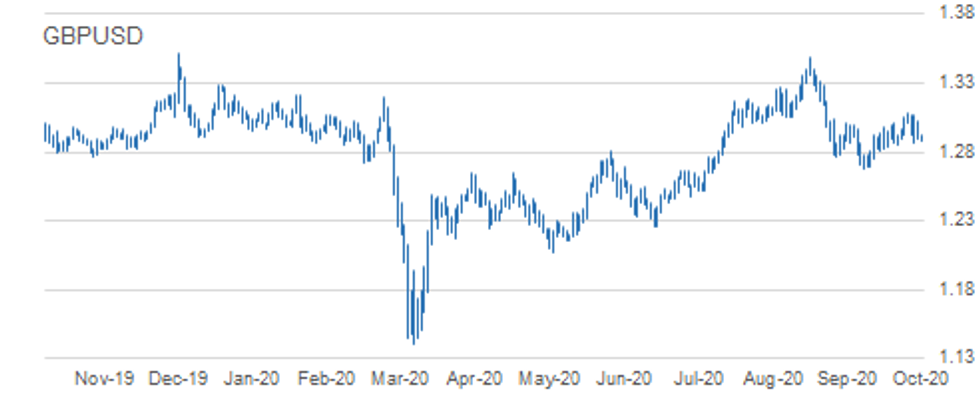
- RES 4: 1.2280 High Sep 7
- RES 3: 1.3175 Former trendline support drawn off the Mar 20 low
- RES 2: 1.3174 61.8% retracement of the Sep 1 - 23 sell-off
- RES 1: 1.3083 High Oct 12
- PRICE: 1.2934 @ 10:31 BST Oct 16
- SUP 1: 1.2863 Low Oct 14
- SUP 2: 1.2846 Low Oct 7 and key near-term support
- SUP 3: 1.2806 Low Sep 30
- SUP 4: 1.2745 Low Sep 28
GBPUSD maintains a choppy tone. The pair recovered Wednesday bouncing sharply off the day low of 1.2863 but traded lower Thursday. Price remains below Monday's high of 1.3083. A break of this level is needed to resume the recent uptrend that would open 1.3000 and 1.3175. The latter is the former trendline support drawn off the Mar 20 low. The trendline was breached on Sep 9. A break of 1.3175 is required to strengthen a bullish theme. Initial support is at 1.2863.
EUR/GBP: Bearish Risk Still Present
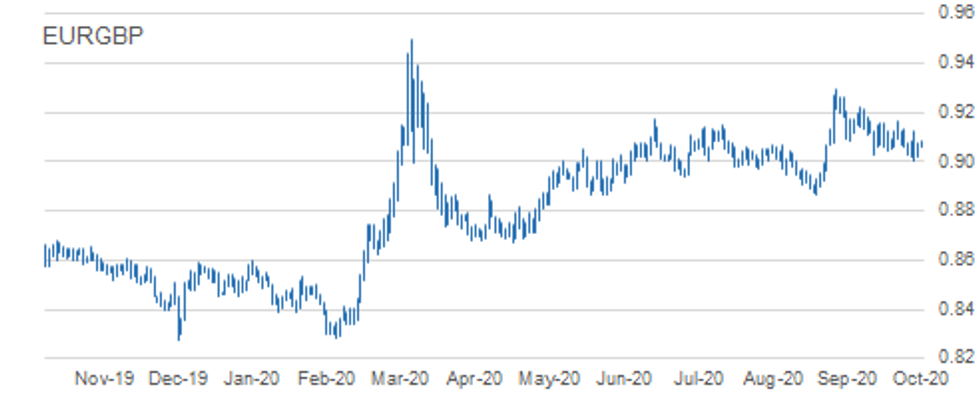
- RES 4: 0.9190 61.8% retracement of the Sep 11 - 28 sell-off
- RES 3: 0.9162 High Oct 7 and the bull trigger
- RES 2: 0.9132 High Oct 10
- RES 1: 0.9122 Oct 14 high
- PRICE: 0.9079 @ 05:54 BST Oct 16
- SUP 1: 0.9007 Low Oct 14
- SUP 2: 0.9000 Round number support
- SUP 3: 0.8967 76.4% retracement of the Sep 3 - 11 rally
- SUP 4: 0.8808 Low May 13
EURGBP maintains a bearish outlook despite recovering off recent lows. The move lower Wednesday followed another failed attempt to convincingly clear trendline resistance drawn off the Sep 11 high. The move lower that day also confirmed a resumption of the current downtrend setting the scene for a move to 0.9000 and below towards 0.8967, a retracement level. Resistance is at 0.9122, the Oct 14 high.
USD/JPY: Focus Is On The Key Short-Term Support
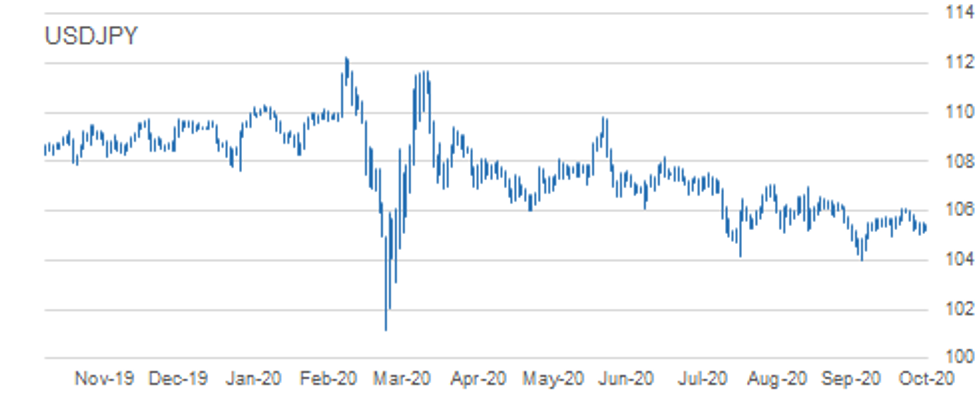
- RES 4: 106.95 High Sep 28
- RES 3: 106.55 High Sep 3 / Channel resistance drawn off Mar 24 high
- RES 2: 106.11/38 High Oct 7 and the bull trigger / High Sep 8
- RES 1: 105.63 High Oct 13
- PRICE: 105.20 @ 10:35 BST Oct 16
- SUP 1: 105.04 Low Oct 14
- SUP 2: 104.94 Low Oct 2 and key near-term support
- SUP 3: 104.41 Low Sep 22
- SUP 4: 104.00 Low Sep 21 and the bear trigger
USDJPY traded lower Wednesday extending this week's slide and is again showing signs of weakness today. Intraday momentum studies still point south however, to strengthen a bearish theme price needs to trade below 104.94, Oct 2 low. This would open 104.00, Sep 21 low. While 104.94 remains intact, the recent sell-off is considered a correction. The bull trigger is at 106.11, Oct 7 high. Initial resistance is at 105.63.
EUR/JPY: Trading Just Ahead Of Support
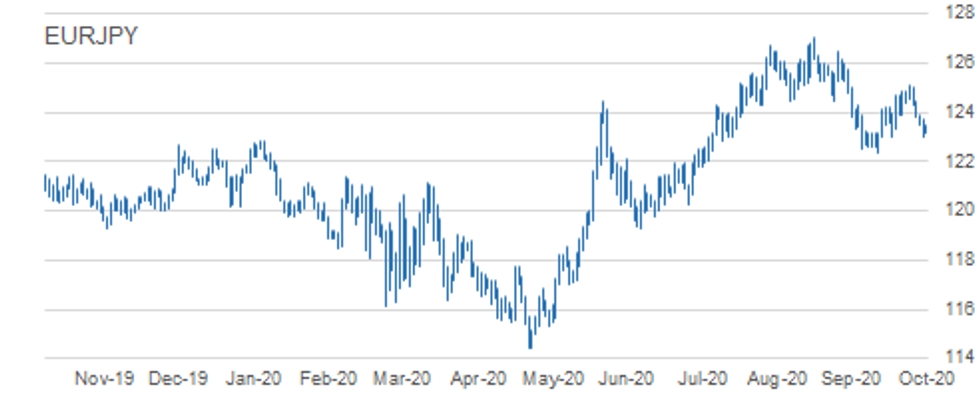
- RES 4: 125.77 High Sep 15
- RES 3: 125.09/28 High Oct 9 / 61.8% of the Sep 1 - 28 sell-off
- RES 2: 124.48 High Oct 13
- RES 1: 123.94 High Oct 14
- PRICE: 123.22 @ 10:40 BST Oct 16
- SUP 1: 123.03/02 Low Sep 29 and Oct 2 / Low Oct 15
- SUP 2: 122.38/28 Low Sep 28 / 61.8% of the Jun 22 - Sep 1 rally
- SUP 3: 122.25 38.2% retracement of the May - Sep rally
- SUP 4: 121.82 Low Jul 15 and 16
EURJPY maintains a softer tone having traded lower again yesterday. While recent weakness is considered a correction, attention turns to support at 123.03, Oct 6 low. This level was probed briefly Thursday. A clear breach of 123.03 would highlight scope for a deeper pullback and open the key support at 122.38, Sep 28 low and the bear trigger. On the upside, key resistance is at 125.09, Oct 9 high. Initial resistance is at 123.94.
AUD/USD: Failure At Trendline Resistance Weighs
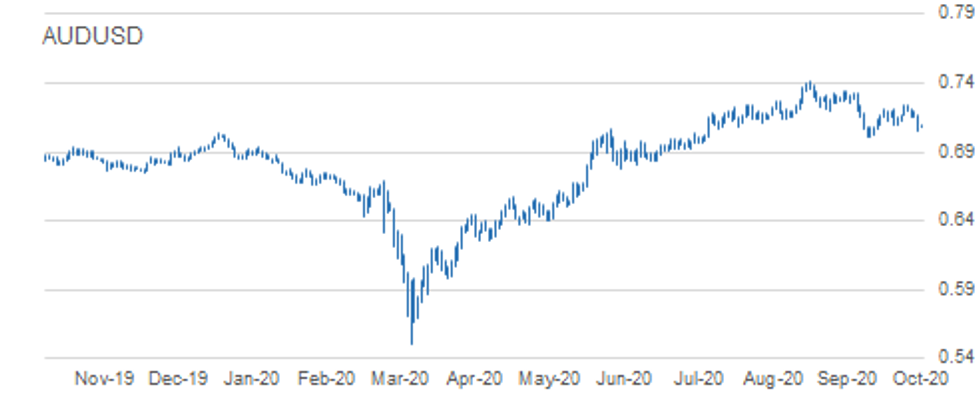
- RES 4: 0.7258 61.8% retracement September Sell-Off
- RES 3: 0.7243 High Oct 10 and the intraday bull trigger
- RES 2: 0.7207 Trendline resistance drawn off the Sep 1 high
- RES 1: 0.7170 High Oct 15
- PRICE: 0.7077 @ 10:42 BST Oct 16
- SUP 1: 0.7056 Low Oct 15
- SUP 2: 0.7029 Low Sep 28
- SUP 3: 0.7006 Low Sep 25 and the bear trigger
- SUP 4: 0.6965 23.6% retracement of the Mar - Sep rally
AUDUSD traded sharply lower Thursday. On Oct 9, the pair cleared resistance at 0.7209, Oct 1 and 6 high resulting in a test of trendline resistance drawn off the Sep 1 high. The line intersects at 0.7207 today. A failure to clear the trendline is weighing and, with support at 0.7096, Oct 7 breached, the scene is set for a deeper pullback. Attention turns to the primary support and bear trigger at 0.7006, Sep 25 low. 0.7170 is resistance.
USD/CAD: Needle Points North
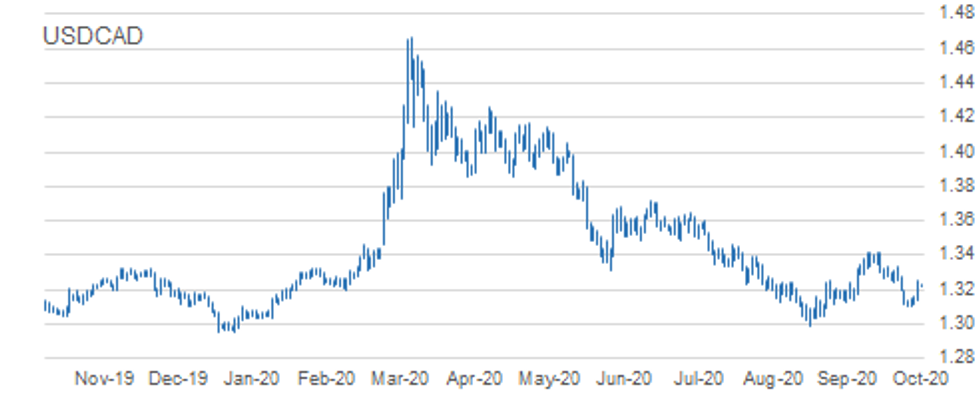
- RES 4: 1.3421 High Sep 30 and primary resistance
- RES 3: 1.3341 High Oct 7 and a reversal trigger
- RES 2: 1.3266/68 50-day EMA / High Oct 7
- RES 1: 1.3259 High Oct 15
- PRICE: 1.3218 @ 10:44 BST Oct 16
- SUP 1: 1.3143 Low Oct 15
- SUP 2: 1.3099 Low Oct 13 and the bear trigger
- SUP 3: 1.3095 76.4% retracement of the Sep 1 - 30 rally
- SUP 4: 1.3038 Low Sep 2
USDCAD traded sharply higher Thursday. The recovery highlights scope for a stronger corrective bounce. The pair has cleared 1.3222, the 20-day EMA paving the way for move towards the 50-day EMA that intersects at 1.3266. A breach of this average would strengthen a bullish case. On the downside, initial support lies at 1.3143, Thursday's intraday low. A move below this level would undermine the recent bounce.
MNI KEY LEVELS:
- *$1.1900 Sep15 high
- *$1.1881/82 Upper Boll Band (3%)/Sep16 high
- *$1.1872/76 Cloud top, Sep21 high/Upper 1.0% 10-dma env
- *$1.1856 100-mma
- *$1.1817/27/31 Oct13 high/Oct12 high/Upper Boll Band (2%), Oct09 high
- *$1.1794/96 50-dma/55-dma
- *$1.1771 Oct14 high
- *$1.1753/58/65 100-hma/Oct15 high/200-hma
- *$1.1736 21-dma, 38.2% 1.3993-1.0341
- *$1.1720 Intraday high, Oct14 low
- *$1.1709 ***CURRENT MARKET PRICE 09:48BST FRIDAY***
- *$1.1694/89 Intraday low/Oct15 low
- *$1.1685 Sep30 low, Sep25 high
- *$1.1664/61 76.4% 1.1612-1.1831/Sep29 low
- *$1.1641/31 Lower 1.0% 10-dma env/Lower Boll Band (2%)
- *$1.1612/03/98 Sep25 low/100-dma/Cloud base
- *$1.1581 Jul24 low, Lower Boll Band (3%)
- *$1.1541 Jul23 low
- *$1.1524 Lower 2.0% 10-dma envelope
- *$1.1507 Jul22 low
- *$1.1423 Jul21 low
- *$1.3189 Upper Bollinger Band (3%)
- *$1.3173 Sep08 high
- *$1.3128 Cloud top
- *$1.3083/90/91 Oct12 high/Upper Boll Band (2%)/Upper 1.0% 10-dma env
- *$1.3064/72 Oct14 high/Oct13 high
- *$1.3024/30 55-dma/Oct15 high
- *$1.3007/17 Oct06 high, Sep16 high/50-dma
- *$1.2982 100-hma
- *$1.2965 200-hma
- *$1.2943/49/50 200-wma/Intraday high/50-mma
- *$1.2935 ***CURRENT MARKET PRICE 09:50BST FRIDAY***
- *$1.2921 Cloud base
- *$1.2892/83 21-dma/Intraday low
- *$1.2863 Oct14 low
- *$1.2846/38/37 Oct07 low/Oct02 low/100-dma
- *$1.2831/20 Lower 1.0% 10-dma env, 61.8% 1.2676-1.3083/Oct01 low
- *$1.2806 Sep30 low*$1.2781/72 Sep24 high/76.4% 1.2676-1.3083
- *$1.2763/51 Sep11 low/100-wma
- *$1.2745 Sep28 low
- *$1.2710/02 200-dma/Lower 2.0% 10-dma env
- *Gbp0.9292 Sep11 high
- *Gbp0.9242/54 Upper Boll Band (3%)/Upper 2.0% 10-dma env
- *Gbp0.9220 Sep22 high
- *Gbp0.9181/95 Sep24 high/Upper Boll Band (2%)
- *Gbp0.9163 Upper 1.0% 10-dma envelope
- *Gbp0.9156/57/62 Oct01 high/Sep30 high/Oct07 high
- *Gbp0.9122/23/32 Oct14 high/Oct08 high/Oct09 high
- *Gbp0.9104 21-dma
- *Gbp0.9072/75/83 10-dma/200-hma/Intraday high
- *Gbp0.9058/61/68 55-dma/50-dma/Cloud base, Cloud top
- *Gbp0.9053 ***CURRENT MARKET PRICE 09:53BST FRIDAY***
- *Gbp0.9053/44/39 100-hma/Intraday low/100-dma
- *Gbp0.9017/07 Oct15 low/Oct14 low, Lower Boll Band (2%)
- *Gbp0.8982/67 Lower 1.0% 10-dma env/Sep08 low
- *Gbp0.8959 Lower Bollinger Band (3%)
- *Gbp0.8925 Sep07 low
- *Gbp0.8900/91 Sep04 low/Lower 2.0% 10-dma env
- *Gbp0.8877/66/64 200-dma/Sep03 low/Jun09 low
- *Gbp0.8830/26/19 May15 low/May14 low/100-wma
- *Gbp0.8809/08/01 200-wma/May13 low/Lower 3.0% 10-dma env
- *Gbp0.8791 50-mma
USD/JPY: MNI KEY LEVELS
- *Y106.00 Cloud base
- *Y105.85 Oct12 high
- *Y105.76 50-dma, 55-dma
- *Y105.63 Oct13 high
- *Y105.59 200-hma
- *Y105.58 Cloud Tenkan Sen
- *Y105.52 Oct14 high
- *Y105.49 Oct15 high
- *Y105.45 Intraday high
- *Y105.35/41 100-hma/21-dma
- *Y105.22 ***CURRENT MARKET PRICE 09:55BST FRIDAY***
- *Y105.19/13/09 Intraday low/Cloud Kijun Sen/Oct15 low
- *Y105.04 Oct14 low
- *Y104.94 Oct02 low
- *Y104.88 Sep23 low
- *Y104.82 Lower Bollinger Band (2%)
- *Y104.51 Lower 1.0% 10-dma envelope
- *Y104.50 Lower Bollinger Band (3%)
- *Y104.41 Sep22 low
- *Y104.00 Sep21 low
- *Y103.94 200-mma
EUR/JPY: MNI KEY LEVELS
- *Y124.48 Oct13 high
- *Y124.26 Cloud Kijun Sen
- *Y124.22 200-hma
- *Y124.06 Cloud Tenkan Sen
- *Y123.94 Oct14 high
- *Y123.82 100-hma
- *Y123.77 Oct15 high
- *Y123.72 21-dma
- *Y123.67 Cloud base
- *Y123.43/47 100-dma/Intraday high, Oct14 low
- *Y123.18 ***CURRENT MARKET PRICE 09:56BST FRIDAY***
- *Y123.12/03 Intraday low/Oct02 low, Sep29 low
- *Y123.02 Oct15 low
- *Y122.89 Lower 1.0% 10-dma envelope
- *Y122.38 Sep28 low
- *Y122.37 Lower Bollinger Band (2%)
- *Y122.06 Jul20 low
- *Y121.89 100-wma
- *Y121.82 Jul15 low, Jul16 low
- *Y121.70 Lower Bollinger Band (3%)
- *Y121.64 Lower 2.0% 10-dma envelope
AUD/USD: MNI KEY LEVELS
- *$0.7282 Cloud top
- *$0.7254/57/62 Sep17 low/Upper Boll Band (2%)/50-mma
- *$0.7235/43/44 Sep22 high, Oct12 high/Oct09 high/200-wma
- *$0.7218/25 Oct13 high/Upper 1.0% 10-dma env
- *$0.7191/02/05 Oct14 high/55-dma/50-dma
- *$0.7159/70 200-hma/Oct15 high
- *$0.7146/47/52 Cloud base/21-dma/100-hma
- *$0.7123 Oct08 low
- *$0.7098 Intraday high
- *$0.7082/97 Lower 1.0% 10-dma env/100-dma
- *$0.7082 ***CURRENT MARKET PRICE 09:57BST FRIDAY***
- *$0.7071/56 Intraday low/Oct15 low
- *$0.7029/22 Sep28 low/Lower Boll Band (2%)
- *$0.7010/06 Lower 2.0% 10-dma env/Sep25 low
- *$0.6973/63 Jul20 low/Jul16 low, Lower Boll Band (3%)
- *$0.6939 Lower 3.0% 10-dma envelope
- *$0.6921 Jul14 low
- *$0.6897 100-wma
- *$0.6877 Jul01 low*$0.6833 Jun30 low
- *$0.6805/90 Jun22 low/200-dma
USD/CAD: MNI KEY LEVELS
- *C$1.3419/21 Sep29 high/Aug04 high, Sep30 high
- *C$1.3378 100-wma
- *C$1.3352/59 Sep29 low/100-dma
- *C$1.3341 Oct07 high
- *C$1.3320/30 Cloud top/Upper 1.0% 10-dma env
- *C$1.3273 Oct08 high
- *C$1.3259/67 Oct15 high/21-dma
- *C$1.3238 Intraday high
- *C$1.3223 55-dma
- *C$1.3212 50-dma
- *C$1.3212 ***CURRENT MARKET PRICE 09:59BST FRIDAY***
- *C$1.3205 Intraday low
- *C$1.3192 200-hma
- *C$1.3176 50-mma
- *C$1.3162/56 Cloud base, 200-wma/100-hma
- *C$1.3143 Oct15 low
- *C$1.3117 Oct14 low
- *C$1.3099 Oct13 low
- *C$1.3087 Sep08 low, Lower Boll Band (2%)
- *C$1.3066 Lower 1.0% 10-dma envelope
- *C$1.3038 Sep02 low
- EUR/USD: $1.1525(E651mln), $1.1650(E888mln), $1.1700(E680mln), $1.1715-25(E687mln), $1.1745-50(E643mln),
$1.1800(E2.51bln-E2.32bln of EUR calls), $1.1845-50(E1.1bln), $1.1900(E832mln-EUR calls) - USD/JPY: Y104.50($1.6bln), Y105.00-04($3.0bln-$2.9bln of USD puts), Y105.35-40($1.2bln), Y105.50-60($626mln)
- GBP/USD: $1.2945-50(Gbp483mln)
- EUR/NOK: Nok10.30(E840mln), Nok10.55(E800mln), Nok10.65(E571mln)
- AUD/USD: $0.6700(A$753mln), $0.7050-60(A$566mln), $0.7175(A$794mln)
- AUD/JPY: Y74.30(A$555mln)
- USD/CAD: C$1.3000($745mln), C$1.3220($670mln)USD/CNY: Cny6.72($570mln)
-----------------------------------
Larger Option Pipeline - EUR/USD: Oct19 $1.1650(E1.1bln), $1.1800(E1.0bln); Oct20 $1.1745(E1.1bln); Oct22 $1.1600(E1.2bln), $1.1645-50(E1.7bln); Oct23 $1.2000(E1.3bln);
Oct26 $1.1500(E1.8bln), $1.1650-60(E1.4bln); Oct28 $1.1800-05(E1.4bln), $1.2000-05(E2.1bln) - USD/JPY: Oct19 Y106.00($1.1bln); Oct20 Y106.35-44($2.3bln-USD calls); Oct21 Y105.00-10($1.9bln), Y105.90-106.00($2.2bln), Y106.65($1.0bln);
Oct22 Y104.50-55($1.8bln), Y104.95-105.00($1.1bln), Y105.95-106.00($1.2bln); Oct26 Y103.95-104.00($1.5bln-USD puts),
Y106.95-107.00($1.6bln); Oct27 Y105.00($1.2bln); Oct28 Y105.00($1.1bln) - EUR/GBP: Oct26 Gbp0.9000(E1.3bln-EUR puts)
- AUD/JPY: Oct22 Y76.44(A$2.1bln); Oct29 Y73.20(A$1.0bln-AUD puts), Y76.35-40(A$2.4bln-AUD calls)
- AUD/NZD: Oct27 N$1.0809-20(A$2.5bln)
- USD/CNY: Oct19 Cny6.7735($1.0bln)
Why MNI
MNI is the leading provider
of intelligence and analysis on the Global Fixed Income, Foreign Exchange and Energy markets. We use an innovative combination of real-time analysis, deep fundamental research and journalism to provide unique and actionable insights for traders and investors. Our "All signal, no noise" approach drives an intelligence service that is succinct and timely, which is highly regarded by our time constrained client base.Our Head Office is in London with offices in Chicago, Washington and Beijing, as well as an on the ground presence in other major financial centres across the world.