
Why MNI
MNI is the leading provider
of intelligence and analysis on the Global Fixed Income, Foreign Exchange and Energy markets. We use an innovative combination of real-time analysis, deep fundamental research and journalism to provide unique and actionable insights for traders and investors. Our "All signal, no noise" approach drives an intelligence service that is succinct and timely, which is highly regarded by our time constrained client base.Our Head Office is in London with offices in Chicago, Washington and Beijing, as well as an on the ground presence in other major financial centres across the world.
Table 1. US COVID-19 Data Table, Top 12 States for Confirmed Cases
State | Confirmed Cases | Deceased | New Cases in Last 24hrs | New Cases Higher or Lower than Previous Day's? (Today's new cases-Yesterday's New Cases) | Consecutive Days of Increase/Decrease in New Cases | Mortality Rate (per 100 recorded cases) | % Change in Cases on Previous Day | Rate of Increase in cases (7-day average) |
California | 421,286 | 8,047 | 11,981 | Higher (+546) | 2 (Increase) | 1.9 | 2.9% | 2.4% |
New York | 408,886 | 32,558 | 705 | Lower (-150) | 1 (Decrease) | 8.0 | 0.2% | 0.2% |
Florida | 379,619 | 5,345 | 9,785 | Higher (+345) | 1 (Increase) | 1.4 | 2.6% | 3.1% |
Texas | 363,615 | 4,439 | 12,544 | Higher (+5,256) | 1 (Increase) | 1.2 | 3.6% | 2.9% |
New Jersey | 177,645 | 15,707 | 389 | Higher (+96) | 3 (Increase) | 8.8 | 0.2% | 0.1% |
Illinois | 166,475 | 7,540 | 1,611 | Higher (+669) | 1 (Increase) | 4.5 | 1.0% | 0.8% |
Georgia | 152,302 | 3,335 | 3,314 | Lower (-92) | 1 (Decrease) | 2.2 | 2.2% | 2.5% |
Arizona | 150,609 | 2,974 | 1,926 | Lower (-1,574) | 1 (Decrease) | 2.0 | 1.3% | 1.9% |
Massachusetts | 114,320 | 8,468 | 287 | Higher (+43) | 1 (Increase) | 7.4 | 0.3% | 0.3% |
Pennsylvania | 108,187 | 7,077 | 727 | Lower (-328) | 1 (Decrease) | 6.5 | 0.7% | 0.8% |
North Carolina | 105,276 | 1,732 | 2,060 | Higher (+75) | 2 (Increase) | 1.6 | 2.0% | 2.0% |
Louisiana | 99,354 | 3,558 | 2,771 | Higher (+1,080) | 1 (Increase) | 3.6 | 2.9% | 2.4% |
Chart Pack 1 – Short-Term COVID-19 Cases and Fatalities, Nominal and % Chg Day-to-Day (5dma) The chart pack below records the number of COVID-19 cases and fatalities resulting from COVID-19 recorded in key states over the past month in each respective state. The charts also display the rate of increase in recorded cases and fatalities in each state. Legend below can be used for all state charts.
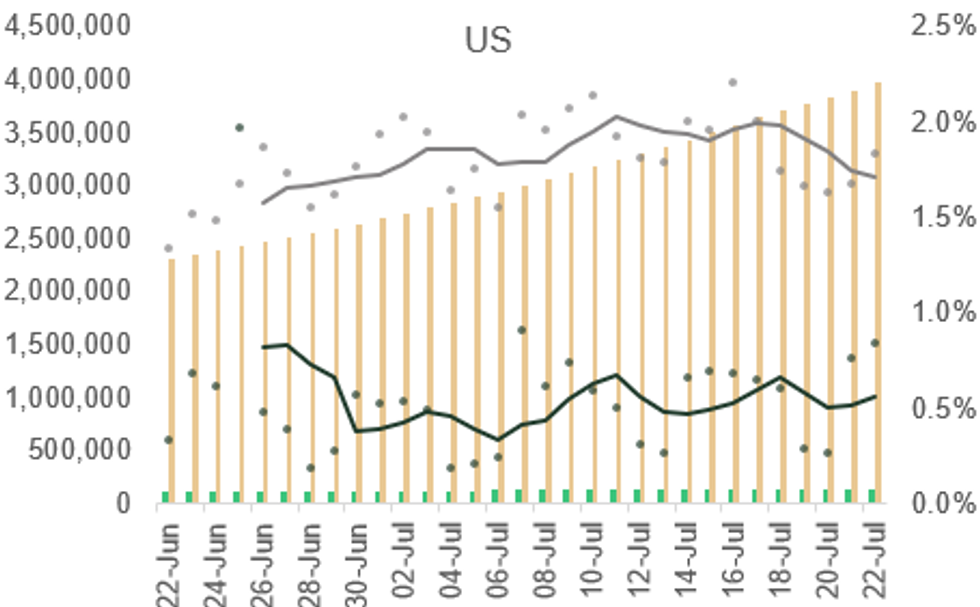 Source: JHU, MNI. N.b. Legend applies to all charts. All data correct as of 0640BST July 23, and represents full-day data submissions, rather than intra-day figures. Each dot indicates the data from a single day.
For full article PDF click here.

Why MNI
MNI is the leading provider
of intelligence and analysis on the Global Fixed Income, Foreign Exchange and Energy markets. We use an innovative combination of real-time analysis, deep fundamental research and journalism to provide unique and actionable insights for traders and investors. Our "All signal, no noise" approach drives an intelligence service that is succinct and timely, which is highly regarded by our time constrained client base.Our Head Office is in London with offices in Chicago, Washington and Beijing, as well as an on the ground presence in other major financial centres across the world.