
Why MNI
MNI is the leading provider
of intelligence and analysis on the Global Fixed Income, Foreign Exchange and Energy markets. We use an innovative combination of real-time analysis, deep fundamental research and journalism to provide unique and actionable insights for traders and investors. Our "All signal, no noise" approach drives an intelligence service that is succinct and timely, which is highly regarded by our time constrained client base.Our Head Office is in London with offices in Chicago, Washington and Beijing, as well as an on the ground presence in other major financial centres across the world.
Better GDP Fails to Translate to a Stronger EUR
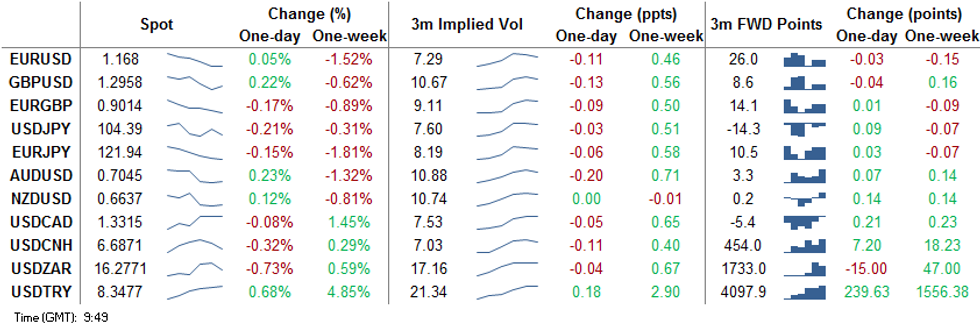
GDP data has fared better across Europe, with German, Italian, French and Spanish numbers proving better-than-expected. This failed to translate into a stronger single currency, however, with ECB's Lagarde just yesterday warning of the upside risk to Q3 growth numbers that's expected to fade materially into the end of 2020.
The greenback is paring some of the recent strength, but recent ranges have largely been respected. JPY is marginally stronger, while CHF is marginally weaker.
Month-end hedge rebalancing flows are broadly seen to be USD positive for October, although much of this order flow may have been completed earlier in the week alongside the broad greenback rally.
Earnings after-market Thursday were mixed, with Alphabet trading higher after-earnings, while Apple, Amazon and Facebook retreat.
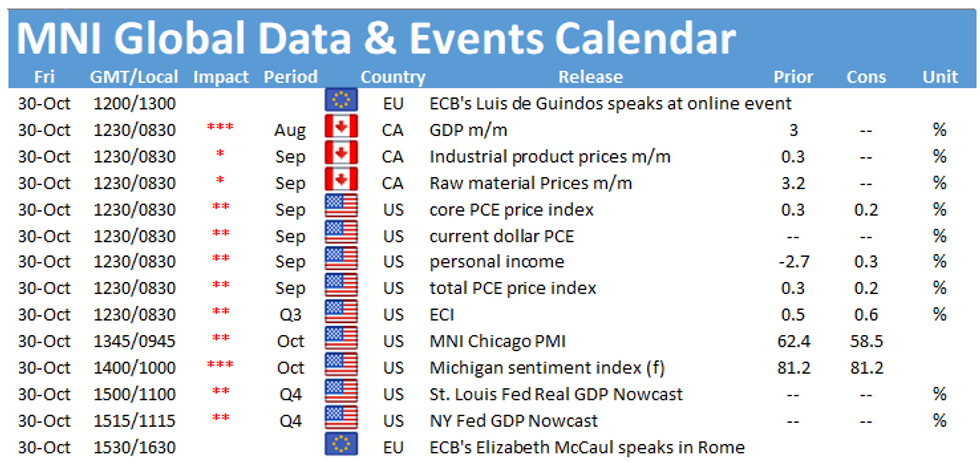
Canadian GDP, US personal income/spending and MNI Chicago PMI are the calendar highlights Friday.
EUR/USD TECHS: Bearish Following Trendline Break
- RES 4: 1.1881 High Oct 21 and the bull trigger
- RES 3: 1.1839 High Oct 27
- RES 2: 1.1798 High Oct 28
- RES 1: 1.1759 High Oct 29
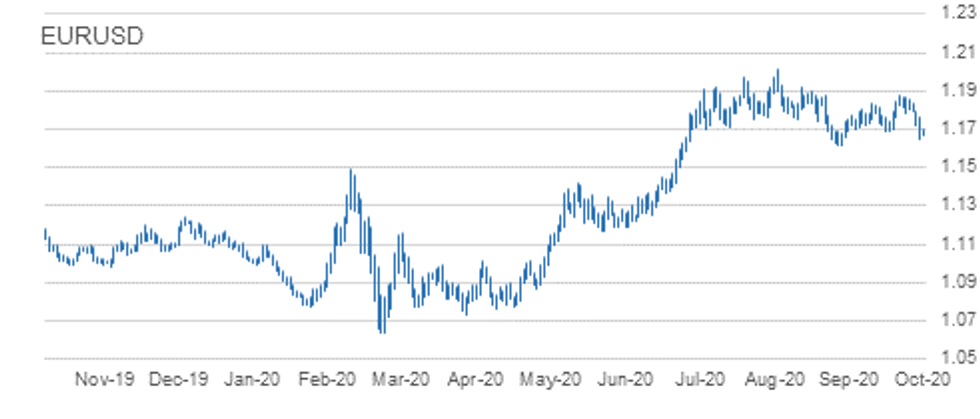
- PRICE: 1.1671 @ 09:28 GMT Oct 30
- SUP 1: 1.1650 Low Oct 29
- SUP 2: 1.1612 Low Sep 25 and the bear trigger
- SUP 3: 1.1576 0.764 proj of Sep 1 - 25 sell-off from Oct 21 high
- SUP 4: 1.1541 Low Jul 23
EURUSD maintains a bearish tone following yesterday's sell-off that confirmed a clear breach of its short-term trendline support drawn off the Sep 28 low. The clear break, confirmed by a move below Wednesday's low of 1.1718 as well as key support at 1.1689, Oct 15 low strengthens the bearish case. This opens 1.1612, Sep 25 low and the primary bear trigger. Initial resistance is at 1.1759, Thursday's intraday high.
GBP/USD TECHS: Support Exposed
- RES 4: 1.3266 2.0% 10-dma envelope
- RES 3: 1.3177 High Oct 21 and the bull trigger
- RES 2: 1.3080 High Oct 27 and key near-term resistance
- RES 1: 1.3026 High Oct 29
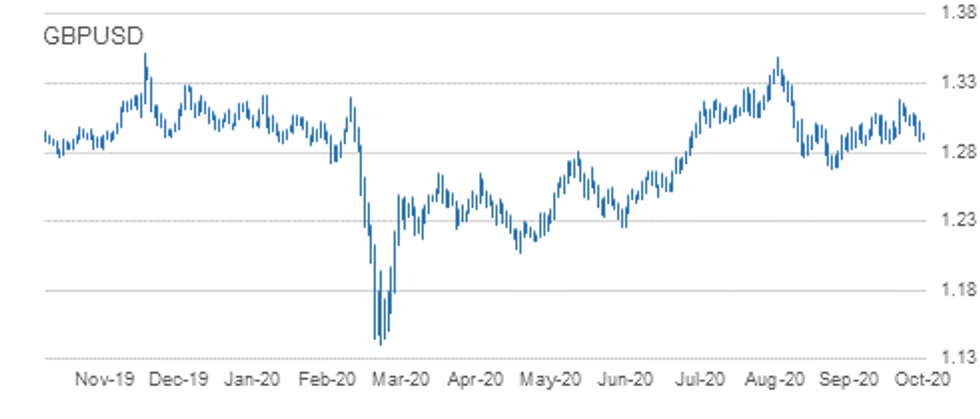
- PRICE: 1.2948 @ 09:40 GMT Oct 30
- SUP 1: 1.2881 Low Oct 29
- SUP 2: 1.2863 Low Oct 14 and key near-term support
- SUP 3: 1.2806 Low Sep 30
- SUP 4: 1.2794 76.4% retracement of the Sep 23 - Oct 21 rally
The GBPUSD outlook remains bearish following this week's move lower. The breach of 1.2940, Oct 21 low suggests scope for a deeper corrective pullback with attention on 1.2863, Oct 14 low and a key short-term support. Clearance of this level would open 1.2794, a Fibonacci retracement. Price action has defined initial firm resistance at 1.3080, Oct 27 high. A move back above this hurdle would ease bearish pressure and open 1.3177.
EUR/GBP TECHS: Eyeing Key Support
- RES 4: 0.9220 High Sep 22
- RES 3: 0.9154/62 1.0% 10-dma envelope / High Oct 7
- RES 2: 0.9149 Oct 20 high
- RES 1: 0.9107 High Oct 23
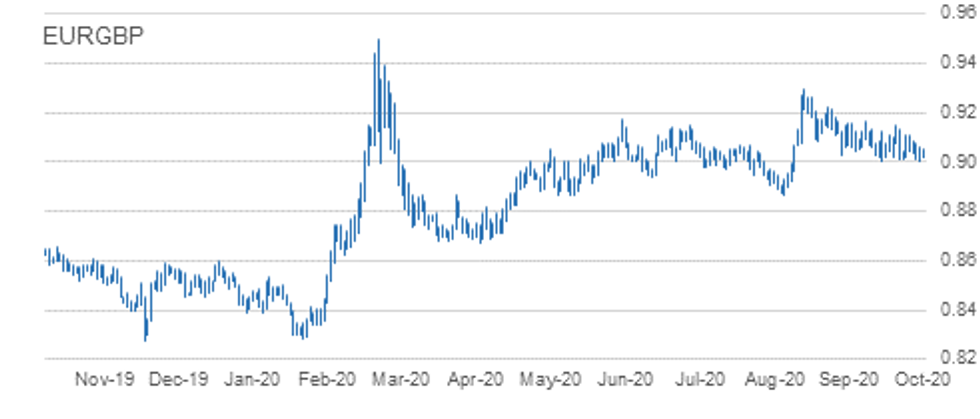
- PRICE: 0.9018 @ 09:44 GMT Oct 30
- SUP 1: 0.9007 Low Oct 14 / 29 and bear trigger
- SUP 2: 0.8967 76.4% retracement of the Sep 3 - 11 rally
- SUP 3: 0.8925 Low Sep 7
- SUP 4: 0.8900 Low Sep 4
EURGBP is trading closer to recent lows and remains largely unchanged. The outlook is bearish following the sharp sell-off on Oct 21. Attention is on 0.9007, Oct 14 and 29 low, the near-term bear trigger. A break of 0.9007 would confirm a resumption of the downtrend that started Sep 11 and expose 0.8967, a retracement. Key S/T resistance has been defined at 0.9149, Oct 20 high. Clearance of this level would undermine bearish conditions.
USD/JPY TECHS: All Eyes On 104.00
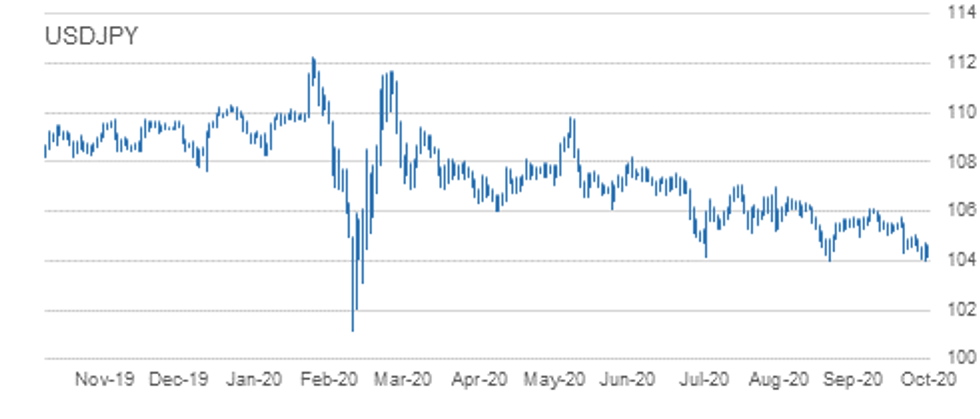
- RES 4: 105.75 High Oct 20
- RES 3: 105.51/53 50-dma / High Oct 21
- RES 2: 105.06 High Oct 26 and key near-term resistance
- RES 1: 104.73 High Oct 29
- PRICE: 104.37 @ 09:46 GMT Oct 30
- SUP 1: 104.00 Low Sep 21 and the bear trigger
- SUP 2: 103.67 76.4% retracement of the Mar 9 - 24 rally
- SUP 3: 103.09 Low Mar 12
- SUP 4: 102.02 Low Mar 10
USDJPY maintains a bearish outlook and has retraced most of yesterday's gains. Attention is on the key 104.00 handle, Sep 21 low. Clearance of this support would suggest scope for a deeper USD sell-off within the bear channel drawn off the Mar 24 high. A break lower would also confirm a resumption of the current downtrend and maintain the bearish price sequence of lower lows and lower highs. Firm resistance is at 105.06.
EUR/JPY TECHS: Sharply Lower
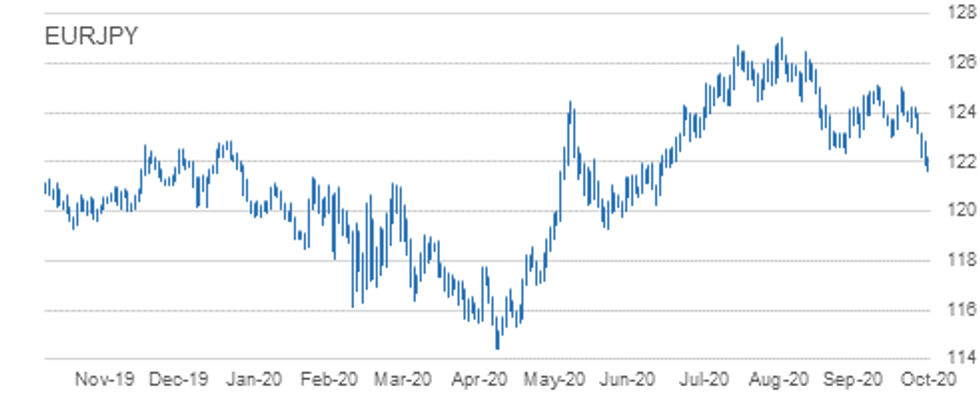
- RES 4: 124.23 High Oct 23 and 26
- RES 3: 123.84 20-day EMA
- RES 2: 123.19 High Oct 28
- RES 1: 122.38 Low Sep 28 and recent breakout level
- PRICE: 121.93 @ 09:50 GMT Oct 30
- SUP 1: 121.50 0.764 proj of Sep 1 - 28 decline from Oct 9 high
- SUP 2: 120.70 Low Jul 13
- SUP 3: 120.39 1.000 proj of Sep 1 - 28 decline from Oct 9 high
- SUP 4: 120.27 Low Oct 10
EURJPY maintains a bearish tone and has extended this week's selloff once again today. The cross has cleared support at 123.03/02 and 122.38, Sep 28 low. This move lower confirms a resumption of the downleg that started Sep 1. Scope is seen for weakness towards 121.50 next, a Fibonacci projection. Further out, 120.39 is on the radar, also a Fibonacci projection. Initial resistance is at 122.38.
AUD/USD TECHS: Key Support Probed
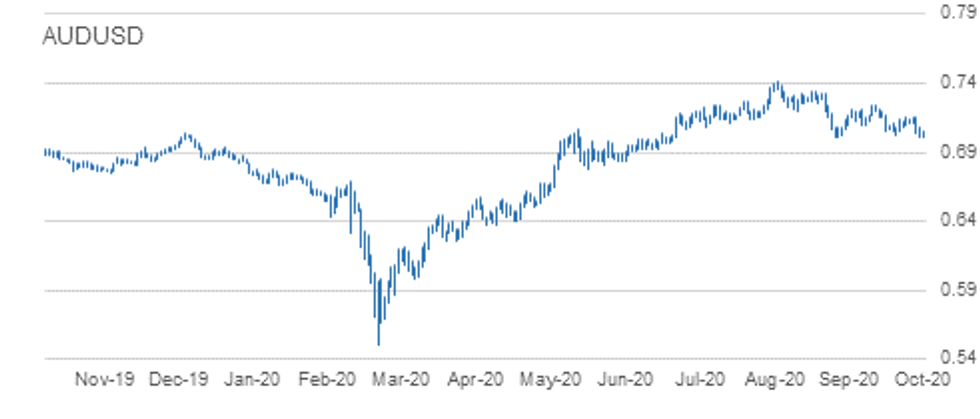
- RES 4: 0.7243 High Oct 10 and a key resistance
- RES 3: 0.7218 High Oct 13
- RES 2: 0.7144/58 Trendline drawn off the Sep 1 high / High Oct 23
- RES 1: 0.7076 High Oct 29
- PRICE: 0.7045 @ 09:53 GMT Oct 30
- SUP 1: 0.7002 Low Oct 29
- SUP 2: 0.6965 23.6% retracement of the Mar - Sep Rally
- SUP 3: 0.6948 2.0% 10-dma envelope
- SUP 4: 0.6921 Low Jul 14
AUDUSD outlook is bearish. The pair has pulled further away from trendline resistance drawn off the Sep 1 high. The trendline resistance rests at 0.7144 and represents a key hurdle for bulls. This line was tested Wednesday and capped gains. While the trendline holds, a bearish theme dominates which was strengthened Thursday following the print below 0.7006, Sep 25 low. This has opened 0.6965 next. A trendline breach reverses the trend.
USD/CAD TECHS: Rally Extends
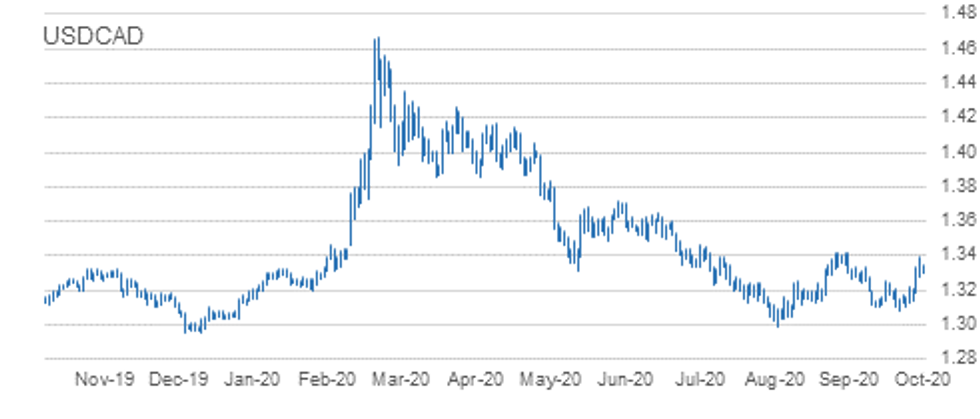
- RES 4: 1.3545 200-dma
- RES 3: 1.3460 2.0% 10-dma envelope
- RES 2: 1.3421 High Sep 30 and primary resistance
- RES 1: 1.3390 High Oct 29
- PRICE: 1.3319 @ 09:55 GMT Oct 30
- SUP 1: 1.3259 High Oct 15 and recent breakout level
- SUP 2: 1.3180 Low Oct 28
- SUP 3: 1.3109/3081 Low Oct 23 / Low Oct 21 and the bear trigger
- SUP 4: 1.3047 Low Sep 7
USDCAD gains extended further Thursday. This cemented the break of key short-term resistance at 1.3259, Oct 15 high as well as the break of 1.3341, Oct 7 high. The move higher signals scope for a climb towards 1.3421 next, Sep 30 and primary resistance. Initial firm support is seen at Wednesday's low of 1.3180. A break of this level is required to undermine the developing bullish tone. First support however lies at 1.3259.
EUR/USD: MNI KEY LEVELS
- *$1.1849/51 100-mma/Jun14-2018 high
- *$1.1815 Sep24-2018 high
- *$1.1799 200-hma
- *$1.1793 55-dma
- *$1.1786/91 50-dma/Cloud top
- *$1.1769 21-dma
- *$1.1764 100-hma
- *$1.1757 Sep27-2018 high
- *$1.1736 Fibo 38.2% 1.3993-1.0341
- *$1.1691/95 Cloud base/Intraday high
- *$1.1673 ***CURRENT MARKET PRICE 07:29GMT FRIDAY***
- *$1.1665/62 Lower 1.0% 10-dma env, Intraday low/Lower Boll Band (2%)
- *$1.1654/51 100-dma/Sep28-2018 high
- *$1.1621 Oct16-2018 high
- *$1.1615/13 Down Trendline from Jul18-2008/161.8% swing $1.1497-1.1309
- *$1.1607 Lower Bollinger Band (3%)
- *$1.1570 Jan10-2019 high
- *$1.1547 Lower 2.0% 10-dma envelope
- *$1.1540 Jan11-2019 high
- *$1.1490 Jan15-2019 high
- *$1.1450/48 Jan29-2019 high/Mar20-2019 high
GBP/USD: MNI KEY LEVELS
- *$1.3041 May13-2019 high
- *$1.3024 200-hma
- *$1.3011 55-dma
- *$1.2997/99 50-dma, 100-hma, Cloud top/61.8% 1.3381-1.2382
- *$1.2991 May10-2019 low
- *$1.2980 21-dma
- *$1.2970 May14-2019 high
- *$1.2960 Cloud base
- *$1.2949/50 50-mma/200-wma
- *$1.2939 Intraday high
- *$1.2915 ***CURRENT MARKET PRICE 07:29GMT FRIDAY***
- *$1.2904/99 May14-2019 low/Intraday low
- *$1.2882 Fibo 50% 1.3381-1.2382
- *$1.2876/75 Lower 1.0% 10-dma env/100-dma
- *$1.2852 May16-2019 high
- *$1.2841 Lower Bollinger Band (2%)
- *$1.2833/31 Feb12-2019 low/Jan21-2019 low
- *$1.2825 Jan16-2019 low
- *$1.2813/10 May21-2019 high/61.8% 1.1841-1.4377
- *$1.2784 Jun25-2019 high
- *$1.2770 Lower Bollinger Band (3%)
EUR/GBP: MNI KEY LEVELS
- *Gbp0.9151 Upper 1.0% 10-dma envelope
- *Gbp0.9134 Sep11-2017 high
- *Gbp0.9127/30 Cloud top/Upper Boll Band (2%)
- *Gbp0.9108 Jan03-2019 high
- *Gbp0.9079 Cloud base
- *Gbp0.9067/69 21-dma/50-dma
- *Gbp0.9060/62/65 200-hma/Jan11-2019 high/55-dma
- *Gbp0.9052 100-dma, Intraday high
- *Gbp0.9048/51 Jul16-2019 high/100-hma, Jul17-2019 high
- *Gbp0.9039 Jul18-2019 high
- *Gbp0.9038 ***CURRENT MARKET PRICE 07:29GMT FRIDAY***
- *Gbp0.9023 Intraday low
- *Gbp0.9010 Jul10-2019 high
- *Gbp0.9005/00 Jul23-2019 high, Lower Boll Band (2%)/Jul22-2019 high
- *Gbp0.8973/69 Lower Boll Band (3%)/Lower 1.0% 10-dma env
- *Gbp0.8953 Jul23-2019 low
- *Gbp0.8921 Jul02-2019 low
- *Gbp0.8905 200-dma
- *Gbp0.8879 Lower 2.0% 10-dma envelope
- *Gbp0.8874/73/72 Jun19-2019 low/Jun20-2019 low/Jun12-2019 low
- *Gbp0.8865 Fibo 61.8% 0.9108-0.8473
USD/JPY: MNI KEY LEVELS
- *Y105.51 55-dma
- *Y105.48 50-dma
- *Y105.28 Cloud base
- *Y105.18 21-dma
- *Y105.07 Cloud Kijun Sen
- *Y104.89 Cloud Tenkan Sen
- *Y104.87 Jan03-2019 low
- *Y104.73 200-hma
- *Y104.63 Intraday high
- *Y104.53/56 100-hma/Mar26-2018 low
- *Y104.39 ***CURRENT MARKET PRICE 07:29GMT FRIDAY***
- *Y104.13/10 Intraday low/Lower Boll Band (2%)
- *Y104.00 YTD low
- *Y103.94 200-mma
- *Y103.72 Lower 1.0% 10-dma envelope
- *Y103.56 Lower Bollinger Band (3%)
- *Y102.67 Lower 2.0% 10-dma envelope
- *Y101.62 Lower 3.0% 10-dma envelope
- *Y100.75 Sep30-2016 low
- *Y100.61 Fibo 50% 75.35-125.86
- *Y100.09 Sep27-2016 low
EUR/JPY: MNI KEY LEVELS
- *Y122.56 Jun13-2019 high
- *Y122.23 Jul12-2019 high
- *Y122.21 Lower 1.0% 10-dma envelope
- *Y122.16 Intraday high
- *Y122.13 Jun17-2019 high
- *Y122.09 Lower Bollinger Band (2%)
- *Y122.07 Fibo 61.8% 118.71-127.50
- *Y121.95 Fibo 50% 94.12-149.78
- *Y121.92 Jun20-2019 high
- *Y121.85 Jul15-2019 high
- *Y121.85 ***CURRENT MARKET PRICE 07:29GMT FRIDAY***
- *Y121.78 100-wma
- *Y121.62 Intraday low
- *Y121.42 Jul15-2019 low
- *Y121.24 Lower Bollinger Band (3%)
- *Y121.16 200-dma
- *Y120.98 Lower 2.0% 10-dma envelope
- *Y120.78 Jun03-2019 low
- *Y120.50 Jul23-2019 low
- *Y120.24 Fibo 61.8% 109.57-137.50
- *Y119.75 Lower 3.0% 10-dma envelope
AUD/USD: MNI KEY LEVELS
- *$0.7186/87/89 50-dma/55-dma/Cloud base
- *$0.7153/55 Apr17-2019 low/Upper 1.0% 10-dma env
- *$0.7140 Apr16-2019 low
- *$0.7116/21 Apr12-2019 low/21-dma
- *$0.7110/13 Apr10-2019 low/100-dma
- *$0.7094 200-hma
- *$0.7088/89 Apr08-2019 low/100-hma
- *$0.7069/73 Apr30-2019 high/Mar29-2019 low
- *$0.7053/56/57 Apr02-2019 low/Intraday high/Jul22-2019 high
- *$0.7044/48 Jul16-2019 high/May07-2019 high, Jul04-2019 high
- *$0.7016 ***CURRENT MARKET PRICE 07:29GMT FRIDAY***
- *$0.7013/12 Lower 1.0% 10-dma env/Intraday low
- *$0.7000 Lower Bollinger Band (2%)
- *$0.6985 Jan03-2019 low
- *$0.6971/67 Jul12-2019 low/Jun11-2019 high
- *$0.6942/41 Lower 2.0% 10-dma env/Lower Boll Band (3%)
- *$0.6909 Jun19-2019 high
- *$0.6893 100-wma
- *$0.6879 Jun20-2019 low
- *$0.6871 Lower 3.0% 10-dma envelope
- *$0.6855 Jun19-2019 low
USD/CAD: MNI KEY LEVELS
- *C$1.3546 200-dma
- *C$1.3476 Upper 2.0% 10-dma envelope
- *C$1.3452 Jun04-2019 high
- *C$1.3431/32 Upper Boll Band (3%), Jun06-2019 high/Jun18-2019 high
- *C$1.3407 Fibo 61.8% 1.3565-1.3151
- *C$1.3383 Jun19-2019 high
- *C$1.3376/77 50% 1.4690-1.2062/100-wma
- *C$1.3355/58 Upper Boll Band (2%)/50% 1.3565-1.3151
- *C$1.3346 Intraday high
- *C$1.3344/45 Upper 1.0% 10-dma env/Jun12-2019 high
- *C$1.3342 ***CURRENT MARKET PRICE 07:29GMT FRIDAY***
- *C$1.3331/28 100-dma/38.2% 1.2783-1.3665
- *C$1.3309/07 38.2% 1.3565-1.3151/Cloud top
- *C$1.3300 Jun13-2019 low
- *C$1.3295 Intraday low
- *C$1.3286 Jun20-2019 high
- *C$1.3248 100-hma
- *C$1.3240 Cloud base
- *C$1.3226/24 Jun10-2019 low/50% 1.2783-1.3665
- *C$1.3209/07/06 21-dma/50-dma/55-dma
- *C$1.3194 200-hma
Expiries for Oct30 NY cut 1000ET (Source DTCC)
- EUR/USD: $1.1700(E830mln), $1.1750-54(E1.5bln), $1.1800(E2.2bln), $1.1850(E1.7bln), $1.1870-75(E573mln), $1.1925(E571mln), $1.1950(E1.7bln-EUR calls), $1.2000(E1.3bln)
- USD/JPY: Y103.00($915mln), Y104.00($1.4bln), Y104.50($2.6bln), Y104.80-85($1.9bln), Y104.95-105.00($1.2bln), Y106.00-05($2.2bln), Y106.50($760mln)
- GBP/USD: $1.3100-10(Gbp543mln)
- EUR/JPY: Y123.50-55(E562mln), Y124.50(E497mln)
- USD/NOK: Nok9.80($500mln), Nok10.00($1.54bln)
- EUR/NOK: Nok10.75-76(E638mln), Nok10.77(E790mln), Nok10.80(E585mln), Nok10.90(E525mln)
- AUD/USD: $0.7180-85(A$783mln), $0.7200(A$632mln)
- AUD/JPY: Y76.75(A$602mln), Y77.45(A$1.2bln)
- AUD/NZD: N$1.0695-00(A$752mln), N$1.0750(A$1.2bln)
- USD/CAD: C$1.3025($1.1bln), C$1.3150($1.3bln), C$1.3225-30($626mln)
- USD/CNY: Cny6.63($883mln), Cny6.65($640mln), Cny6.67($500mln), Cny6.70($532mln), Cny6.72($860mln), Cny6.74($500mln)
Larger Option Pipeline
- EUR/USD: Nov03 $1.1900-05(E1.4bln); Nov06 $1.1600(E1.0bln)
- USD/JPY: Nov03 Y105.45-49($1.3bln); Nov04 Y105.00($1.1bln); Nov05 Y106.06-09($1.6bln)
- EUR/JPY: Nov05 Y124.50(E1.1bln)
- GBP/USD: Nov02 $1.3100(Gbp1.2bln), $1.3150(Gbp911mln)
- EUR/GBP: Nov02 Gbp0.8900(E2.1bln-EUR puts), Gbp0.9000(E1.4bln)
- AUD/USD: Nov02 $0.7140-45(A$1.9bln)
- USD/CNY: Nov03 Cny6.5334($1.2bln); Nov05 Cny6.75($1.0bln), Cny6.80($1.9bln), Cny6.85($1.3bln); Nov06 Cny6.70($1.2bln)
Why MNI
MNI is the leading provider
of intelligence and analysis on the Global Fixed Income, Foreign Exchange and Energy markets. We use an innovative combination of real-time analysis, deep fundamental research and journalism to provide unique and actionable insights for traders and investors. Our "All signal, no noise" approach drives an intelligence service that is succinct and timely, which is highly regarded by our time constrained client base.Our Head Office is in London with offices in Chicago, Washington and Beijing, as well as an on the ground presence in other major financial centres across the world.