
Why MNI
MNI is the leading provider
of intelligence and analysis on the Global Fixed Income, Foreign Exchange and Energy markets. We use an innovative combination of real-time analysis, deep fundamental research and journalism to provide unique and actionable insights for traders and investors. Our "All signal, no noise" approach drives an intelligence service that is succinct and timely, which is highly regarded by our time constrained client base.Our Head Office is in London with offices in Chicago, Washington and Beijing, as well as an on the ground presence in other major financial centres across the world.
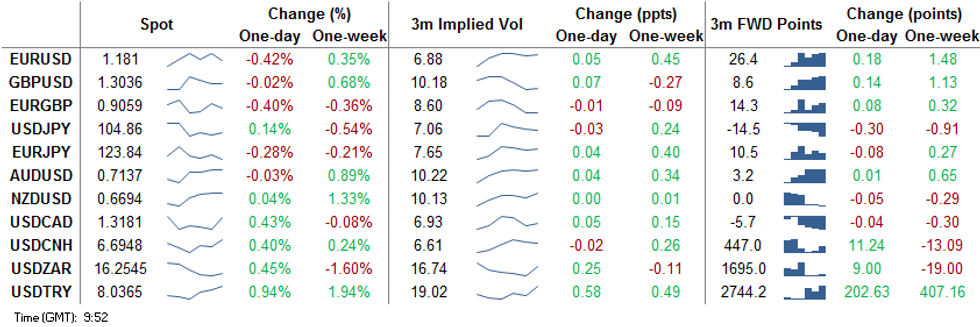
EUR Sluggish on Slipping European Equities
The EUR trades poorly despite initially holding up well in Asia-Pac hours. The single currency came under some selling pressure alongside the poor cash equity open in Europe, with German stocks coming under particular pressure as software giant SAP fell as much as 20% on a downward revision to their outlook.
EUR/USD is still well away from Friday's lows at 1.1787 which provide initial support, but persistent USD pressure could see the pair test the mark ahead of Monday's close.
Petrocurrencies are soft to start the week, with NOK and CAD falling against all others in G10 on a further pullback in crude. WTI and Brent futures trade lower by as much as 2.5%, with increased Libyan output responsible.
TRY hit another alltime low on worsening diplomatic relations with France, while USD/CNH extended its bounce after sanctioning US defense firms on Taiwanese weapons deals.
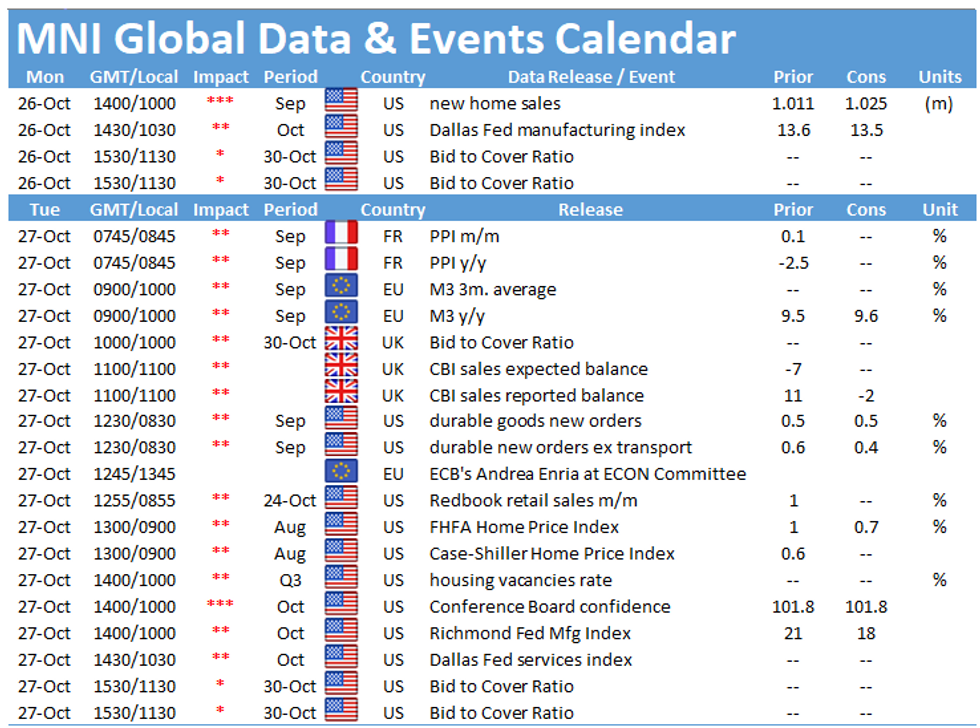
US new home sales and Dallas Fed manufacturing activity data are the calendar highlights. ECB's de Cos is due to speak, but the Fed speaker schedule is empty as the bank enters the media blackout period ahead of next week's policy decision.
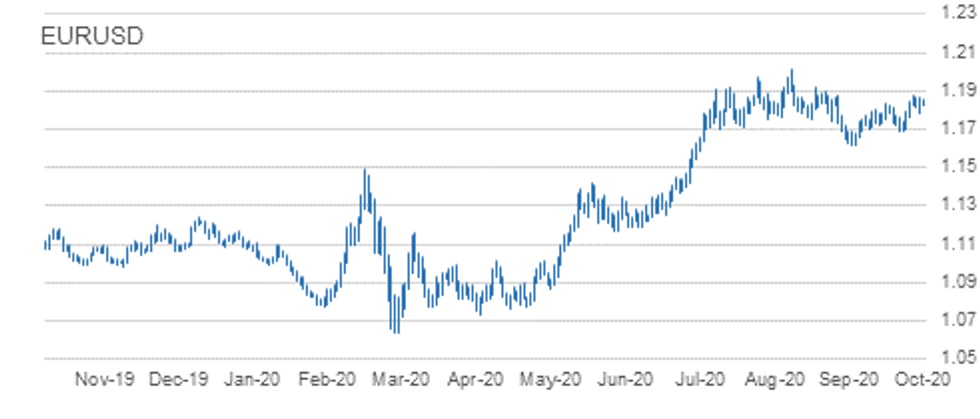
EUR/USD TECHS: Still Trading Below Last Week's High
- RES 4: 1.2011 High Sep and key resistance
- RES 3: 1.1917 Sep 10 high / 76.4% of the Sep 1 - 25 sell-off
- RES 2: 1.1904 1.0% 10-dma envelope
- RES 1: 1.1881 High Oct 21 and the intraday bull trigger
- PRICE: 1.1806 @ 09:43 GMT Oct 26
- SUP 1: 1.1787/60 Low Oct 23 / Oct 20
- SUP 2: 1.1747 50-day EMA
- SUP 3: 1.1729 Trendline support drawn off the Sep 28 low
- SUP 4: 1.1689 Low Oct 15 and a key support
EURUSD is softer this morning and still trading below last week's high of 1.1881. Despite the pullback, the outlook is positive and pullbacks are considered corrective. The recent breach of the former bull trigger at 1.1831, Oct 9 high reinforced the current bullish price structure and signals scope for 1.1917 next, a retracement level with the major resistance and hurdle for bulls at 1.2011, Sep 1 high. Key short-term trendline support is at 1.1729.
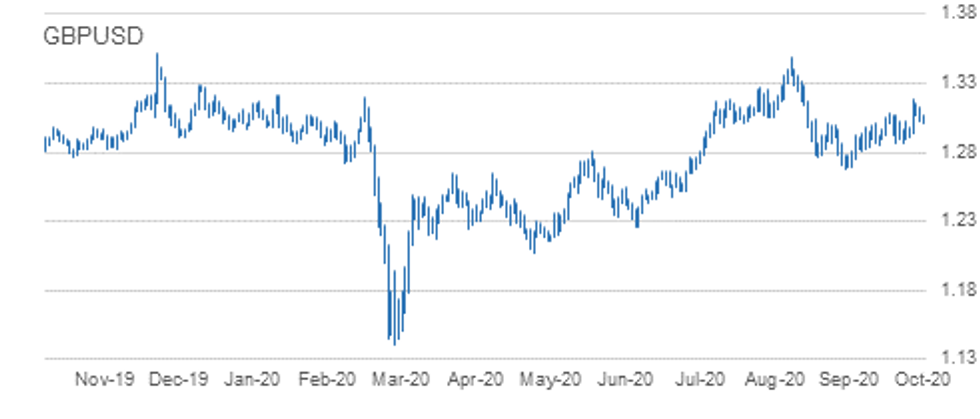
GBP/USD TECHS: Corrective Pullback
- RES 4: 1.3292 76.4% retracement of the Sep 1 - 23 sell-off
- RES 3: 1.3260 2.0% 10-dma envelope
- RES 2: 1.3245 Former trendline support drawn off the Mar 20 low
- RES 1: 1.3177 High Oct 21
- PRICE: 1.3040 @ 09:43 GMT Oct 26
- SUP 1: 1.2979 20-day EMA
- SUP 2: 1.2940 Low Oct 21
- SUP 3: 1.2863 Low Oct 14 and key near-term support
- SUP 4: 1.2806 Low Sep 30
GBPUSD continues to retrace the Oct 21 rally. The move lower is likely a correction though with the S/T bullish structure still intact. The Oct 21 climb reinforced the near-term bullish theme, confirming a resumption of the upleg that started on Sep 23. Attention is on 1.3245, the former trendline support drawn off the Mar 20 low. The trendline was breached on Sep 9. Firm support is at 1.2940, Oct 21 low. The reversal trigger lies at 1.2863, Oct 14 low.
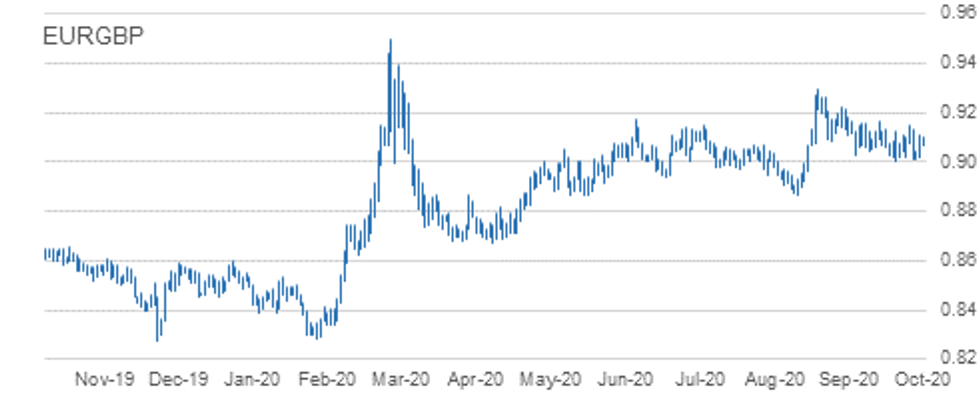
EUR/GBP TECHS: Focus Is On Support
- RES 4: 0.9162 High Oct 7
- RES 3: 0.9158 1.0% 10-dma envelope
- RES 2: 0.9149 Oct 20 high
- RES 1: 0.9107 High Oct 23
- PRICE: 0.9056 @ 09:49 GMT Oct 26
- SUP 1: 0.9012 Low Oct 21
- SUP 2: 0.9007 Low Oct 14 and the bear trigger
- SUP 3: 0.8967 76.4% retracement of the Sep 3 - 11 rally
- SUP 4: 0.8925 Low Sep 7
EURGBP is retracing Friday's gains. The outlook remains bearish following the sharp sell-off on Oct 21. Attention is on support at 0.9007, Oct 14 low and the near-term bear trigger. A break of 0.9007 would confirm a resumption of the downtrend that started Sep 11 and expose 0.8967, a retracement point. Key resistance has been defined at 0.9149, Oct 20 high. Clearance of this level would undermine bearish conditions.
USD/JPY TECHS: Bearish Focus
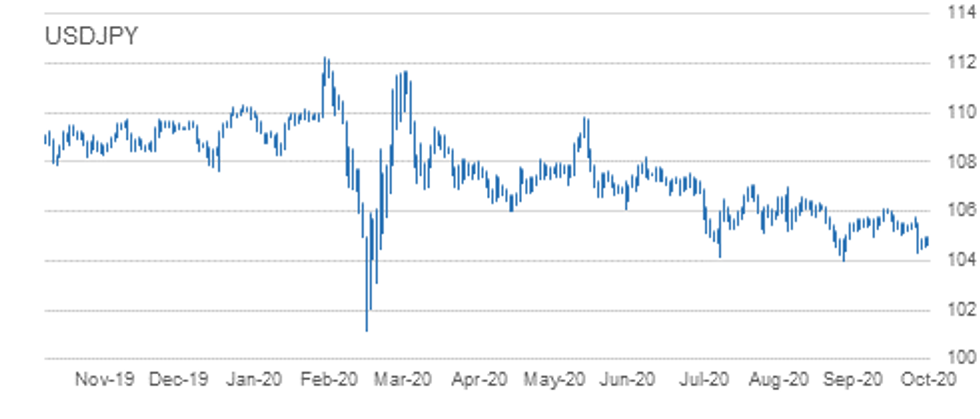
- RES 4: 106.11 High Oct 7 and key resistance
- RES 3: 105.75 High Oct 20
- RES 2: 105.53/63 High Oct 21 / 50-dma
- RES 1: 105.04 Low Oct 4 and a recent breakout level
- PRICE: 104.85 @ 09:50 GMT Oct 26
- SUP 1: 104.34 Low Oct 21
- SUP 2: 104.00 Low Sep 21 and the bear trigger
- SUP 3: 103.67 76.4% retracement of the Mar 9 - 24 rally
- SUP 4: 103.09 Low Mar 12
USDJPY is consolidating. The pair maintains a weaker outlook following the Oct 21 sell-off and the resumption of the downleg from 106.11, Oct 7 high. A number of important supports have been cleared signalling scope for a deeper pullback towards the key 104.00 handle, Sep 21 low. A break of 104.00 would suggest scope for further USD depreciation within the bear channel drawn off the Mar 24 high. Initial resistance is at 105.04.
EUR/JPY TECHS: Holding Above Support For Now
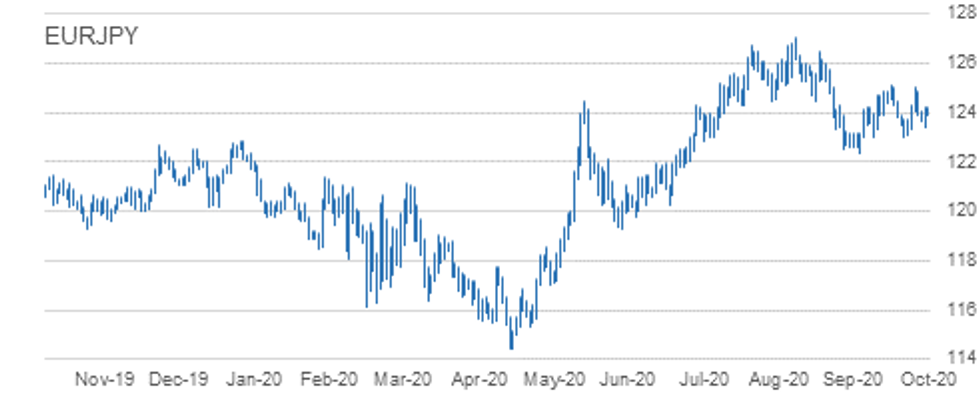
- RES 4: 125.97 76.4% retracement of the Sep 1 - 28 sell-off
- RES 3: 125.28 61.8% of the Sep 1 - 28 sell-off
- RES 2: 125.00/09 High Oct 20 and Oct 9
- RES 1: 124.23 High Oct 23 and intraday high
- PRICE: 123.86 @ 09:54 GMT Oct 26
- SUP 1: 123.41 Low Oct 23
- SUP 2: 123.03/02 Low Sep 29 and Oct 2 / Low Oct 15
- SUP 3: 122.38/28 Low Sep 28 / 61.8% of the Jun 22 - Sep 1 rally
- SUP 4: 122.25 38.2% retracement of the May - Sep rally
EURJPY is largely unchanged and still trading below recent highs. Attention is on support at 123.03/02, low prints between Sep 29 and Oct 15. A break of this level would undermine the recent bullish outlook and instead highlight risk for a deeper sell-off towards 122.38, Sep 28 low and the bear trigger. Moving average studies are in a neutral position. To strengthen a bullish argument, price needs to clear key resistance at 125.09, Oct 9 high.
AUD/USD TECHS: Trendline Resistance Still Intact
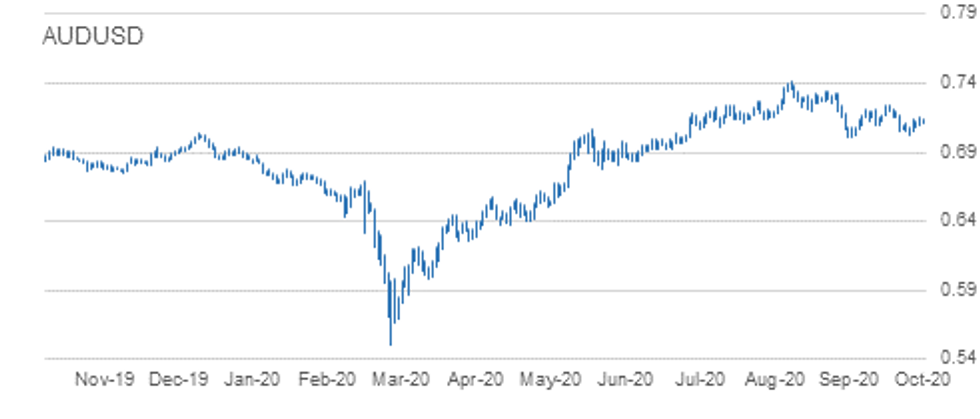
- RES 4: 0.7324 High Sep 21
- RES 3: 0.7243 High Oct 10 and the intraday bull trigger
- RES 2: 0.7169/70 Trendline drawn off the Sep 1 high / High Oct 15
- RES 1: 0.7158 High Oct 23
- PRICE: 0.7138 @ 09:56 GMT Oct 26
- SUP 1: 0.7021 Low Oct 20
- SUP 2: 0.7006 Low Sep 25 and the bear trigger
- SUP 3: 0.6965 23.6% retracement of the Mar - Sep rally
- SUP 4: 0.6931 0.764 projection of Sep 1 - 25 sell-off from Oct 9 high
AUDUSD outlook remains bearish despite last week's recovery. The pair continues to trade below trendline resistance drawn off the Sep 1 high. The line intersects at 0.7169 and the recent failure at the trendline highlights a bearish risk. Attention is on the primary support and bear trigger at 0.7006, Sep 25 low. A trendline resistance break is needed to alter the picture that would signal a stronger reversal. This would open 0.7243, Oct 10 high.
USD/CAD TECHS: Trading Above Last Week's Low

- RES 4: 1.3421 High Sep 30 and primary resistance
- RES 3: 1.3341 High Oct 7
- RES 2: 1.3241/59 50-day EMA / High Oct 15 and the bull trigger
- RES 1: 1. 3190 20-day EMA
- PRICE: 1.3182 @ 09:58 GMT Oct 26
- SUP 1: 1.3081 Low Oct 21 and the intraday bear trigger
- SUP 2: 1.3047 Low Sep 7
- SUP 3: 1.3038 Low Sep 2
- SUP 4: 1.2994 Low Sep 1 and the major support
Despite still trading above last week's low, USDCAD bearish conditions remain intact. The pair last week traded below key support at 1.3099, Oct 13 low. The move lower confirms a resumption of the current downtrend that started Sep 30. Moving average studies are bearish too, reinforcing the current climate. Scope exists for a move towards the major support at 1.2994, Sep 1 low. Key resistance has been defined at 1.3259, Oct 15 high.
EUR/USD: MNI KEY LEVELS
- *$1.2023 Upper 2.0% 10-dma envelope
- *$1.2009/11 May03-2018 high/YTD Sep01 high
- *$1.1996 May14-2018 high
- *$1.1938 May15-2018 high
- *$1.1921 Upper Bollinger Band (3%)
- *$1.1906 Upper 1.0% 10-dma envelope
- *$1.1872 Upper Bollinger Band (2%)
- *$1.1857/61 100-mma/Intraday high
- *$1.1851 Cloud top, Jun14-2018 high
- *$1.1837 100-hma
- *$1.1829 ***CURRENT MARKET PRICE 07:09GMT MONDAY***
- *$1.1828 Intraday low
- *$1.1815 Sep24-2018 high
- *$1.1798/97 55-dma/50-dma
- *$1.1786 200-hma
- *$1.1769 21-dma
- *$1.1757 Sep27-2018 high
- *$1.1736 Fibo 38.2% 1.3993-1.0341
- *$1.1677 Lower Bollinger Band (2%)
- *$1.1670 Lower 1.0% 10-dma envelope
- *$1.1651 Sep28-2018 high
GBP/USD: MNI KEY LEVELS
- *$1.3185 May06-2019 high
- *$1.3144 Fibo 38.2% 1.4377-1.2382
- *$1.3131/33 May07-2019 high/Apr12-2019 high
- *$1.3119/24 Upper Boll Band (2%)/Upper 1.0% 10-dma env
- *$1.3109 Fibo 50% 1.1841-1.4377
- *$1.3075/80 Intraday high/May08-2019 high
- *$1.3053 100-hma
- *$1.3041/45 May13-2019 high/Cloud top
- *$1.3017 55-dma
- *$1.3012 50-dma
- *$1.3004 ***CURRENT MARKET PRICE 07:09GMT MONDAY***
- *$1.3003/02/99 Intraday low/200-hma/61.8% 1.3381-1.2382
- *$1.2991 May10-2019 low
- *$1.2981 Cloud base
- *$1.2970 May14-2019 high
- *$1.2962 21-dma
- *$1.2952/47 50-mma/200-wma
- *$1.2904 May14-2019 low
- *$1.2882 Fibo 50% 1.3381-1.2382
- *$1.2864/62 Lower 1.0% 10-dma env/100-dma
- *$1.2852 May16-2019 high
EUR/GBP: MNI KEY LEVELS
- *Gbp0.9307 Aug29-2017 high
- *Gbp0.9254 Upper 2.0% 10-dma envelope
- *Gbp0.9226 Sep04-2017 high
- *Gbp0.9203 Sep08-2017 high
- *Gbp0.9176 Upper Bollinger Band (3%)
- *Gbp0.9163 Upper 1.0% 10-dma envelope
- *Gbp0.9144 Upper Bollinger Band (2%)
- *Gbp0.9134 Sep11-2017 high
- *Gbp0.9104/08 Cloud top/Jan03-2019 high
- *Gbp0.9097 Intraday high
- *Gbp0.9095 ***CURRENT MARKET PRICE 07:09GMT MONDAY***
- *Gbp0.9080/79 21-dma/Cloud base
- *Gbp0.9070/69/67 Intraday low/100-hma/50-dma
- *Gbp0.9065/62 200-hma, 55-dma/Jan11-2019 high
- *Gbp0.9051/49/48 Jul17-2019 high/100-dma/Jul16-2019 high
- *Gbp0.9039 Jul18-2019 high
- *Gbp0.9015/10 Lower Boll Band (2%)/Jul10-2019 high
- *Gbp0.9005/00 Jul23-2019 high/Jul22-2019 high
- *Gbp0.8983/82 Lower Boll Band (3%)/Lower 1.0% 10-dma env
- *Gbp0.8953 Jul23-2019 low
- *Gbp0.8921 Jul02-2019 low
USD/JPY: MNI KEY LEVELS
- *Y106.15 Upper Bollinger Band (2%)
- *Y105.86 Cloud top
- *Y105.68 55-dma
- *Y105.59 50-dma
- *Y105.49 Cloud base
- *Y105.40 21-dma
- *Y105.13 200-hma
- *Y105.06 Cloud Kijun Sen
- *Y105.05 Cloud Tenkan Sen
- *Y104.97 Intraday high
- *Y104.97 ***CURRENT MARKET PRICE 07:09GMT MONDAY***
- *Y104.91/87 100-hma/Jan03-2019 low
- *Y104.66 Intraday low
- *Y104.63 Lower Bollinger Band (2%)
- *Y104.56 Mar26-2018 low
- *Y104.25 Lower Bollinger Band (3%)
- *Y104.10 Lower 1.0% 10-dma envelope
- *Y104.00 YTD low
- *Y103.94 200-mma
- *Y103.05 Lower 2.0% 10-dma envelope
- *Y102.00 Lower 3.0% 10-dma envelope
EUR/JPY: MNI KEY LEVELS
- *Y125.01 Upper Bollinger Band (2%)
- *Y124.93 Fibo 38.2% 149.78-109.57
- *Y124.80 50-mma
- *Y124.69 55-dma
- *Y124.57 50-dma
- *Y124.51 Fibo 61.8% 126.81-120.78
- *Y124.34 Apr01-2019 low
- *Y124.25 May07-2019 high
- *Y124.23 Intraday high
- *Y124.17/22 100-hma/38.2% 133.13-118.71
- *Y124.16 ***CURRENT MARKET PRICE 07:09GMT MONDAY***
- *Y124.14 Fibo 38.2% 118.71-127.50
- *Y124.04 21-dma
- *Y124.01 Cloud Tenkan Sen
- *Y123.90 200-hma
- *Y123.89 Intraday low
- *Y123.80 Fibo 50% 126.81-120.78
- *Y123.74 May21-2019 high, Cloud Kijun Sen
- *Y123.72 Fibo 61.8% 115.21-137.50
- *Y123.68 Cloud base
- *Y123.55 100-dma
AUD/USD: MNI KEY LEVELS
- *$0.7234 Upper Bollinger Band (2%)
- *$0.7206/07 Apr17-2019 high/Feb21-2019 high
- *$0.7194/97 55-dma/50-dma
- *$0.7181 Upper 1.0% 10-dma envelope
- *$0.7168 Cloud base
- *$0.7153 Apr17-2019 low
- *$0.7142 Intraday high
- *$0.7136/40 21-dma/Apr16-2019 low
- *$0.7116 Apr12-2019 low
- *$0.7108/10 100-dma/Apr10-2019 low
- *$0.7108 ***CURRENT MARKET PRICE 07:09GMT MONDAY***
- *$0.7107/02 Intraday low/100-hma
- *$0.7100 200-hma
- *$0.7088 Apr08-2019 low
- *$0.7073/69 Mar29-2019 low/Apr30-2019 high
- *$0.7057/53 Jul22-2019 high/Apr02-2019 low
- *$0.7048/44 Jul04-2019 high, May07-2019 high/Jul16-2019 high, Lower Boll Band (2%)
- *$0.7039 Lower 1.0% 10-dma envelope
- *$0.6996 Lower Bollinger Band (3%)
- *$0.6985 Jan03-2019 low
- *$0.6971/68/67 Jul12-2019 low/Lower 2.0% 10-dma env/Jun11-2019 high
USD/CAD: MNI KEY LEVELS
- *C$1.3339 100-dma
- *C$1.3328 Fibo 38.2% 1.2783-1.3665
- *C$1.3320 Cloud top
- *C$1.3309 Fibo 38.2% 1.3565-1.3151
- *C$1.3300 Jun13-2019 low
- *C$1.3286/91 Jun20-2019 high/Upper 1.0% 10-dma env
- *C$1.3224/26 50% 1.2783-1.3665/Jun10-2019 low
- *C$1.3216 21-dma
- *C$1.3198/03 50-dma/55-dma
- *C$1.3174/75 Intraday high/50-mma
- *C$1.3173 ***CURRENT MARKET PRICE 07:09GMT MONDAY***
- *C$1.3164/63/62 Jul23-2019 high/Feb21-2019 low/200-hma
- *C$1.3160 200-wma
- *C$1.3153/51/50 Cloud base/Jun20-2019 low/Feb20-2019 low
- *C$1.3140 100-hma
- *C$1.3126 Intraday low
- *C$1.3120/16 61.8% 1.2783-1.3665/Jul23-2019 low
- *C$1.3113 Feb25-2019 low
- *C$1.3107 Jun26-2019 low
- *C$1.3066 Fibo 38.2% 1.4690-1.2062
- *C$1.3053 Fibo 38.2% 1.2062-1.3665
OPTIONS: Expiries for Oct26 NY cut 1000ET (Source DTCC)
- EUR/USD: $1.1500(E1.8bln), $1.1630-35(E559mln), $1.1650-60(E1.6bln), $1.1750(E651mln), $1.1800(E524mln), $1.1830-45(E1.1bln)
- USD/JPY: Y103.95-104.00($2.5bln-USD puts), Y104.20-25($583mln), Y105.00($898mln), Y105.30-40($1.7bln), Y105.60-75($1.2bln), Y106.95-107.00($1.6bln)
- EUR/JPY: Y122.80(E1.2bln), Y123.10(E717mln)
- EUR/GBP: Gbp0.8900(E880mln), Gbp0.9000(E2.2bln-EUR puts)
- AUD/USD: $0.7100(A$609mln)
- AUD/NZD: N$1.0809-10(A$560mln), N$1.0815(A$1.7bln)
-----------------------------------
Larger Option Pipeline
- EUR/USD: Oct28 $1.1745-60(E1.1bln), $1.1800-05(E1.5bln), $1.2000(E2.7bln); Oct30 $1.1800(E1.1bln), $1.1850(E1.2bln), $1.1950(E1.7bln-EUR calls), $1.2000(E1.1bln); Nov03 $1.1900-05(E1.1bln)
- USD/JPY: Oct27 Y105.00($1.3bln), Y105.25-35($1.0bln), Y106.00-05($1.2bln); Oct28 Y104.85-90($1.2bln), Y105.00($1.5bln), Y105.30-40($1.4bln); Oct29 Y103.20-25($1.6bln), Y104.00($1.6bln), Y105.25($1.3bln), Y105.55-65($2.2bln), Y106.00($1.2bln); Oct30 Y104.50($1.9bln), Y104.80-85($1.1bln), Y106.00-05($2.2bln); Nov03 Y105.45-49($1.3bln); Nov04 Y105.00($1.1bln); Nov05 Y106.06-09($1.6bln)
- EUR/JPY: Nov05 Y124.50(E1.0bln)
- EUR/GBP: Nov02 Gbp0.8900(E1.6bln-EUR puts)
- AUD/USD: Oct27 $0.6680(A$1.1bln); Nov02 $0.7140-45(A$1.5bln)
- AUD/JPY: Oct29 Y73.20(A$1.0bln-AUD puts), Y76.35-40(A$2.4bln-AUD calls)
- AUD/NZD: Oct27 N$1.0809-20(A$2.5bln); Oct30 N$1.0750(A$1.2bln)
- USD/CNY: Nov03 Cny6.5334($1.1bln); Nov05 Cny6.75($1.0bln), Cny6.80($1.9bln), Cny6.85($1.3bln)
Why MNI
MNI is the leading provider
of intelligence and analysis on the Global Fixed Income, Foreign Exchange and Energy markets. We use an innovative combination of real-time analysis, deep fundamental research and journalism to provide unique and actionable insights for traders and investors. Our "All signal, no noise" approach drives an intelligence service that is succinct and timely, which is highly regarded by our time constrained client base.Our Head Office is in London with offices in Chicago, Washington and Beijing, as well as an on the ground presence in other major financial centres across the world.