
Free Trial
Why MNI
MNI is the leading provider
of intelligence and analysis on the Global Fixed Income, Foreign Exchange and Energy markets. We use an innovative combination of real-time analysis, deep fundamental research and journalism to provide unique and actionable insights for traders and investors. Our "All signal, no noise" approach drives an intelligence service that is succinct and timely, which is highly regarded by our time constrained client base.Our Head Office is in London with offices in Chicago, Washington and Beijing, as well as an on the ground presence in other major financial centres across the world.
ASIA
Equity outflows from offshore investors were evident across the region last week. The table below presents flows across the major economies in the region for the past week, month and 2023 to date (note for China this represents Northbound stock connect flows).
- Even with the outflows seen over the past week, for February to date a lot of markets still remain in positive territory from a flow standpoint. This is even more evident when looking at 2023 as a whole.
Table 1: EM Asia Equity Flows
| Past Week | Month To Date | 2023 To Date | |
| China* (Yuan bn) | -4.1 | 12.5 | 153.8 |
| South Korea (USDmn) | -742 | 1329 | 6440 |
| Taiwan (USDmn) | -418 | 1107 | 8348 |
| India (USDmn) | -37 | 283 | -3377 |
| Indonesia (USDmn) | 20 | 224 | 20 |
| Thailand (USDmn) | -563 | -1109 | -564 |
| Malaysia (USDmn) | 46 | -6 | -88 |
| Philippines (USDmn) | -32 | -63.2 | 58.8 |
| * Northbound Stock Connect Flows |
Source: MNI - Market News/Bloomberg
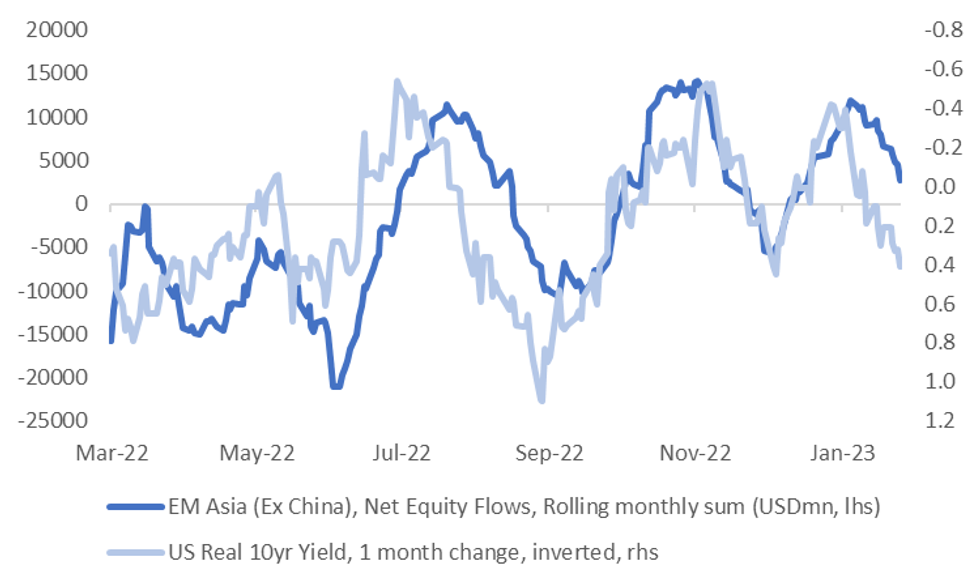
- We aren't at previous trough points for EM Asia (ex China) flows, at least on a rolling monthly sum basis, see the second chart below.
- There is even less confidence of a trough point given the one key driver of such outflow pressures, higher US real yields, continues to move against the flow picture.
- Taiwan and South Korea flows have the largest negative correlation with 1 month changes in US real yields over the past 12 months. This likely reflects the tech exposure in both of these markets. All other economies in the region have a negative correlation with real yields, except for Indonesia and Malaysia.
- Indonesia's correlation has been positive which likely owes to the relationship between commodity prices and real yields, i.e. both were going up over the past 12 months, However, this is not the case for the most recent round of US real yield strength, which may impart less of a positive bias in terms of Indonesian equity flows.
Fig 1: EM Asia (Ex China) Equity Flows & US Real 10 Yr Yield
Source: MNI - Market News/Bloomberg
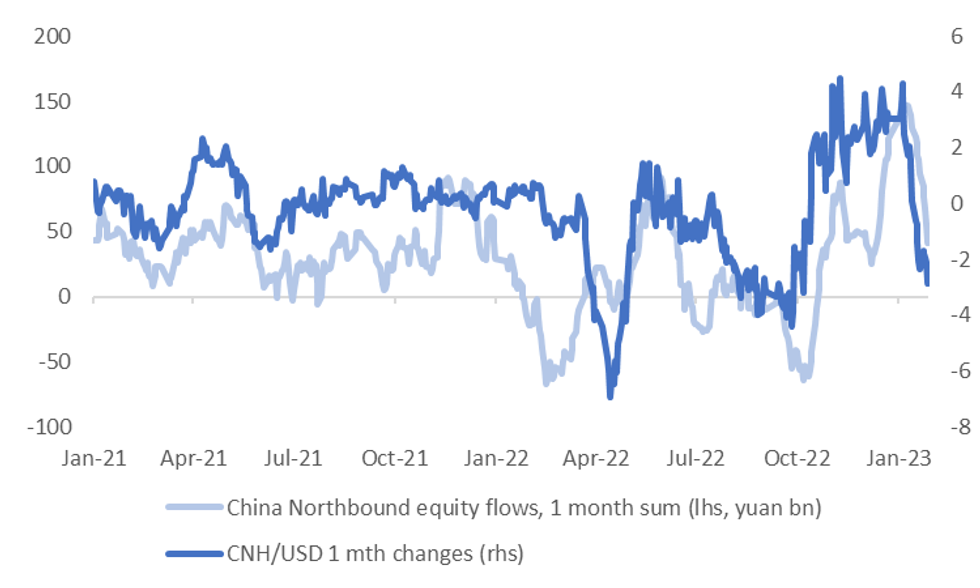
- The markets may be hoping for positive news this week in terms of China PMI prints, and what it states about the recovery process. Next week's National People's Congress will also be eyed closely in terms of 2023 growth targets and the outlook for key sectors such as housing.
- The final chart plots CNH against Northbound equity flows. Any positive news from China has scope to spill over to the rest of the region.
Fig 2: CNH Versus Northbound Equity Flows
Source: MNI - Market News/ Bloomberg
Why MNI
MNI is the leading provider
of intelligence and analysis on the Global Fixed Income, Foreign Exchange and Energy markets. We use an innovative combination of real-time analysis, deep fundamental research and journalism to provide unique and actionable insights for traders and investors. Our "All signal, no noise" approach drives an intelligence service that is succinct and timely, which is highly regarded by our time constrained client base.Our Head Office is in London with offices in Chicago, Washington and Beijing, as well as an on the ground presence in other major financial centres across the world.
We are facing technical issues, please contact our team.
ok
Your request was sent sucessfully! Our team will contact you soon.
ok