
Free Trial
Why MNI
MNI is the leading provider
of intelligence and analysis on the Global Fixed Income, Foreign Exchange and Energy markets. We use an innovative combination of real-time analysis, deep fundamental research and journalism to provide unique and actionable insights for traders and investors. Our "All signal, no noise" approach drives an intelligence service that is succinct and timely, which is highly regarded by our time constrained client base.Our Head Office is in London with offices in Chicago, Washington and Beijing, as well as an on the ground presence in other major financial centres across the world.
EMERGING MARKETS
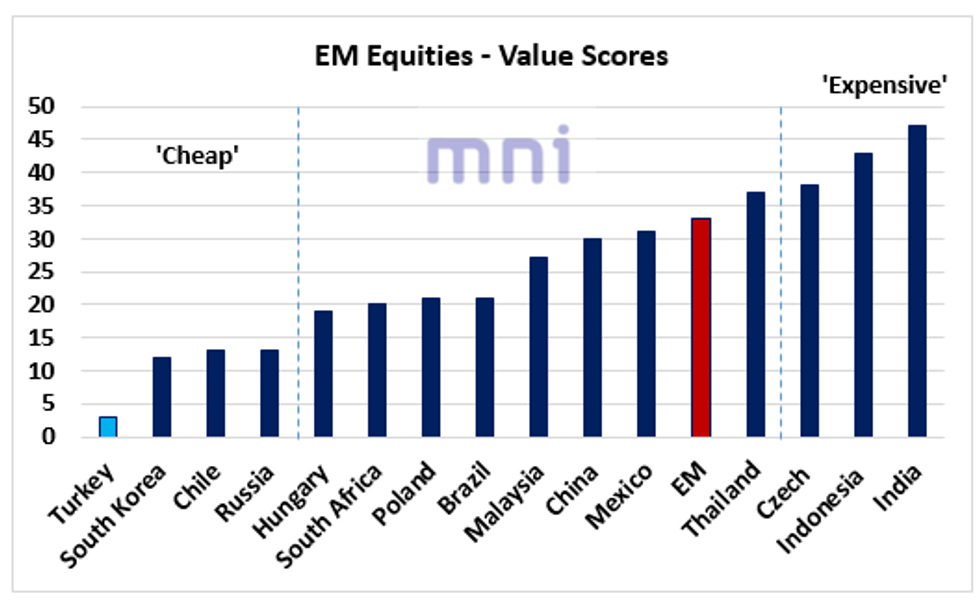
- In this chart, we rank the 16 EM equity markets (15 countries + EM index - MXEF Index) from 'cheapest' to the most 'expensive' ones based on the Price-to-Book, Price-to-Sales and Price-to-Earnings ratios.
- To compute the score of each EM equity markets, we simply add the rank each time; hence, the lowest score that a EM country can have is 3 (the cheapest) and the highest score is 48 (most expensive).
- As expected, Turkish equities still appear the cheapest according to our scoring model (lowest score of 3) as TRY weakness due to dovish CBRT and political uncertainty have been weighing on Turkish risky assets. TRY has been the weakest EM FX performer in 2021, down 15.7% against the US Dollar.
- South Korea is also 'cheap' relative to other EM equity markets even though Korea equities have been trading at new all-time highs recently.
- On the other hand, Czech equities, which are currently trading at a 13-year high, mostly driven by 'hawkish' CNB and broad CZK strength, appear 'expensive' according to our scoring model.
- Indian equities remain the most expensive market, with current price-to-book and PE ratios of 4 and 30.56, respectively (vs. 1.87 and 15.77 for the EM MSCI index).
Source: Bloomberg/MNI
Why MNI
MNI is the leading provider
of intelligence and analysis on the Global Fixed Income, Foreign Exchange and Energy markets. We use an innovative combination of real-time analysis, deep fundamental research and journalism to provide unique and actionable insights for traders and investors. Our "All signal, no noise" approach drives an intelligence service that is succinct and timely, which is highly regarded by our time constrained client base.Our Head Office is in London with offices in Chicago, Washington and Beijing, as well as an on the ground presence in other major financial centres across the world.
We are facing technical issues, please contact our team.
ok
Your request was sent sucessfully! Our team will contact you soon.
ok