
Free Trial
Why MNI
MNI is the leading provider
of intelligence and analysis on the Global Fixed Income, Foreign Exchange and Energy markets. We use an innovative combination of real-time analysis, deep fundamental research and journalism to provide unique and actionable insights for traders and investors. Our "All signal, no noise" approach drives an intelligence service that is succinct and timely, which is highly regarded by our time constrained client base.Our Head Office is in London with offices in Chicago, Washington and Beijing, as well as an on the ground presence in other major financial centres across the world.
Tsy/Eurodlr Mkt Roundup, Short End Pricing in Hawkish Fed Policy
Markets continued to react to Wed's FOMC's hawkish hold, short end under heavy pressure as they priced in 125-150bp in rate hikes by yr end, another 50bp in 2023.Hopefully we'll get more insight on "sooner, faster" asset reductions when the Fed comes out of media blackout Fri.
- Lead quarterly Eurodollar futures (EDH2) remained under pressure (-0.060 at 99.475) after latest 3M LIBOR set' surged +0.02143 to 0.29900% (+0.04129/wk) highest 3M level since May 2020.
- Done and dusted: 25bp hike fully priced into Mar (some dealers starting to estimate 50bp hike in March) while Jun is more than halfway to pricing in 50bp as a result of Wed's hawkish hold from the FOMC.
- Active accts continued to add to downside/rate hike positioning: late block cross as one example: +10,000 Red Mar'23 96.75p 5.0 w/ Red Sep 96.75/97.75 put strip 50.5 cvrd. On the flipside, some significant unwinds reported even before the NY open: -60,000 short Mar 98.25 puts, 8.5-7.5.
- Tsy yld curves flattened (5s30s 42.78) while 7s10s see-sawed around 2.196 (-.843), little reaction to a small stop for $53B 7Y note auction (91282CDW8): 1.769% high yield vs. 1.770% WI; 2.36x bid-to-cover vs. 2.21x last month.
- Friday data focus on personal income/spending, ECI and U-Mich sentiment.
- The 2-Yr yield is up 3.4bps at 1.1842%, 5-Yr is down 2.5bps at 1.6599%, 10-Yr is down 5.4bps at 1.8101%, and 30-Yr is down 7.1bps at 2.0936%.
SHORT TERM RATES
US DOLLAR LIBOR: Latest settlements:
- O/N -0.00071 at 0.07743% (+0.00272/wk)
- 1 Month -0.00414 to 0.10500% (-0.00271/wk)
- 3 Month +0.02143 to 0.29900% (+0.04129/wk) ** Record Low 0.11413% on 9/12/21
- 6 Month +0.05471 to 0.51871% (+0.07428/wk)
- 1 Year +0.11286 to 0.92157% (+0.12300/wk)
- Daily Effective Fed Funds Rate: 0.08% volume: $78B
- Daily Overnight Bank Funding Rate: 0.07% volume: $278B
- Secured Overnight Financing Rate (SOFR): 0.04%, $926B
- Broad General Collateral Rate (BGCR): 0.05%, $347B
- Tri-Party General Collateral Rate (TGCR): 0.05%, $333B
- (rate, volume levels reflect prior session)
- Tsy 22.5Y-30Y, $1.799B accepted vs. $3.874B submission
- Next scheduled purchases
- Mon 01/31 1010-1030ET: Tsy 2.25Y-4.5Y, appr $8.425B vs. $6.325B prior
- Tue 02/01 1100-1120ET: TIPS 7.5Y-30Y, appr $1.225B vs. $0.925B prior
- Thu 02/03 1100-1120ET: Tsy 10Y-22.5Y, appr $1.625B steady
- Tue 02/08 1010-1030ET: Tsy 22.5Y-30Y, appr $1.825B steady
- Thu 02/10 1010-1030ET: Tsy 7Y-10Y, appr $3.225B vs. $2.425B prior
FED Reverse Repo Operation
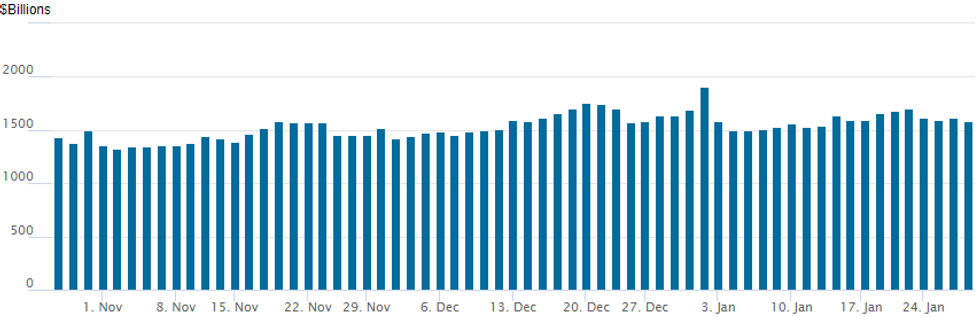
NY Federal Reserve/MNI
NY Fed reverse repo usage recedes to $1,583.895B w/85 counterparties vs. $1,613.046B prior session -- remains well off all-time high of $1,904.582B on Friday, December 31.
EURODOLLAR/TREASURY OPTIONS SUMMARY
Eurodollar Options- Block, 10,000 Red Mar'23 96.75p 5.0 w/ Red Sep 96.75/97.75 put strip 50.5 cvrd
- 5,000 short Mar 98.37/98.56/98.75 call flys
- +25,000 Jun 98.75/98.87 put spds, 1.75
- Block, total 8,000 3M SOFR May 98.87/99.06/99.18 put flys, 2.5
- 30,000 Jun 98.81/98.93/99.06 put flys
- 10,500 Feb 98.31/May 98.56 call spds
- Feb/Mar 98.25 put spds
- 15,000 May 99.06 puts
- Overnight trade
- -60,000 short Mar 98.25 puts, 8.5-7.5
- +12,000 short Mar 98.12/98.25 put spds, 3.5
- +11,000 short Apr 98.00/98.12 put spds, 5
- 12,000 Jun 98.81/98.93/99.06 put flys
- -5,000 Jun 99.12/99.25/99.37 put trees, 9.5
- 6,000 Jun 99.06/99.18 call spds
- 5,000 Feb/Mar 98.12/98.31 put spd spd
- 5,000 short Mar 99.43 calls, .25
- Block, +22,500 Sep 98.93/99.06 put spds, 8.5
- Block, 7,000 short Mar 99.00 calls, 1.0 vs. 98.39/0.05%
- +10,000 wk1 TY 123 puts, cab-7
- 10,000 TYH/TYJ 122 call spd
- 5,000 TYH/TYJ 121 call spd
- 3,000 TYH 126/127/128 1x3x2 put flys
- 2,000 FVH 118.25/119/119.5/120 broken put condors
- 1,000 USH 152/155 3x2 put spds
- 16,000 FVH 118.5 puts, 14, over 21k total since O/N from 12-18
- FVH 118.75 puts trading 17 w/over 17.5k volume on day, -5k at 24.5 open
- 5,000 TYJ 129 calls, 27
- 10,000 TYH 128.25 calls, 23
- 2,500 TYH 125.5/126/127/127.5 put condors, 9
- >16,000 TYH 129.5 calls, mostly 5-6
- Overnight trade
- +15,000 FVH 117.5/118.25 put spds, 8-9
- 26,000 TYH 127.5 puts, 44-42
- 5,000 TYH 125 puts, 5
EGBs-GILTS CASH CLOSE: Bear Flattening And BTPs Stand Out
European curves bear flattened Thursday in the wake of the hawkish Federal Reserve meeting after hours Wednesday, though retraced some losses over the course of the session.
- The UK short end underperformed across the core FI space. Some analysts posted more hawkish near-term BoE policy outlooks, ahead of next week's MPC.
- BTPs stood out, with spreads compressing sharply in contrast to previous sessions' widening:
- 10Y yields saw their biggest drop since Dec 17 (after hitting the highest yield since Jun 2020) as the presidential election impasse continued into Friday.
Closing Yields / 10-Yr Periphery EGB Spreads To Germany
- Germany: The 2-Yr yield is up 3.4bps at -0.611%, 5-Yr is up 3.4bps at -0.319%, 10-Yr is up 1.5bps at -0.059%, and 30-Yr is down 1.8bps at 0.228%.
- UK: The 2-Yr yield is up 4.5bps at 0.961%, 5-Yr is up 4.3bps at 1.065%, 10-Yr is up 3bps at 1.228%, and 30-Yr is up 1.9bps at 1.351%.
- Italian BTP spread down 5.7bps at 134.5bps / Spanish down 1.8bps at 72.8bps
EGB Options: Mostly Downside
Thursday's Europe rates / bond options flow included:
- IKH2 144/142ps 1x1.5, bought for 34 in 1k
- RXH2 168/167.5ps, bought for 8 in 4.2k
- ERU2 100.375/100.25 ps vs sold 100.50/100.625 cs, bought the ps for 2 in 8k
- ERZ2 100/99.75/99.50p fly, bought for 1.75 in 2k
- 0RM2 99.875/99.75 ps vs 100.125/100.25 cs, bought the ps for flat in 6.4k
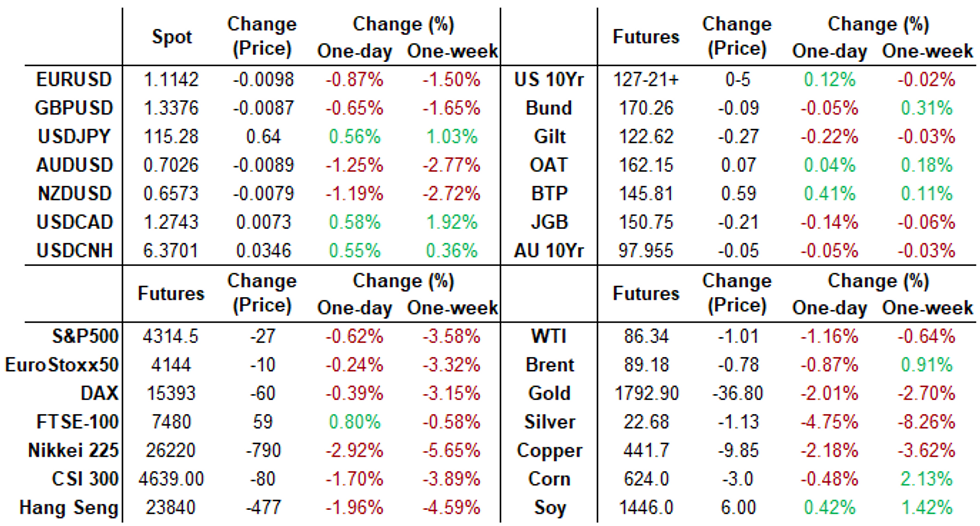
FOREX: EURUSD Through Support As Greenback Surges, AUD and NZD Sink
- The dollar index surged to fresh 18-month highs as the January FOMC meeting shifted the 2022 US tightening outlook in a much more hawkish direction. The DXY was helped by EURUSD clearing significant support at 1.1185.
- By confirming the resumption of the broader downtrend that started on Jan 6, 2021 weakness has extended to within close proximity of the first support at 1.1128, a Fibonacci projection. EURUSD remains in a bear channel of which the base lies at 1.1031 today. The channel is drawn from the Jun 1 2021 high.
- With risk continuing to look shaky and equities falling significantly from their intra-day highs, Aussie and Kiwi remained under constant pressure throughout the session and are the clear G10 underperformers.
- AUDUSD (-1.22%) looks particularly susceptible to further greenback appreciation as it narrows the gap with the key support at 0.6993/91, the Dec 3 and Nov 2, 2020 lows. Moving average conditions remain in bear mode, highlighting the current sentiment.
- Elsewhere, losses against the US Dollar were broad, with JPY, GBP, CAD, CHF and CNH all under pressure. Interestingly, emerging market currency indices proved resilient, however, there may have been a disproportionate impact from a 2% recovery in the Russian Ruble with a slight easing of the high geopolitical tensions.
- The most notable data on Friday is US Core PCE Price Index, with UMich sentiment data also on the docket to round off a busy week.
FX: Expiries for Jan28 NY cut 1000ET (Source DTCC)
- EUR/USD: $1.1100(E734mln), $1.1130-50(E1.3bln), $1.1200-15(E1.4bln), $1.1300-20(E1.5bln)
- USD/JPY: Y114.00($672mln), Y114.50($645mln), Y115.00($1.3bln), Y115.50($1.5bln), Y115.90-00($1.7bln)
- EUR/JPY: Y126.25(E1.2bln), Y130.00(E1.2bln)
- USD/CAD: C$1.2695-00($709mln)
EQUITIES: Strength Through the Open Fades as Markets Finds New Near-Term Range
- Stocks opened strongly Thursday, capturing the overnight rally in index futures, but the bounce swiftly faded as cash markets returned lower. Growth/tech names remain the market leaders, with the NASDAQ the first to erase opening losses and dip into the red, with bluechip indices including the S&P 500 and DJIA shortly following.
- The consumer discretionary sector - and in particular carmakers - were a source of particular weakness, led by Tesla which dropped as much as 8% following a supply chain reshuffle.
- Across equity futures, the e-mini S&P was volatile inside the newly found range of 4200 - 4450, a channel that could define price action as traders find their feet following the Fed rate decision. The outlook for now remains bearish and a break of support at 4212.75 would resume the downtrend. Resistance to watch is 4446.25, Wednesday's high.
Commodities: Natural Gas Steals The Show
- The major mover today has been US natural gas, up as much as 72% for a record high since the contract launched in 1990, coming ahead of the Feb contract expiration in a possible short squeeze. It ended up 46% on the day at settlement after further wild swings.
- Crude oil prices meanwhile are ending the day lower on deteriorating risk sentiment that emerged following the US equity open, led by tech company woes.
- WTI is -1.2% at $86.30, again having earlier cleared resistance at $87.95 before retracing. Support is materially lower at $81.90.
- Brent is -0.9% at $89.15, having also cleared initial resistance at $90.47 and with support at $85.04.
- Gold meanwhile has seen another large drop of -1.4% to $1793.7, through second support at $1794.1, the channel base from the Aug 9 low, highlighting potential for a more significant reversal.
Data Roundup for Friday
| Date | GMT/Local | Impact | Flag | Country | Event |
| 28/01/2022 | 0630/0730 | ** |  | FR | Consumer Spending |
| 28/01/2022 | 0630/0730 | *** | | FR | GDP (p) |
| 28/01/2022 | 0700/0800 | ** |  | SE | Unemployment |
| 28/01/2022 | 0700/0800 | ** | | SE | Retail Sales |
| 28/01/2022 | 0700/0800 | *** | | SE | GDP |
| 28/01/2022 | 0700/0800 | * |  | NO | Norway Unemployment Rate |
| 28/01/2022 | 0700/0800 | ** |  | DE | Import/Export Prices |
| 28/01/2022 | 0745/0845 | ** | | FR | PPI |
| 28/01/2022 | 0800/0900 | *** |  | ES | GDP (p) |
| 28/01/2022 | 0900/1000 | ** |  | IT | ISTAT Consumer Confidence |
| 28/01/2022 | 0900/1000 | ** | | IT | ISTAT Business Confidence |
| 28/01/2022 | 0900/1000 | *** | | DE | GDP (p) |
| 28/01/2022 | 1000/1100 | ** |  | EU | Economic Sentiment Indicator |
| 28/01/2022 | 1000/1100 | * | | EU | Consumer Confidence, Industrial Sentiment |
| 28/01/2022 | 1000/1100 | * | | EU | Business Climate Indicator |
| 28/01/2022 | 1330/0830 | ** |  | US | Personal Income and Consumption |
| 28/01/2022 | 1330/0830 | ** | | US | Employment Cost Index |
| 28/01/2022 | 1500/1000 | *** | | US | Final Michigan Sentiment Index |
| 28/01/2022 | 1600/1100 |  | CA | Finance Dept monthly Fiscal Monitor (expected) |
Why MNI
MNI is the leading provider
of intelligence and analysis on the Global Fixed Income, Foreign Exchange and Energy markets. We use an innovative combination of real-time analysis, deep fundamental research and journalism to provide unique and actionable insights for traders and investors. Our "All signal, no noise" approach drives an intelligence service that is succinct and timely, which is highly regarded by our time constrained client base.Our Head Office is in London with offices in Chicago, Washington and Beijing, as well as an on the ground presence in other major financial centres across the world.
We are facing technical issues, please contact our team.
ok
Your request was sent sucessfully! Our team will contact you soon.
ok