
Why MNI
MNI is the leading provider
of intelligence and analysis on the Global Fixed Income, Foreign Exchange and Energy markets. We use an innovative combination of real-time analysis, deep fundamental research and journalism to provide unique and actionable insights for traders and investors. Our "All signal, no noise" approach drives an intelligence service that is succinct and timely, which is highly regarded by our time constrained client base.Our Head Office is in London with offices in Chicago, Washington and Beijing, as well as an on the ground presence in other major financial centres across the world.
US TSYS: Narrow/Weaker Range
Tsy futures hold weaker after the bell, maintaining narrow range since noon after see-sawing to new session lows (through overnight lows) late morning w/30YY tapping 3.2662% high, yield curves steeper/new highs (2s10s taps -29.564 high). Thin markets/whippy trade tied to lack of participants (London bank holiday) and limited data:
- US AUG. DALLAS FED MANUFACTURING INDEX AT -12.9 VS -22.6
- US AUG. DALLAS FED GENERAL BUSINESS ACTIVITY AT -12.9
- Tsys see-sawed on earlier ECB Lane comments:
- "Our upcoming September monetary policy meeting will be the start of a new phase... In terms of execution, this new phase will consist of a meeting-by-meeting (MBM) approach to setting interest rates... As policy rates move away from the lower bound, the inherent flexibility of the MBM approach is better suited to calibrating monetary policy in a highly uncertain environment."
- Rates rebounded on follow-up comment over smaller hikes "make it easier to correct course."
- Technicals for TYU2 at 117-00.5: outlook remains bearish and the contract has resumed its downtrend, breaching last week’s low of 117-03+ on Aug 24 / 25 low. This confirms a resumption of the current bear cycle and opens 116-11 next, the Jun 28 low. Further out, attention is on 116-02+, a Fibonacci retracement. Initial resistance has been defined at 117-29+, Friday’s high. The 50-day EMA, at 118-28+ marks a firmer resistance.
SHORT TERM RATES
US DOLLAR LIBOR: No new settlements Monday due to London bank holiday, resume Tuesday. In the meantime, below are Friday's settlements:
- O/N -0.01129 to 2.30914% (-0.01200/wk)
- 1M +0.03043 to 2.52386% (+0.09858/wk)
- 3M +0.02643 to 3.06957% (+0.11186/wk) * / **
- 6M +0.03957 to 3.56643% (+0.01886/wk)
- 12M +0.02600 to 4.12329% (+0.10473/wk)
- * Record Low 0.11413% on 9/12/21; ** New 14Y high: 3.06957% on 8/26/22
- Daily Effective Fed Funds Rate: 2.33% volume: $98B
- Daily Overnight Bank Funding Rate: 2.32% volume: $281B
- Secured Overnight Financing Rate (SOFR): 2.28%, $953B
- Broad General Collateral Rate (BGCR): 2.26%, $391B
- Tri-Party General Collateral Rate (TGCR): 2.26%, $385B
- (rate, volume levels reflect prior session)
FED Reverse Repo Operation
NY Federal Reserve/MNI
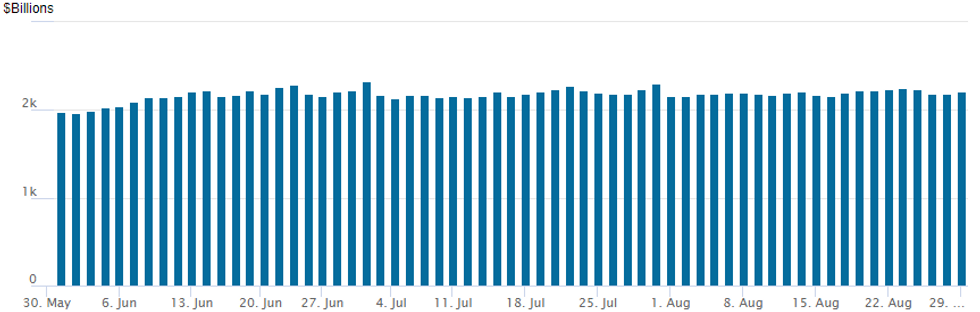
NY Fed reverse repo usages climbs to $2,205.188B w/ 99 counterparties vs. $2,182.452B prior session. Record high still stands at $2,329.743B from Thursday June 30.
EURODOLLAR/SOFR/TREASURY OPTIONS SUMMARY
Limited participation with London out for bank holiday really crimped trade volumes Monday. Replacement to Eurodollar options, SOFR options lead session volumes with mixed put structures and one call fly block fading the carry over short end selling in the short end.- SOFR Options:
- Block, 10,000 SFRZ2 97.00/97.25/97.50 call flys, 0.75 net
- +5,000 short Dec SOFR 96.12 puts 9.5 over SFRZ2 96.00 puts, both legs covered
- Block, -10,000 short Oct SOFR 96.25/96.75 2x1 put spds, 11.5 ref 96.51
- +2,500 SFRZ2 95.62/95.87/96.12 2x3x1 put flys, 0.5 ref 96.31
- 5,000 short Oct 96.25/96.75 2x1 put spds adds to Block
- 2,000 SFRZ3 96.50/97.00 put spds - adds to Block
- 3,000 SFRU2 96.87/96.93/97.00 call flys
- Block, 4,000 SFRZ3 96.50/97.00 put spds, 28.0 vs. 96.47/0.12%
- Block, 10,000 SFRZ2 97.00/97.25/97.50 call flys, 0.75 net
- Eurodollar Options:
- Block, 20,000 Dec 96.25/96.75 put spds, 44.0
- 2,300 Dec 95.25/95.50 put spds
- Treasury Options:
- +5,000 TYV 115/116 put spds, 17 ref 117-03
Late Equity Roundup: Strong Energy Sector Buoys Stocks Off Lows
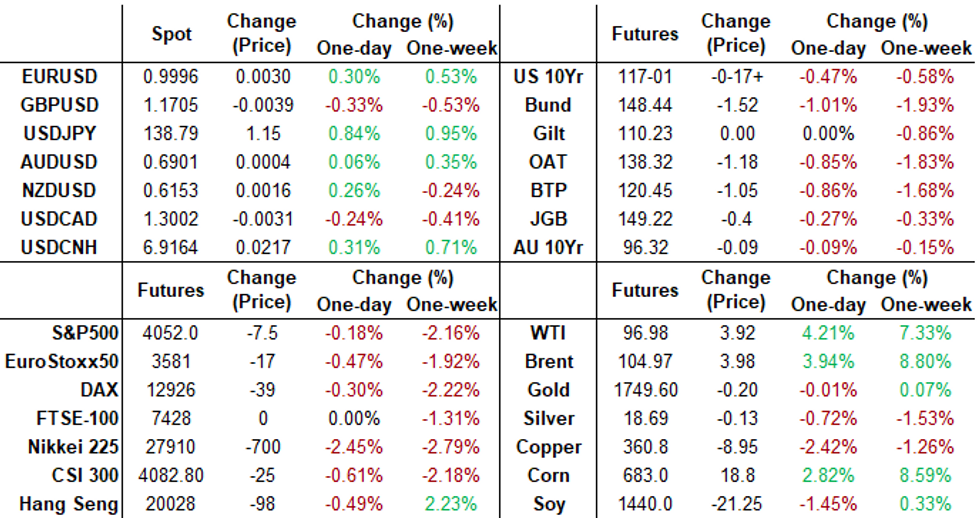
Still weaker after the FI close, stocks see-sawed off lows through the second half, Energy sector shares outperforming. Currently, SPX eminis trade -35 (-0.86%) at 4024.5; DJIA -230.03 (-0.71%) at 32055.45; Nasdaq -150.5 (-1.2%) at 11992.23.
- SPX leading/lagging sectors: Energy sector shares outperforming (2.33%) with crude stronger in late trade (WTI +3.89 at 96.95), followed by Utilities +0.65% and Consumer Staples (+0.18%). Laggers: Information Technology -1.40%, Health Care (-0.42%), and Financials (-0.38%).
- Dow Industrials Leaders/Laggers: United Health (UNH) +2.82 at 532.07, Chevron (CVX) +2.36 at 165.77, Walmart (WMT) +2.10 at 133.70. Laggers: Saleesforce.com (CRM) -3.24 at 161.99, 3M (MMM) -2.54 at 126.60, continued weakness for Microsoft (MSFT) -2.47 at 265.62, Apple (AAPL) -1.54 at 162.08, .
- Technicals for SPX Sep futures: S&P E-Minis stalled at Friday’s 4217.25 high. The impulsive sell-off reinforces bearish conditions and has resulted in a clear break of the 50-day EMA, at 4088.49. The breach of this pivot support strengthens the case for bears and signals scope for weakness towards 3983.25 next, a Fibonacci retracement. On the upside, initial firm resistance has been defined at 4217.25. A break would ease the current bearish pressure.
E-MINI S&P (U2): Breaches The 50-Day EMA
- RES 4: 4327.50 High Aug 16 and the bull trigger
- RES 3: 4288.00 High Aug 19
- RES 2: 4217.25 High AUg 26
- RES 1: 4110.75 Low Aug 24
- PRICE: 4025.50 @ 14:30 BST Aug 29
- SUP 1: 3983.25 50% retracement of the Jun 17 - Aug 16 upleg
- SUP 2: 3902.01 61.8% retracement of the Jun 17 - Aug 16 upleg
- SUP 3: 3834.00 Low Jul 19
- SUP 4: 3801.49 76.4% retracement of the Jun 17 - Aug 16 upleg
S&P E-Minis stalled at Friday’s 4217.25 high. The impulsive sell-off reinforces bearish conditions and has resulted in a clear break of the 50-day EMA, at 4088.49. The breach of this pivot support strengthens the case for bears and signals scope for weakness towards 3983.25 next, a Fibonacci retracement. On the upside, initial firm resistance has been defined at 4217.25. A break would ease the current bearish pressure.
Commodities
- WTI Crude Oil (front-month) up $3.84 (4.13%) at $96.91
- Gold is down $0.75 (-0.04%) at $1737.41
Tuesday Data Calendar
| Date | GMT/Local | Impact | Flag | Country | Event |
| 30/08/2022 | 0130/1130 | * |  | AU | Building Approvals |
| 30/08/2022 | 0700/0900 | ** |  | SE | Economic Tendency Indicator |
| 30/08/2022 | 0700/0900 |  | ES | Retail sales | |
| 30/08/2022 | 0700/0900 | *** | | ES | HICP (p) |
| 30/08/2022 | 0800/1000 | *** |  | DE | Bavaria CPI |
| 30/08/2022 | 0830/0930 | ** |  | UK | BOE M4 |
| 30/08/2022 | 0830/0930 | ** | | UK | BOE Lending to Individuals |
| 30/08/2022 | 0900/1100 | *** | | DE | Saxony CPI |
| 30/08/2022 | 0900/1100 | ** |  | EU | Economic Sentiment Indicator |
| 30/08/2022 | 0900/1100 | * | | EU | Consumer Confidence, Industrial Sentiment |
| 30/08/2022 | 0900/1100 | * | | EU | Business Climate Indicator |
| 30/08/2022 | 1200/1400 | *** | | DE | HICP (p) |
| 30/08/2022 | 1200/0800 |  | US | Richmond Fed's Tom Barkin | |
| 30/08/2022 | 1230/0830 | * |  | CA | Current account |
| 30/08/2022 | 1255/0855 | ** | | US | Redbook Retail Sales Index |
| 30/08/2022 | 1300/0900 | ** | | US | S&P Case-Shiller Home Price Index |
| 30/08/2022 | 1300/0900 | ** | | US | FHFA Home Price Index |
| 30/08/2022 | 1300/0900 | ** | | US | FHFA Quarterly Price Index |
| 30/08/2022 | 1400/1000 | *** | | US | Conference Board Consumer Confidence |
| 30/08/2022 | 1400/1000 | ** | | US | JOLTS jobs opening level |
| 30/08/2022 | 1400/1000 | ** | | US | JOLTS quits Rate |
| 30/08/2022 | 1500/1100 | | US | New York Fed's John Williams |
Why MNI
MNI is the leading provider
of intelligence and analysis on the Global Fixed Income, Foreign Exchange and Energy markets. We use an innovative combination of real-time analysis, deep fundamental research and journalism to provide unique and actionable insights for traders and investors. Our "All signal, no noise" approach drives an intelligence service that is succinct and timely, which is highly regarded by our time constrained client base.Our Head Office is in London with offices in Chicago, Washington and Beijing, as well as an on the ground presence in other major financial centres across the world.