
Why MNI
MNI is the leading provider
of intelligence and analysis on the Global Fixed Income, Foreign Exchange and Energy markets. We use an innovative combination of real-time analysis, deep fundamental research and journalism to provide unique and actionable insights for traders and investors. Our "All signal, no noise" approach drives an intelligence service that is succinct and timely, which is highly regarded by our time constrained client base.Our Head Office is in London with offices in Chicago, Washington and Beijing, as well as an on the ground presence in other major financial centres across the world.
HIGHLIGHTS
- MNI US: CNN-GOP's Zinke Mulling Run Against Dem In Vulnerable MT US Senate Seat
- MNI US-RUSSIA: Putin Signs Order Suspending New START Nuclear Treaty Participation
- MNI US-CHINA: Top US Diplomat: "Partners" Share Concerns Over Chinese Aid To Russia
- HUAWEI EXPORT LICENSES COULD BE REVOKED BY U.S. - WSJ
- GS SOLOMON: `IT'S A MORE CAUTIOUS TIME' FOR CHINA INVESTMENTS, Bbg
US TSYS: Bonds Near Highs Into Month End
Trading mixed after the bell, yield curves flatter after 30s extended highs on late month end buying. Note, 30s scaling off highs last couple minutes on late month end sales. Current 10YY at 3.9220% (+.0079) after tapping 3.9806% high in the first half (highest level since Nov 10 when rates surged on back of lower than expected Oct CPI: +0.4% MoM vs. 0.6% est, core +0.27% unrounded vs forecast of 0.5%, cooling rate hike expectations at the time).
- US FI mkts opened weaker following higher than expected inflation data for France and Spain overnight, see-sawed lows on spate mixed US data. Tsy futures ultimately rebounded off lows following drop in consumer confidence (102.9 vs. 106.0 prior) and weaker Chicago PMI (43.6 vs. 45.5 est.).
- Corporate debt and option-tied hedging added to early pressure, while markets remain skittish ahead month end rebalancing expected to draw selling in stocks vs. FI.
- STIR: Fed funds implied hike for Mar'23 at 29.4bp, May'23 cumulative 55.4bp to 5.133%, Jun'23 74.0bp to 5.318%, terminal at 5.415% in Aug-23-Oct'23.
SHORT TERM RATES
US DOLLAR LIBOR: Latest settlements:
- O/N -0.00314 to 4.55329% (-0.00842/wk)
- 1M +0.00743 to 4.66943% (+0.03457/wk)
- 3M +0.00857 to 4.97100% (+0.01757/wk)*/**
- 6M -0.00771 to 5.26343% (+0.02829/wk)
- 12M -0.00986 to 5.68157% (+0.04286/wk)
- * Record Low 0.11413% on 9/12/21; ** New 16Y high: 4.96243% on 2/27/23
- Daily Effective Fed Funds Rate: 4.58% volume: $108B
- Daily Overnight Bank Funding Rate: 4.57% volume: $297B
- Secured Overnight Financing Rate (SOFR): 4.55%, $1.145T
- Broad General Collateral Rate (BGCR): 4.51%, $473B
- Tri-Party General Collateral Rate (TGCR): 4.51%, $445B
- (rate, volume levels reflect prior session)
FED Reverse Repo Operation
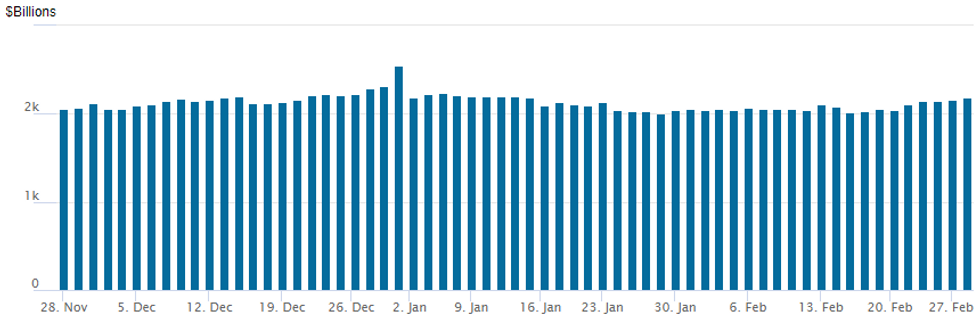
NY Federal Reserve/MNI
NY Fed reverse repo usage climbs to $2,188.035B w/ 107 counterparties vs. prior session's $2,162.435B. Compares to Friday, Dec 30 record/year-end high of $2,553.716B (prior record high was $2,425.910B on Friday, September 30.
EURODOLLAR/SOFR/TREASURY OPTIONS SUMMARY
Mixed option trade Tuesday as underlying reversed early weakness, flow consolidative, tending toward vol selling into month end.- SOFR Options:
- Over 53,000 OQJ3 95.00 puts, 7.0 ref 95.49, opener -- OI less than 13k coming into the session
- Block, -10,000 SFRZ3 94.25/95.25 strangles 21.0 over SFRU3 94.25/95.75 strangles
- Block, 5,000 SFRZ3 94.25/95.25 strangles, 32.0 ref 94.76
- Block, 6,000 2QH3 96.50 puts, 22.0 ref 96.325
- -20,000 SFRZ3 94.00/94.50 put spds, 14.25-14.0
- Block, 20,000 SFRU3 94.37/95.06/95.62 broken put flys, 8.5 ref 94.59 -.595
- Block, -20,000 SFRU3 94.00/94.25/94.31/94.62 put condors, 8.75 on splits ref 94.585
- +5,000 SFRZ3 94.25/94.50 put spds, 9.25
- -10,000 OQH3 95.12/95.37 call spds vs. 95.065, 6.5
- 7,500 SFRJ3 94.50 puts, ref 94.635
- 3,750 SFRU3 96.00 calls, 1.5 ref 94.575
- 6,000 OQH3 95.75 calls, cab
- 2,000 SFRM3 94.75/94.87/95.00 put flys ref 94362
- Treasury Options:
- 5,400 FVJ3 101.25 puts, .5 ref 107-00.75
- 7,500 TYJ3 110 puts, 25-26 ref 111-15.5 to -15, total over 22k from 23-28
- -10,000 TYJ3 110.5/111 put spds, 12
- -10,000 wk2 TY 110 puts, 9 vs. 111-20/0.08%
- over 11,500 wk/midcurve TY 110.75 puts, 3
- 10,000 wk/midcurve TY 112 calls, 5
- 6,000 TYJ3 110.5/111.5 put spds vs. TYJ3 113 calls, 3 net ref 111-17
- 2,000 FVJ3 105/106 put spds, ref 106-31.25
- 2,200 FVJ3 108.75 calls, 7.5 ref 107-01.25
EGBS: European Bonds Recovering Earlier Losses
- European government bonds have firmed through the afternoon and have pulled back from the low's of the day.
- Among the EGB majors, BTPs have recovered the most lost ground, with the 10-year yield falling over 10bp from the day's high.
- Further afield, gilts in the sub-10-year maturity have clawed back nearly all of the day's losses and are now homing in on yesterday's close. The very long-end meanwhile is now trading higher on the day with the 30-year yield down 2bp from yesterday's close.
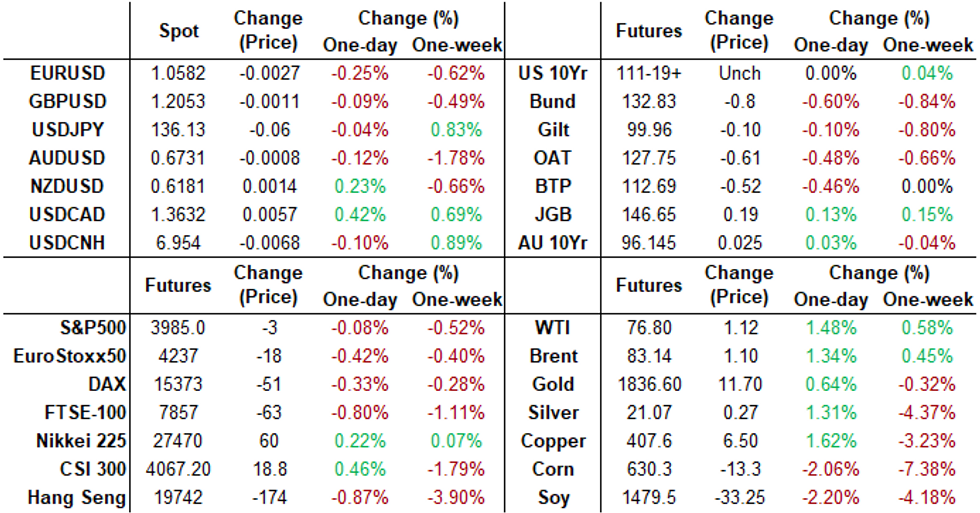
FOREX US Data & Month End Prompt Two-Way Greenback Price Action, JPY Recovers
- The USD index looks set to post a moderate advance on Tuesday as we approach the APAC crossover and are seeing a late downtick for risk sentiment. Weaker than expected US data initially exerted some greenback weakness, however this downward momentum was halted as we approached the WMR month-end fix which appeared to broadly reflect the month-end models that had flagged the bias for USD buying.
- Currency markets were perhaps better categorised by early JPY weakness, led by some strong advances for the likes of EURJPY and GBPJPY, and then a substantial JPY recovery following the data.
- In late US trade, USDJPY slipped below Monday’s lows to briefly print a low of 135.74, an impressive near 120 pip sell-off in just a few hours.
- The late turn in risk has also seen EURUSD slowly narrow the gap with overnight session's lows at 1.0582. The US data focus turns to ISM Manufacturing and Services PMIs later this week.
- USDCHF rose 0.5% on the session, negating the majority of Monday's move lower. This puts the pair back above the 0.94 mark and in close proximity to 3-month highs.
- On Wednesday, Australian GDP and monthly CPI data is scheduled. Data is likely to show inflation easing in January to 8.1% from a prior reading of 8.4% Y/y. Additionally, Chinese manufacturing and non-manufacturing PMIs will be released.
FX: Expiries for Mar01 NY cut 1000ET (Source DTCC)
- EUR/USD: $1.0425-35(E1.7bln), $1.0450(E793mln), $1.0495-10(E1.8bln), $1.0590-00(E1.2bln), $1.0690-05(E1.4bln), $1.0725(E913mln), $1.0850(E704mln)
- USD/JPY: Y134.85-00($1.2bln)
- EUR/GBP: Gbp0.8850(E1.2bln)
- AUD/USD: $0.6776-90(A$1.3bln)
- NZD/USD: $0.6165(N$640mln), $0.6250(N$1.2bln)
- USD/CAD: C$1.3580($500mln), C$1.3600-20($859mln)
- USD/CNY: Cny6.9000($637mln), Cny7.2500($2.0bln)
Late Equity Roundup: Month Lows Into Month-End
Stocks mostly weaker - just off last Friday's lows for February, indexes reversed modest session gains going into month end. SPX eminis currently trading -9 (-0.23%) at 3978.25; DJIA -240.17 (-0.73%) at 32645.14; Nasdaq +7.9 (0.1%) at 11473.69.
- SPX leading/lagging sectors: Utilities (-1.60%), Energy (-1.42%) and Health Care (-0.78%) underperformed, the former weighed by electric and multi-utility shares (CEG -4.41%, EVRG -2.39%, ETR -2.10%); pharmaceuticals weighing on the latter (MRK -2.44%, LLY -2.01%, OGN -1.49%).
- Leaders: Communication Services (+0.59%) supported by interactive media/entertainment (META +4.32%, LYV and Google both +0.75%); Materials (+0.42%) and Real Estate (+0.22%) the latter continued to be supported by industrial and specialized REITs.
- Dow Industrials Leaders/Laggers: JPM +1.35at 143.51, Boeing (BA) +.93 at 201.39, American Express (AXP) +0.87 at 174.20. Laggers: Goldman Sachs (GS) -12.17 at 353.36, United Health (UNH) -9.02 at 474.30, Merck (MRK) -2.78 at 106.62.
E-MINI S&P (H3): Resistance Remains Intact For Now
- RES 4: 4168.50 High Feb 16
- RES 3: 4096.00 High Feb 17
- RES 2: 4054.80 20-day EMA
- RES 1: 4025.09 50-day EMA
- PRICE: 3980.00 @ 1550ET Feb 28
- SUP 1: 3947.50 Low Feb 24
- SUP 2: 3901.75 Low Jan 19
- SUP 3: 3787.62 76.4% retracement of the Dec 22 - Feb 2 bull cycle
- SUP 4: 3819.00 Low Jan 6
S&P E-Minis trend conditions remain bearish and short-term signals suggest scope for an extension lower near-term. The contract continues to trade below the 50-day EMA, at 4025.09 and sights are set on 3901.75, the Jan 19 low and 3887.62, the 76.4% retracement of the Dec 22 - Feb 2 bull cycle. On the upside, resistance to watch is 4054.80, the 20-day EMA. Note that a clear break of the 50- and 20-day EMAs would signal a possible reversal.
COMMODITIES
- WTI Crude Oil (front-month) up $1.17 (1.55%) at $76.83
- Gold is up $10.4 (0.57%) at $1827.26
Wednesday Data Calendar
| Date | GMT/Local | Impact | Flag | Country | Event |
| 01/03/2023 | 0001/0001 | * |  | UK | BRC Monthly Shop Price Index |
| 01/03/2023 | 0030/1130 | *** |  | AU | Quarterly GDP |
| 01/03/2023 | 0030/0930 | ** |  | JP | IHS Markit Final Japan Manufacturing PMI |
| 01/03/2023 | 0130/0930 | *** |  | CN | CFLP Manufacturing PMI |
| 01/03/2023 | 0130/0930 | ** | | CN | CFLP Non-Manufacturing PMI |
| 01/03/2023 | 0145/0945 | ** | | CN | IHS Markit Final China Manufacturing PMI |
| 01/03/2023 | 0630/0730 | *** |  | DE | North Rhine Westphalia CPI |
| 01/03/2023 | 0700/0800 | ** |  | NO | Norway GDP |
| 01/03/2023 | 0815/0915 | ** |  | ES | IHS Markit Manufacturing PMI (f) |
| 01/03/2023 | 0845/0945 | ** |  | IT | S&P Global Manufacturing PMI (f) |
| 01/03/2023 | 0850/0950 | ** |  | FR | IHS Markit Manufacturing PMI (f) |
| 01/03/2023 | 0855/0955 | ** | | DE | Unemployment |
| 01/03/2023 | 0855/0955 | ** | | DE | IHS Markit Manufacturing PMI (f) |
| 01/03/2023 | 0900/1000 | ** |  | EU | IHS Markit Manufacturing PMI (f) |
| 01/03/2023 | 0900/1000 | *** | | DE | Bavaria CPI |
| 01/03/2023 | 0930/0930 | ** | | UK | S&P Global Manufacturing PMI (Final) |
| 01/03/2023 | 0930/0930 | ** | | UK | BOE M4 |
| 01/03/2023 | 0930/0930 | ** | | UK | BOE Lending to Individuals |
| 01/03/2023 | 1000/1000 | ** | | UK | Gilt Outright Auction Result |
| 01/03/2023 | 1000/1000 | | UK | BOE Bailey Speech at Cost of Living Crisis Conference | |
| 01/03/2023 | 1000/1100 | *** | | DE | Saxony CPI |
| 01/03/2023 | 1200/0700 | ** |  | US | MBA Weekly Applications Index |
| 01/03/2023 | 1300/1400 | *** | | DE | HICP (p) |
| 01/03/2023 | 1400/0900 | | US | Minneapolis Fed's Neel Kashkari | |
| 01/03/2023 | 1445/0945 | *** | | US | IHS Markit Manufacturing Index (final) |
| 01/03/2023 | 1500/1000 | *** | | US | ISM Manufacturing Index |
| 01/03/2023 | 1500/1000 | * | | US | Construction Spending |
| 01/03/2023 | - | *** | | US | Domestic-Made Vehicle Sales |
| 01/03/2023 | 1530/1030 | ** | | US | DOE Weekly Crude Oil Stocks |
Why MNI
MNI is the leading provider
of intelligence and analysis on the Global Fixed Income, Foreign Exchange and Energy markets. We use an innovative combination of real-time analysis, deep fundamental research and journalism to provide unique and actionable insights for traders and investors. Our "All signal, no noise" approach drives an intelligence service that is succinct and timely, which is highly regarded by our time constrained client base.Our Head Office is in London with offices in Chicago, Washington and Beijing, as well as an on the ground presence in other major financial centres across the world.