
Why MNI
MNI is the leading provider
of intelligence and analysis on the Global Fixed Income, Foreign Exchange and Energy markets. We use an innovative combination of real-time analysis, deep fundamental research and journalism to provide unique and actionable insights for traders and investors. Our "All signal, no noise" approach drives an intelligence service that is succinct and timely, which is highly regarded by our time constrained client base.Our Head Office is in London with offices in Chicago, Washington and Beijing, as well as an on the ground presence in other major financial centres across the world.
Equities Extend Slide, Fuelling Fearsome USD Rally
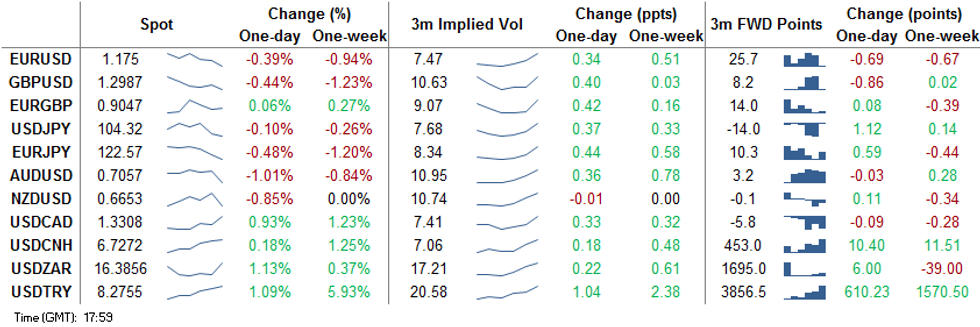
Markets sought havens throughout the Wednesday session as equities slipped further. European equities shed a further 3% or so. with US stocks following suit. With stocks falling sharply, JPY and USD rose against all others in G10, boosting the USD index to the best levels in two weeks and back above the 50-dma.
GBP saw a little reprieve ahead of the London close as Bloomberg reported that a Brexit deal could be in the offing in early November as good progress has been made between negotiating teams this week.
Commodity markets were similarly roiled by the threat of further lockdowns across continental Europe, leading WTI and Brent crude futures to shed over 5% and anchor the likes of NOK & CAD.
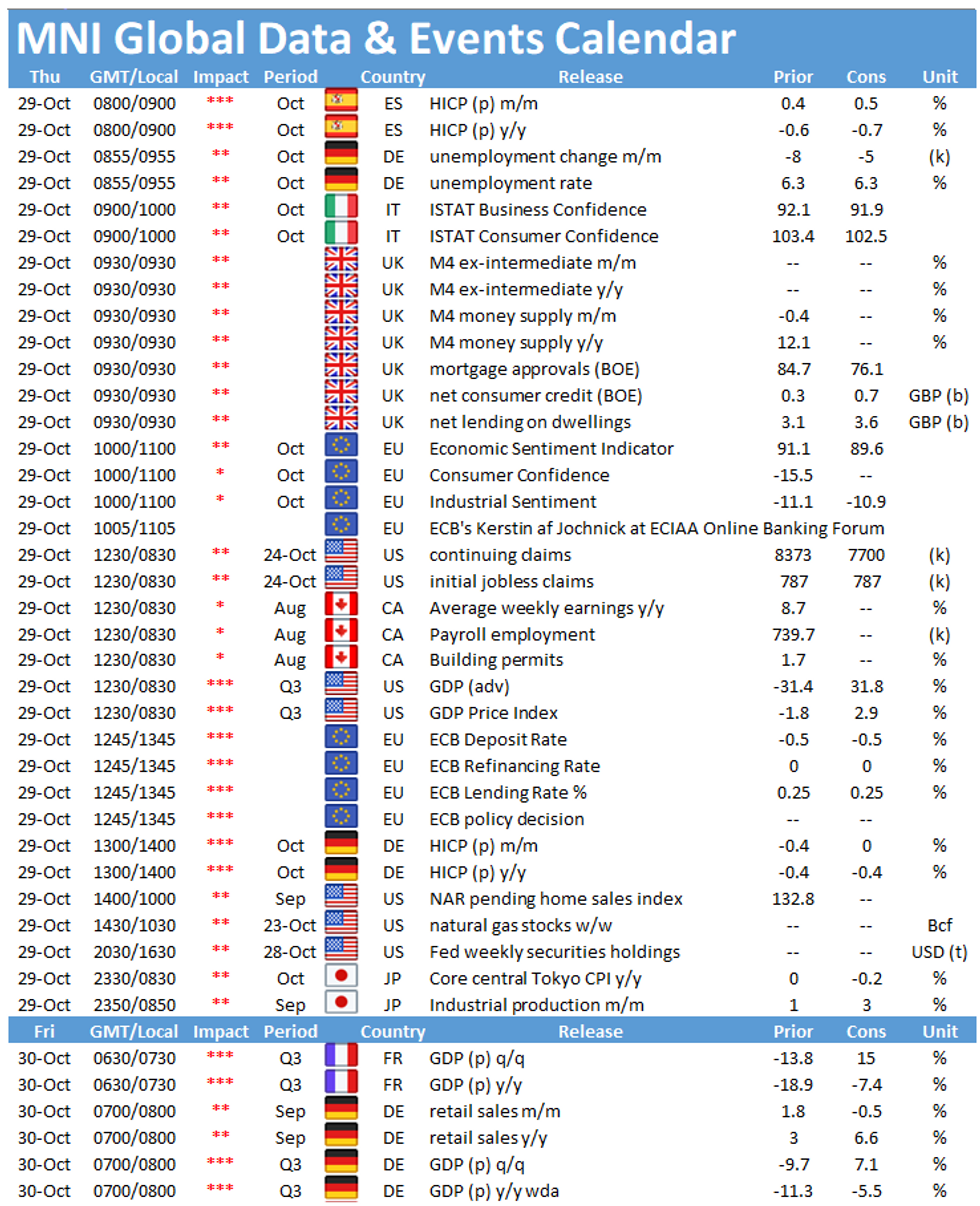
Thursday brings weekly US jobless claims and advance Q3 GDP, regional German CPIs and pending home sales. Rate decisions from the ECB and BoJ are due. Neither bank are expected to make any material change to policy, although pressure is clearly ratcheting higher on both bank's committees as their inflation outlooks continue to deteriorate.
EUR/USD TECHS: Key Trendline Support Snaps
- RES 4: 1.1909 1.0% 10-dma envelope
- RES 3: 1.1881 High Oct 21 and the bull trigger
- RES 2: 1.1839 High Oct 27
- RES 1: 1.1798 Intraday high
- PRICE: 1.1758 @ 16:32 GMT Oct 28
- SUP 1: 1.1718 Low Oct 28
- SUP 2: 1.1689 Low Oct 15 and a key support
- SUP 3: 1.1612 Low Sep 25 and the bear trigger
- SUP 4: 1.1541 Low Jul 23
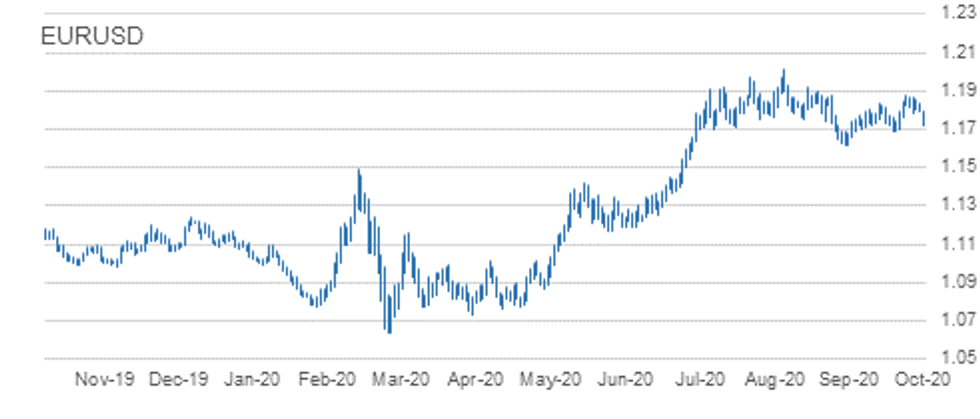
EURUSD traded under pressure for much of the European trading day but managed to stage a modest rally into the US close. Key near-term trendline support drawn off the Sep 28 low gave way, keeping the outlook fragile for now. This break of support undermines the bullish tone and exposes 1.1689, Oct 15 low. Initial resistance is at 1.1798, Wednesday's intraday high.
GBP/USD TECHS: One Week Low
- RES 4: 1.3267 2.0% 10-dma envelope
- RES 3: 1.3257 Former trendline support drawn off the Mar 20 low
- RES 2: 1.3177 High Oct 21 and the bull trigger
- RES 1: 1.3080 High Oct 27
- PRICE: 1.2977 @ 16:56 GMT Oct 28
- SUP 1: 1.2917 Low Oct 28
- SUP 2: 1.2863 Low Oct 14 and key near-term support
- SUP 3: 1.2806 Low Sep 30
- SUP 4: 1.2794 76.4% retracement of the Sep 23 - Oct 21 rally
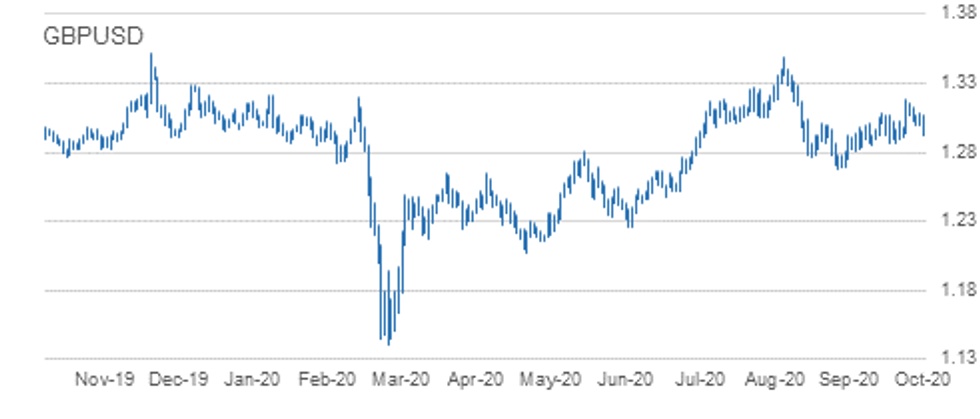
GBP/USD traded lower Wednesday breaking through Monday's 1.2993 low as well as 1.2940 Oct 21 low. The break suggests scope for a deeper corrective pullback and strengthens the bearish case further to expose 1.2863, Oct 14 low and a key support. Price action has defined initial resistance at 1.3080, Oct 27 high. A move back above this resistance would ease bearish pressure and open 1.3177, Oct 21 high.
EUR/GBP TECHS: All Eyes On Key Support
- RES 4: 0.9220 High Sep 22
- RES 3: 0.9160/62 1.0% 10-dma envelope / High Oct 7
- RES 2: 0.9149 Oct 20 high
- RES 1: 0.9107 High Oct 23
- PRICE: 0.9049 @ 17:04 GMT Oct 28
- SUP 1: 0.9012 Low Oct 21
- SUP 2: 0.9007 Low Oct 14 and the bear trigger
- SUP 3: 0.8967 76.4% retracement of the Sep 3 - 11 rally
- SUP 4: 0.8925 Low Sep 7
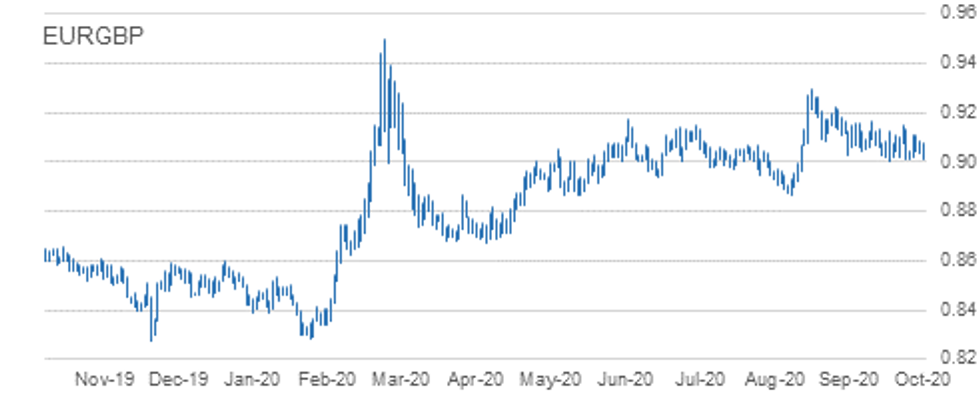
EURGBP maintains a choppy tone. The outlook remains bearish though following the sharp sell-off on Oct 21. Attention is on support at 0.9007, Oct 14 low and the near-term bear trigger. A break of 0.9007 would confirm a resumption of the downtrend that started Sep 11 and expose 0.8967, a retracement point. Key S/T resistance has been defined at 0.9149, Oct 20 high. Clearance of this level would undermine bearish conditions.
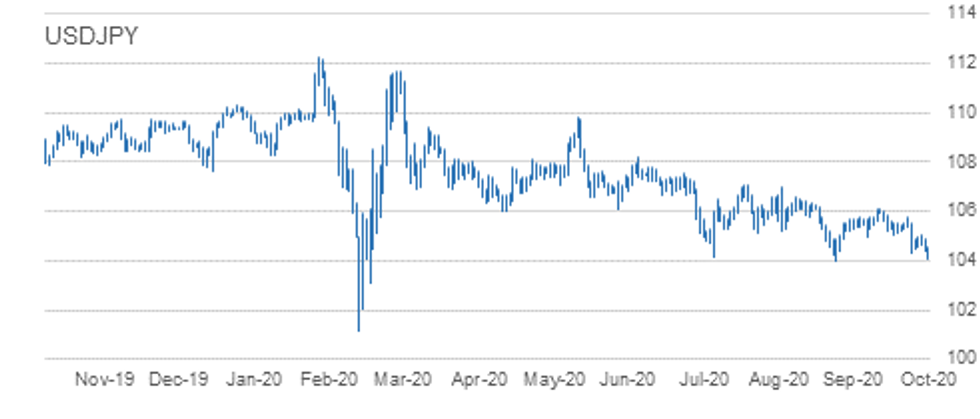
USD/JPY TECHS: Approaching Key Support
- RES 4: 105.75 High Oct 20
- RES 3: 105.53/60 High Oct 21 / 50-dma
- RES 2: 105.06 High Oct 26 and key near-term resistance
- RES 1: 104.56 Intraday high
- PRICE: 104.29 @ 17:06 GMT Oct 28
- SUP 1: 104.00 Low Sep 21 and the bear trigger
- SUP 2: 103.67 76.4% retracement of the Mar 9 - 24 rally
- SUP 3: 103.09 Low Mar 12
- SUP 4: 102.02 Low Mar 10
USDJPY maintains a softer tone, extending the recent decline. The outlook is bearish following the Oct 21 sell-off that marked a resumption of the downleg from 106.11, Oct 7 high. A number of important supports have been cleared and attention is on the key 104.00 handle, Sep 21 low. A break of 104.00 would suggest scope for a deeper USD depreciation within the bear channel drawn off the Mar 24 high. Firm resistance is at 105.06.
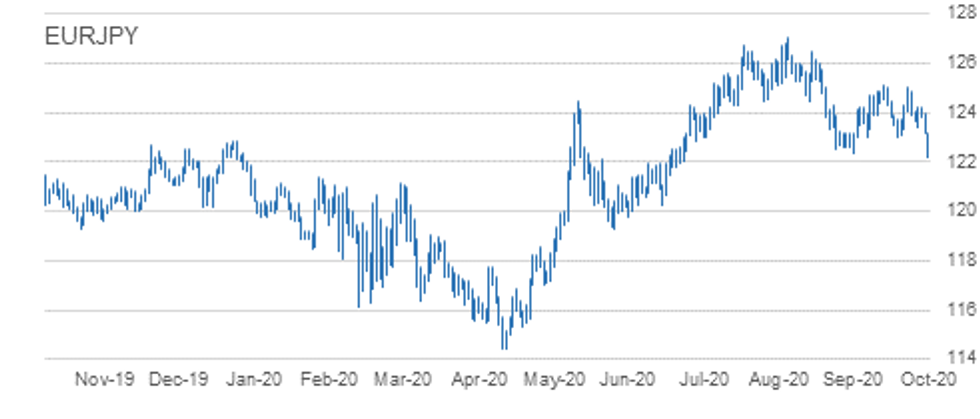
EUR/JPY TECHS: Breaks Key Support, Hitting Bear Trigger
- RES 4: 125.00/09 High Oct 20 and Oct 9
- RES 3: 124.23 High Oct 23 and 26
- RES 2: 123.98 20-day EMA
- RES 1: 123.19 High Oct 28
- PRICE: 122.51 @ 17:15 GMT Oct 28
- SUP 1: 122.19 Low Sep 28 / 61.8% of the Jun 22 - Sep 1 rally
- SUP 2: 122.25 38.2% retracement of the May - Sep rally
- SUP 3: 121.82 Low Jul 15 / 16
- SUP 4: 121.50 0.764 proj of Sep 1 - 28 decline from Oct 9 high
EURJPY cleared support at 123.03/02 as well as 122.25 Wednesday, undermining the recent bullish outlook and signals scope for a deeper sell-off towards 121.82 - levels not seen since July. The recent failure at 125.09 and 125.00, Oct 9 and 20 highs respectively, weigh on the pair. Initial resistance is at 123.19, the Wednesday high.
AUD/USD TECHS: Stalls At Trendline Resistance

- RES 4: 0.7324 High Sep 21
- RES 3: 0.7258 61.8% retracement of the Sep 1 - 25 decline
- RES 2: 0.7243 High Oct 10 and a key resistance
- RES 1: 0.7157/58 Trendline drawn off the Sep 1 high / High Oct 23
- PRICE: 0.7056 @ 17:19 GMT Oct 28
- SUP 1: 0.7038 Low Oct 28
- SUP 2: 0.7021 Low Oct 20
- SUP 3: 0.7006 Low Sep 25 and the bear trigger
- SUP 4: 0.6965 23.6% retracement of the Mar - Sep rally
AUDUSD outlook is bearish. The Aussie continues to trade below trendline resistance drawn off the Sep 1 high. The line intersects at 0.7157 and represents a key resistance. It was tested Wednesday and has remained intact, capping gains. While the trendline holds, a bearish theme remains intact with attention on key support and bear trigger at 0.7006, Sep 25 low. A trendline break would signal a reversal and open 0.7243, Oct 10 high.
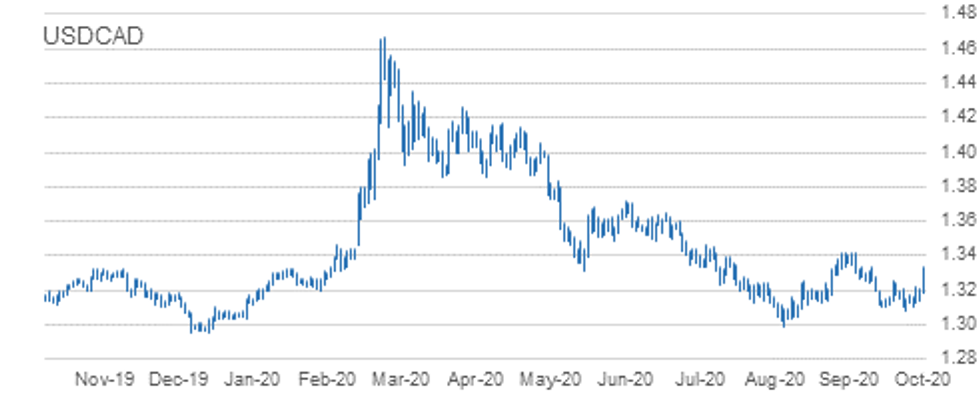
USD/CAD TECHS: Rolling Through Resistance
- RES 4: 1.3449 2.0% 10-dma envelope
- RES 3: 1.3421 High Sep 30 and primary resistance
- RES 2: 1.3341 High Oct 7
- RES 1: 1.3334 High Oct 28
- PRICE: 1.3313 @ 17:27 GMT Oct 28
- SUP 1: 1.3180 Intraday low
- SUP 2: 1.3109/3081 Low Oct 23 / Low Oct 21 and the bear trigger
- SUP 3: 1.3047 Low Sep 7
- SUP 4: 1.3038 Low Sep 2
USDCAD started the week on a firm note and that's extended well into the Wednesday session. This continues to run against the previously bearish outlook and opens a further recovery toward primary resistance at 1.3421. Scope remains for weakness towards the major support at 1.2994, Sep 1 low, but that's looking increasingly unlikely following the recent rally.
EUR/USD: MNI KEY LEVELS
- *$1.1909 Upper 1.0% 10-dma envelope
- *$1.1870 Upper Bollinger Band (2%)
- *$1.1851/56 Jun14-2018 high/100-mma
- *$1.1828 Cloud top
- *$1.1815 Sep24-2018 high
- *$1.1807/11 200-hma/100-hma
- *$1.1798/99 Intraday high/55-dma
- *$1.1792 50-dma
- *$1.1775 21-dma
- *$1.1757 Sep27-2018 high
- *$1.1749 ***CURRENT MARKET PRICE 18:03GMT WEDNESDAY***
- *$1.1736 Fibo 38.2% 1.3993-1.0341
- *$1.1718 Intraday low
- *$1.1685 Lower Bollinger Band (2%)
- *$1.1673 Lower 1.0% 10-dma envelope
- *$1.1655/51 Cloud base/Sep28-2018 high
- *$1.1647 100-dma
- *$1.1638 Lower Bollinger Band (3%)
- *$1.1621 Oct16-2018 high
- *$1.1615/13 Down Trendline from Jul18-2008/161.8% swing $1.1497-1.1309
- *$1.1570 Jan10-2019 high
GBP/USD: MNI KEY LEVELS
- *$1.3126/31 Upper Boll Band (2%)/May07-2019 high
- *$1.3109 Fibo 50% 1.1841-1.4377
- *$1.3080 May08-2019 high
- *$1.3064 Intraday high
- *$1.3036/41 100-hma/May13-2019 high
- *$1.3023 200-hma
- *$1.3016 55-dma
- *$1.3006 50-dma
- *$1.2999 Fibo 61.8% 1.3381-1.2382
- *$1.2991 May10-2019 low
- *$1.2988 ***CURRENT MARKET PRICE 18:03GMT WEDNESDAY***
- *$1.2985/81 Cloud top/Cloud base
- *$1.2979 21-dma
- *$1.2951/47 50-mma/200-wma
- *$1.2917 Intraday low
- *$1.2904 May14-2019 low
- *$1.2882 Fibo 50% 1.3381-1.2382
- *$1.2875 Lower 1.0% 10-dma envelope
- *$1.2868 100-dma
- *$1.2852 May16-2019 high
- *$1.2838/33 Lower Boll Band (2%)/Feb12-2019 low
EUR/GBP: MNI KEY LEVELS
- *Gbp0.9203 Sep08-2017 high
- *Gbp0.9165 Upper Bollinger Band (3%)
- *Gbp0.9158 Upper 1.0% 10-dma envelope
- *Gbp0.9131/34 Cloud top/Upper Boll Band (2%), Sep11-2017 high
- *Gbp0.9108 Jan03-2019 high
- *Gbp0.9079 Cloud base
- *Gbp0.9072/76 21-dma/Intraday high
- *Gbp0.9066/67 200-hma/50-dma
- *Gbp0.9060/62/65 100-hma/Jan11-2019 high/55-dma
- *Gbp0.9048/51 Jul16-2019 high/Jul17-2019 high, 100-dma
- *Gbp0.9046 ***CURRENT MARKET PRICE 18:03GMT WEDNESDAY***
- *Gbp0.9039 Jul18-2019 high
- *Gbp0.9015/11/10 Intraday low/Lower Boll Band (2%)/Jul10-2019 high
- *Gbp0.9005/00 Jul23-2019 high/Jul22-2019 high
- *Gbp0.8980/77 Lower Boll Band (3%)/Lower 1.0% 10-dma env
- *Gbp0.8953 Jul23-2019 low
- *Gbp0.8921 Jul02-2019 low
- *Gbp0.8899 200-dma
- *Gbp0.8886 Lower 2.0% 10-dma envelope
- *Gbp0.8874/73/72 Jun19-2019 low/Jun20-2019 low/Jun12-2019 low
- *Gbp0.8865 Fibo 61.8% 0.9108-0.8473
USD/JPY: MNI KEY LEVELS
- *Y105.59 55-dma
- *Y105.53 50-dma
- *Y105.31 Cloud base
- *Y105.28 21-dma
- *Y105.11 Cloud Kijun Sen
- *Y104.93 Cloud Tenkan Sen
- *Y104.92 200-hma
- *Y104.87 Jan03-2019 low
- *Y104.66 100-hma
- *Y104.56 Intraday high, Mar26-2018 low
- *Y104.30 ***CURRENT MARKET PRICE 18:03GMT WEDNESDAY***
- *Y104.28 Lower Bollinger Band (2%)
- *Y104.11 Intraday low
- *Y104.00 YTD low
- *Y103.94 200-mma
- *Y103.90 Lower 1.0% 10-dma envelope
- *Y103.79 Lower Bollinger Band (3%)
- *Y102.85 Lower 2.0% 10-dma envelope
- *Y101.80 Lower 3.0% 10-dma envelope
- *Y101.20 Nov09-2016 low
- *Y100.75 Sep30-2016 low
EUR/JPY: MNI KEY LEVELS
- *Y123.56 100-dma
- *Y123.54 Fibo 50% 109.57-137.50
- *Y123.51 May22-2019 high
- *Y123.19 Intraday high
- *Y123.18 Jun11-2019 high
- *Y123.11 Fibo 50% 118.71-127.50
- *Y123.08 Fibo 38.2% 126.81-120.78
- *Y123.01 Jun12-2019 high
- *Y122.77 Lower Bollinger Band (2%)
- *Y122.56 Jun13-2019 high
- *Y122.55 ***CURRENT MARKET PRICE 18:03GMT WEDNESDAY***
- *Y122.51 Lower 1.0% 10-dma envelope
- *Y122.23 Jul12-2019 high
- *Y122.19 Intraday low
- *Y122.17 Lower Bollinger Band (3%)
- *Y122.13 Jun17-2019 high
- *Y122.07 Fibo 61.8% 118.71-127.50
- *Y121.95 Fibo 50% 94.12-149.78
- *Y121.92 Jun20-2019 high
- *Y121.85 Jul15-2019 high, 100-wma
- *Y121.42 Jul15-2019 low
AUD/USD: MNI KEY LEVELS
- *$0.7192 50-dma, 55-dma
- *$0.7168/69 Cloud base/Upper 1.0% 10-dma env
- *$0.7153/57 Apr17-2019 low/Intraday high
- *$0.7136 21-dma
- *$0.7116/21 Apr12-2019 low/100-hma
- *$0.7110 100-dma, Apr10-2019 low
- *$0.7102 200-hma
- *$0.7088 Apr08-2019 low
- *$0.7069/73 Apr30-2019 high/Mar29-2019 low
- *$0.7057 Jul22-2019 high
- *$0.7056 ***CURRENT MARKET PRICE 18:03GMT WEDNESDAY***
- *$0.7053 Apr02-2019 low
- *$0.7048/44 Jul04-2019 high, May07-2019 high/Jul16-2019 high
- *$0.7038/34 Intraday low/Lower Boll Band (2%)
- *$0.7027 Lower 1.0% 10-dma envelope
- *$0.6985/83 Jan03-2019 low/Lower Boll Band (3%)
- *$0.6971/67 Jul12-2019 low/Jun11-2019 high
- *$0.6956 Lower 2.0% 10-dma envelope
- *$0.6909 Jun19-2019 high
- *$0.6895 100-wma
- *$0.6885 Lower 3.0% 10-dma envelope
USD/CAD: MNI KEY LEVELS
- *C$1.3449/52 Upper 2.0% 10-dma env/Jun04-2019 high
- *C$1.3431 Jun06-2019 high
- *C$1.3407 Upper Boll Band (3%), 61.8% 1.3565-1.3151
- *C$1.3383 Jun19-2019 high
- *C$1.3376/77 50% 1.4690-1.2062/100-wma
- *C$1.3358 Fibo 50% 1.3565-1.3151
- *C$1.3345 Jun12-2019 high
- *C$1.3334/36/38 Intraday high/100-dma/Upper Boll Band (2%)
- *C$1.3328 Fibo 38.2% 1.2783-1.3665
- *C$1.3317/20 Upper 1.0% 10-dma env/Cloud top
- *C$1.3314 ***CURRENT MARKET PRICE 18:03GMT WEDNESDAY***
- *C$1.3309 Fibo 38.2% 1.3565-1.3151
- *C$1.3300 Jun13-2019 low
- *C$1.3286 Jun20-2019 high
- *C$1.3226/24 Jun10-2019 low/50% 1.2783-1.3665
- *C$1.3205/02/01 21-dma/55-dma/Cloud base, 50-dma
- *C$1.3181/80/78 100-hma/Intraday low/50-mma
- *C$1.3168/64/63 200-hma/Jul23-2019 high/Feb21-2019 low
- *C$1.3160 200-wma
- *C$1.3151/50 Jun20-2019 low/Feb20-2019 low
- *C$1.3120/16 61.8% 1.2783-1.3665/Jul23-2019 low
Expiries for Oct29 NY cut 1000ET (Source DTCC)
EUR/USD: $1.1700-20(E2.0bln), $1.1745-55(E1.4bln), $1.1765-70(E746mln)
USD/JPY: Y103.20-25($1.6bln-USD puts), Y103.60($930mln), Y104.00($1.7bln-USD puts), Y105.25($1.3bln), Y105.55-65($2.4bln), Y106.00($1.2bln)
EUR/GBP: Gbp0.9050(E920mln), Gbp0.9110(E697mln)
AUD/JPY: Y73.20(A$1.0bln-AUD puts), Y76.35-40(A$2.4bln-AUD calls)
USD/CAD: C$1.3160-75($1.0bln)
Larger Option Pipeline
EUR/USD: Oct30 $1.1750-54(E1.4bln), $1.1800(E2.2bln), $1.1850(E1.6bln), $1.1950(E1.7bln-EUR calls), $1.2000(E1.3bln); Nov03 $1.1900-05(E1.4bln)
USD/JPY: Oct30 Y104.00($1.2bln), Y104.50($2.4bln), Y104.80-85($1.4bln), Y104.95-105.00($1.1bln), Y106.00-05($2.2bln); Nov03 Y105.45-49($1.3bln); Nov04 Y105.00($1.1bln); Nov05 Y106.06-09($1.6bln)
EUR/JPY: Nov05 Y124.50(E1.1bln)
GBP/USD: Nov02 $1.3100(Gbp1.1bln), $1.3150(Gbp911mln)
EUR/GBP: Nov02 Gbp0.8900(E2.1bln-EUR puts), Gbp0.9000(E1.4bln)
AUD/USD: Oct30 $0.7180-00(A$1.4bln); Nov02 $0.7140-45(A$1.8bln)
AUD/JPY: Oct30 Y77.45(A$1.2bln)
AUD/NZD: Oct30 N$1.0750(A$1.2bln)
USD/CAD: Oct30 C$1.3025($1.1bln), C$1.3150($1.3bln)
USD/CNY: Nov03 Cny6.5334($1.2bln); Nov05 Cny6.75($1.0bln), Cny6.80($1.9bln), Cny6.85($1.3bln)
Why MNI
MNI is the leading provider
of intelligence and analysis on the Global Fixed Income, Foreign Exchange and Energy markets. We use an innovative combination of real-time analysis, deep fundamental research and journalism to provide unique and actionable insights for traders and investors. Our "All signal, no noise" approach drives an intelligence service that is succinct and timely, which is highly regarded by our time constrained client base.Our Head Office is in London with offices in Chicago, Washington and Beijing, as well as an on the ground presence in other major financial centres across the world.