
Why MNI
MNI is the leading provider
of intelligence and analysis on the Global Fixed Income, Foreign Exchange and Energy markets. We use an innovative combination of real-time analysis, deep fundamental research and journalism to provide unique and actionable insights for traders and investors. Our "All signal, no noise" approach drives an intelligence service that is succinct and timely, which is highly regarded by our time constrained client base.Our Head Office is in London with offices in Chicago, Washington and Beijing, as well as an on the ground presence in other major financial centres across the world.
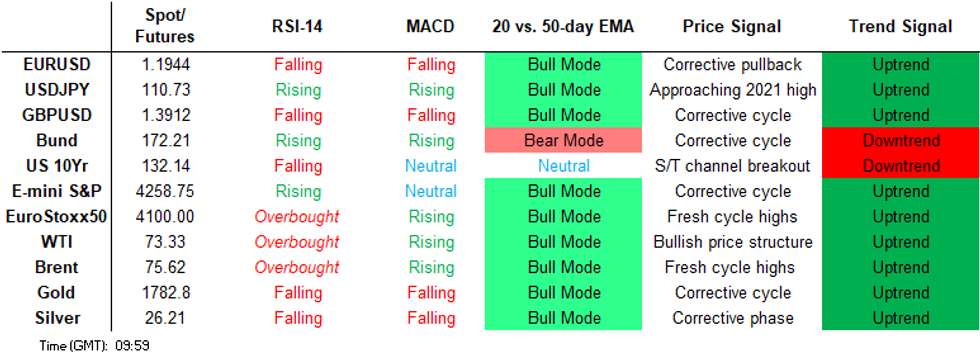
Price Signal Summary - S&P E-Minis Fresh All-Time Highs
- In the equity space, S&P E-minis have traded to fresh all-time highs once again. The contract this week tested the 50-day EMA at 4145.50 and the average provided support, reinforcing bullish conditions. Attention turns to 4300.00.
- In FX, the EURUSD outlook is unchanged and remains bearish following last week's sharp sell-off. The focus is on 1.1837 next, 76.4% of the Mar 31 - May 25 rally. GBPUSD remains vulnerable following last week's bearish pressure and recent gains are considered corrective. Attention is on 1.3717 next, Apr 16 low. USDJPY traded higher Wednesday and delivered fresh 2021 highs, with a print above Y110.97, Mar 31 high and the previous bull trigger. This cements the uptrend and maintains a bullish price sequence of higher highs and higher lows. Attention is on 111.30/32, the Mar 26, 2020 high and 1.0% 10-dma envelope.
- On the commodity front, Gold is consolidating. The outlook remains weak and the current consolidation appears to be a bear flag. This reinforces a bear theme and the focus is on $1756.2, low Apr 29. The Oil market remains firm and continues to trend higher. Brent (Q1) focus is $76.97, 1.23 projection of Mar 23 - May 18 - May 21 price swing. WTI (Q1) sights are set on $75.01, 1.382 projection of Mar 23 - May 18 - May 21 price swing.
- Within FI, Bund futures have this week probed support at 171.80, Jun 17 low. A stronger sell-off would expose 171.37, Jun 3 low and 170.99, Mar 31 low and a key short-term support. Key support to watch in {GB} Gilt futures is unchanged at 126.70, Jun 3 low.
FOREIGN EXCHANGE
EURUSD TECHS: Bearish Focus
- RES 4: 1.2218 High Jun 9
- RES 3: 1.2147 High Jun 15
- RES 2: 1.2040 20-day EMA
- RES 1: 1.2006 High Jun 17
- PRICE: 1.1939 @ 05:48 BST Jun 25
- SUP 1: 1.1848 Low Jun 18 and 21 and the bear trigger
- SUP 2: 1.1837 76.4% retracement of the Mar 31 - May 25 rally
- SUP 3: 1.1795 Low Apr 6
- SUP 4: 1.1738 Low Apr 5
Despite this week's bounce, the EURUSD outlook remains bearish following the recent sharp move lower. The 50-day EMA and 1.2104, Jun 4 low have been cleared, highlighting a bearish theme and this has confirmed a bearish price sequence of lower lows and lower highs. The focus is on 1.1837, a Fibonacci retracement where a break would open 1.1704, Mar 31 low and a key support. On the upside, initial firm resistance is 1.2006, the Jun 17 high.
GBPUSD TECHS: Recent Gains Considered Corrective
- RES 4: 1.4203/48 High Jun 3 / High Jun 1 and the bull trigger
- RES 3: 1.4133 High Jun 16
- RES 2: 1.4013 50-day EMA
- RES 1: 1.4001 High Jun 23
- PRICE: 1.3925 @ 05:52 BST Jun 25
- SUP 1: 1.3787 Low Jun 21
- SUP 2: 1.3717 Low Apr 16
- SUP 3: 1.3669 Low Apr 12 and a key support
- SUP 4: 1.3567 Low Apr 2
GBPUSD remains vulnerable despite recent gains. This follows recent weakness that resulted in the break of short-term support levels - price cleared the 50-day EMA and 1.4006, May 13 low. The pair has also traded through the 100-DMA, reinforcing current bearish conditions. Scope is seen for an extension lower towards 1.3717, Apr 14 low. On the upside, initial firm resistance is seen at 1.4013, the 50-day EMA. The bear trigger is 1.3787.
EURGBP TECHS: Fibonacci Retracement Remains Exposed
- RES 4: 0.8731 High Feb 26
- RES 3: 0.8701/21 High May 7 / High Apr 26 and the bull trigger
- RES 2: 0.8646/72 High Jun 1 / High May 25
- RES 1: 0.8602/29 High Jun 21 / High Jun 15
- PRICE: 0.8574 @ 06:00 BST Jun 25
- SUP 1: 0.8530/31 Low June 23 / 76.4% of the Apr 5 - 26 rally
- SUP 2: 0.8487 1.0% 10-dma envelope
- SUP 3: 0.8472 Low Apr 5 and the bear trigger
- SUP 4: 0.8401 2.0% 10-dma envelope
The EURGBP outlook is unchanged and remains bearish. Support at 0.8561, May 12 low was breached Jun 17. This signalled the end of the recent consolidation and strengthened a bearish case. The focus is on 0.8531, 76.4% of the Apr 5 - 26 rally that has been tested. A break would expose key support at 0.8472, Apr 5 low. Initial firm resistance has been defined at 0.8602, Jun 21 high where a break would ease the bearish threat.
USDJPY TECHS: Fresh 2021 High
- RES 4: 112.23 High Feb 20, 2020 and a key resistance
- RES 3: 111.71 High Mar 24 and a key resistance
- RES 2: 111.30/47 High Mar 26, 2020 / 1.0% 10-dma envelope
- RES 1: 111.12 High Jun 24
- PRICE: 110.88 @ 06:06 BST Jun 25
- SUP 1: 110.21/109.72 Low Jun 22 / Low June 21
- SUP 2: 109.45/19 50-day EMA / Low Jun 7
- SUP 3: 108.56/34 Low May 25 / Low May 7 and key S/T support
- SUP 4: 107.48 Low Apr 23 and the bear trigger
USDJPY traded higher Thursday and again delivered fresh 2021 highs following this week's print above Y110.97, Mar 31 high and the previous bull trigger. This cements the uptrend and maintains a bullish price sequence of higher highs and higher lows. Attention is on 111.30/47, the Mar 26, 2020 high and 1.0% 10-dma envelope. Initial key support is unchanged at 109.72, Jun 21 low. A break of this level is required to signal a top.
EURJPY TECHS: Recovery Considered Corrective
- RES 4: 134.13 High Jun 1 and the bull trigger
- RES 3: 133.76 High Jun 10
- RES 2: 132.88 High Jun 17
- RES 1: 132.70 High Jun 23
- PRICE: 132.34 @ 06:13 BST Jun 25
- SUP 1: 131.22/130.04 Low Jun 22 / Low Jun 21
- SUP 2: 129.59 Low Apr 23
- SUP 3: 128.83 Low Mar 29
- SUP 4: 128.29 Low Mar 24 and key support
Despite this week's corrective gains, EURJPY remains vulnerable. A bearish theme follows a sharp move lower between Jun 15 - 21. The cross traded through the 50-day EMA and importantly also breached the bull channel support drawn off the Oct 30, 2020 low. This highlights a reversal and note, price did probe the 100-dma. Attention is on 130.00 and 129.59, Apr 23 low. Resistance is seen at 132.88, Jun 17 high.
AUDUSD TECHS: Corrective Cycle Still In Play
- RES 4: 0.7776 High Jun 11
- RES 3: 0.7693 50-day EMA
- RES 2: 0.7645 High Jun 17
- RES 1: 0.7603 Intraday high
- PRICE: 0.7592 @ 06:16 BST Jun 25
- SUP 1: 0.7538/7476 Low Jun 23 / Low Jun 21 and the bear trigger
- SUP 2: 0.7462 Low Dec 21, 2020
- SUP 3: 0.7372 1.236 proj of Feb 25 - Mar 9 - 18 price swing
- SUP 4: 0.7339 Low Nov 30, 2020
This week's AUDUSD gains are likely a correction. The outlook remains bearish following recent weakness. The pair has traded below key support at 0.7532 Apr 1 low and price has also tested the 200-dma. The move lower confirms a resumption of the reversal that occurred Feb 25 and signals scope for a deeper pullback towards 0.7462 next, the Dec 21, 2020 low. On the upside, initial firm resistance is at 0.7645, the Jun 17 high.
USDCAD TECHS: Outlook Remains Bullish
- RES 4: 1.2653 High Apr 21 and a key resistance
- RES 3: 1.2535 High Apr 22
- RES 2: 1.2501 76.4% retracement of the Apr 21 - Jun 1 sell-off
- RES 1: 1.2403 High Jun 22
- PRICE: 1.2316 @ 06:20 BST Jun 25
- SUP 1: 1.2258/53 50-day EMA / Low Jun 23
- SUP 2: 1.2234 20-day EMA
- SUP 3: 1.2157 Low Jun 16
- SUP 4: 1.2057/2007 Low Jun 7 / Low May 18
The USDCAD pullback this week is considered corrective and a bullish theme remains intact. The recent break of 1.2203, May 6 high confirmed a S/T reversal and the pair has also cleared the 50-day EMA, reinforcing bullish conditions. The focus is on 1.2501, a Fibonacci retracement. A break would open 1.2653, high Apr 21 and an important resistance. Initial support is seen at 1.2253, Jun 23 low. Note the 50-day EMA at 1.2258 also marks support.
FIXED INCOME
BUND TECHS: (U1) Bearish Risk Still Present
- RES 4: 173.79 High Apr 8
- RES 3: 173.32 76.4% retracement of the Mar 25 - May 19 sell-off
- RES 2: 173.16 High Jun 11
- RES 1: 173.03 High Jun 21
- PRICE: 172.22 @ 05:15 BST Jun 25
- SUP 1: 171.67 Low Jun 22
- SUP 2: 171.37 Low Jun 3
- SUP 3: 170.99 Low May 31 and key short-term support
- SUP 4: 170.56 Low May 24
Bund futures probed support at 171.80, Jun 17 low earlier this week. A clear break of this level would signal scope for a deeper pullback and confirm a breach of the 50-day EMA. This would open 171.37, Jun 3 low ahead of a firmer support at 170.99, Mar 31 low. Key resistance is unchanged at 173.16, Jun 11 high where a break would instead confirm a resumption of the uptrend that started May 19.
BOBL TECHS: (U1) Needle Still Points South
- RES 4: 134.758 1.382 proj of the May 20 - 26 - 31 price swing
- RES 3: 134.663 1.236 proj of the May 20 - 26 - 31 price swing
- RES 2: 134.510 1.00 proj of the May 20 - 26 - 31 price swing
- RES 1: 134.250/390 High Jun 17 / High Jun 15
- PRICE: 134.010 @ 05:22 BST Jun 25
- SUP 1: 133.860 Low May 28, 31, Jun 22 and key S/T support
- SUP 2: 133.700 76.4% retracement of the May 20 - Jun 11 rally
- SUP 3: 133.530 Low May 21
- SUP 4: 133.450 Low May 20 and the bear trigger
Bobl futures dipped lower earlier this week, extending the recent pullback. Although the move lower is considered corrective, a near-term bearish risk is present. Price is below the 20-day EMA and key support is at 133.860, May 28 and 31 low. A break lower would strengthen a bearish case. On the upside, key resistance and the bull trigger has been defined at 134.510, a Fibonacci projection and the Jun 11 high. Initial resistance is at 134.250.
SCHATZ TECHS: (U1) Support Remains Exposed
- RES 4: 112.210 High Jun 11 and the bull trigger
- RES 3: 112.185 High Jun 15 and 16
- RES 2: 112.175 High Jun 17 and 18
- RES 1: 112.140/165 High Jun 23, 24 / High Jun 21
- PRICE: 112.115 @ 05:28 BST Jun 25
- SUP 1: 112.110 Low Apr 20 and Jun 22, 23
- SUP 2: 112.086 138.2% retracement of the May17 - Jun 11 rally
- SUP 3: 112.075 150.0% retracement of the May17 - Jun 11 rally
- SUP 4: 112.064 161.8% retracement of the May17 - Jun 11 rally
Schatz futures traded lower earlier this week and breached support at 112.120, May 17 and Jun 21 low. Note too that price also tested the 112.110 support, Apr 20 low. Scope is seen for a move towards 112.086 and 112.075, Fibonacci retracement extensions. On the upside, initial firm resistance is seen at 112.165, Jun 21 high. A break would ease the current bearish pressure and open 112.185, the Jun 15 and 16 highs.
GILT TECHS: (U1) Pivot Support Remains Intact
- RES 4: 128.92 1.236 proj of the May 13 - 26 - Jun 3 price swing
- RES 3: 128.50 1.00 proj of the May 13 - 26 - Jun 3 price swing
- RES 2: 128.39 High Jun 11 and the bull trigger
- RES 1: 128.08 High Jun 21
- PRICE: 127.86 @ Close Jun 24
- SUP 1: 127.25/126.91 Low Jun 10
- SUP 2: 126.70 Low Jun 23 / Low Jun 3 and key near-term support
- SUP 3: 126.55 Low May 21
- SUP 4: 126.12 Low May 19
Gilt futures recently traded higher through a resistance at 127.74, May 26 high. This confirmed a bullish price sequence of higher highs and higher lows and the positive price condition remains intact. The pullback between Jun 11 - 17 is considered corrective and price remains above key short-term support at 126.70, Jun 3 low. A resumption of gains would open 128.39, Jun 11 high and the bull trigger. A break of 126.70 would instead be bearish.
BTP TECHS: (U1) Trading Closer To Recent Lows
- RES 4: 153.82 High Feb 12 (cont)
- RES 3: 153.40 1.236 proj of the May 19 - 28 price swing
- RES 2: 152.66 1.00 proj of the May 19 - 28 price swing
- RES 1: 151.68/152.47 High Jun 17 / High Jun 14 and the bull trigger
- PRICE: 150.86 @ Close Jun 24
- SUP 1: 150.28 Low Jun 24
- SUP 2: 150.11 Low Low Jun 8 and key near-term support
- SUP 3: 149.74 50.0% retracement of the May 19 - Jun 14 rally
- SUP 4: 149.53 Low May 28
BTP futures remain in their current bullish cycle that began Mar 19. With bulls in control, the recent pullback is still considered corrective and has allowed a recent overbought condition to unwind. Key near-term support lies at 150.11, Jun 8 low. Key resistance and the bull trigger has been defined at 152.47, Jun 14 high where a break would open 152.66, a Fibonacci projection and the Feb high of 153.82 (cont) further out.
EQUITIES
EUROSTOXX 50 TECHS: (U1) Bearish Engulfing Candle Still In Play
- RES 4: 4265.00 High Jan 15, 2008
- RES 3: 4200.00 Round number resistance
- RES 2: 4175.00 Nov 26, 2008 low (cont)
- RES 1: 4153.00 High Jun 17 and bull trigger
- PRICE: 4016.00 @ 05:43 BST Jun 25
- SUP 1: 4015.60/00 Channel base from Feb 26 (cont) / Low Jun 21
- SUP 2: 4004.20 50-day EMA
- SUP 3: 3914.00 Low May 20
- SUP 4: 3871.00 Low May 13
EUROSTOXX 50 futures found support Jun 21 at 4015.00. Attention remains on the Jun 18 sell-off however that in pattern terms is a bearish engulfing candle and signals a potential S/T top. Trend conditions are overbought and a corrective pullback would allow this to unwind. A resumption of weakness would expose the 50-day EMA at 4004.20. Key resistance and the bull trigger is 4153.00, Jun 17 high. A break resumes the uptrend.
E-MINI S&P (U1): Fresh All-Time High
- RES 4: 4415.48 1.00 proj of Mar 25 - May 10 - 13 price swing
- RES 3: 4322.15 0.764 proj of Mar 25 - May 10 - 13 price swing
- RES 2: 4300.00 Round Number Resistance
- RES 1: 4264.41 0.618 proj of Mar 25 - May 10 - 13 price swing
- PRICE: 4261.25 @ 06:45 BST Jun 25
- SUP 1: 4126.75 Low Jun 21 and key short-term support
- SUP 2: 4100.00 Round number support
- SUP 3: 4020.20 Low May 13 and key short-term support
- SUP 4: 3967.00 High Mar 18
S&P E-minis are firmer and have traded to fresh all-time highs once again. The contract this week tested the 50-day EMA at 4145.50 and the average provided support, reinforcing bullish conditions. The rally from the EMA on Jun 21 also confirmed an important bull signal and in pattern terms was a bullish piercing candle. With 4258.25, Jun 15 high breached, attention turns to 4300.00. Key short-term support is at 4126.75, low Jun 21.
COMMODITIES
BRENT TECHS: (Q1) Bull Trend Conditions Remain Intact
- RES 4: $79.63 - 1.50 proj of Mar 23 - May 18 - May 21 price swing
- RES 3: $78.03 - High Oct 29, 2018
- RES 2: $76.97 - 1.23 proj of Mar 23 - May 18 - May 21 price swing
- RES 1: $76.02 - High Jun 23
- PRICE: $75.65 @ 06:39 BST Jun 25
- SUP 1: $74.32 - Low Jun 22
- SUP 2: $72.74/01 - 20-day EMA / Low Jun 17
- SUP 3: $69.90 - High May 18 and the recent break out level
- SUP 4: $67.75 - Low May 25
Brent crude futures traded higher Wednesday and again extended the bounce from $72.01, Jun 17 low. The recovery also resulted in a fresh trend high following this week's clearance of the $74.96 high on Jun 16. The move confirms a resumption of the uptrend and maintains the bullish price sequence of higher highs and higher lows. A break below $72.01 is needed to signal a top.
WTI TECHS: (Q1) Needle Still Points North
- RES 4: $77.35 - 1.618 proj of Mar 23 - May 18 - May 21 price swing
- RES 3: $76.18 - 1.50 proj of Mar 23 - May 18 - May 21 price swing
- RES 2: $75.01 - 1.382 proj of Mar 23 - May 18 - May 21 price swing
- RES 1: $74.25 - High Jun 23
- PRICE: $73.45 @ 06:52 BST Jun 25
- SUP 1: $70.37/69.54 - 20-day EMA / Low Jun 17 and key S/T support
- SUP 2: $66.80 - High May 18
- SUP 3: $67.28 - 50-day EMA
- SUP 4: $65.02 - Low May 26
WTI crude rallied Monday and resumed its uptrend, clearing former resistance at $72.74, Jun 16 high. The contract traded higher again Wednesday. The break maintains a bullish price sequence of higher highs and higher lows and signals scope for further upside with attention on $75.01, a Fibonacci projection. On the downside, key support has been defined at $69.54, Jun 17 low. A break of this level is required to signal a top.
GOLD TECHS: Flag Formation Highlights Bearish Risk
- RES 4: $1903.8/16.6 - High Jun 8 / High Jun 1 and the bull trigger
- RES 3: $1877.7 - High Jun 14
- RES 2: $1827.3 - 20-day EMA
- RES 1: $1825.4 - High Jun 17
- PRICE: $1779.3 07:15 BST Jun 25
- SUP 1: $1761.1 - Low Jun 18
- SUP 2: $1756.2 - Low Apr 29
- SUP 3: $1733.5 -76.4% retracement of the MAr 8 - Jun 1 rally
- SUP 4: $1723.8 - Low Apr 13
Gold is consolidating and this phase has taken on the appearance of a bear flag, reinforcing bearish conditions. The yellow metal traded sharply lower last week confirming a bearish cycle. The move lower resulted in a breach of the 50-day EMA and the subsequent follow through signals scope for a deeper pullback. Attention is on $1756.2, Apr 29 low and $1733.5, a Fibonacci retracement. On the upside, initial resistance is seen at $1825.4, Jun 17 high.
SILVER TECHS: Bear Flag Formation
- RES 4: $28.556 - High Jun 1
- RES 3: $28.285 - High Jun 11 and a key resistance
- RES 2: $27.831 - High Jun 16
- RES 1: $26.495/27.245 - High Jun 18 / High Jun 17
- PRICE: $26.123 @ 07:20 BST Jun 25
- SUP 1: $25.554 - Low Jun 21
- SUP 2: $25.199 - Low Apr 14
- SUP 3: $24.955 - 76.4% retracement of the Mar 31 - May 18 rally
- SUP 4: $24.686 - Low Apr 13
Why MNI
MNI is the leading provider
of intelligence and analysis on the Global Fixed Income, Foreign Exchange and Energy markets. We use an innovative combination of real-time analysis, deep fundamental research and journalism to provide unique and actionable insights for traders and investors. Our "All signal, no noise" approach drives an intelligence service that is succinct and timely, which is highly regarded by our time constrained client base.Our Head Office is in London with offices in Chicago, Washington and Beijing, as well as an on the ground presence in other major financial centres across the world.