
Why MNI
MNI is the leading provider
of intelligence and analysis on the Global Fixed Income, Foreign Exchange and Energy markets. We use an innovative combination of real-time analysis, deep fundamental research and journalism to provide unique and actionable insights for traders and investors. Our "All signal, no noise" approach drives an intelligence service that is succinct and timely, which is highly regarded by our time constrained client base.Our Head Office is in London with offices in Chicago, Washington and Beijing, as well as an on the ground presence in other major financial centres across the world.
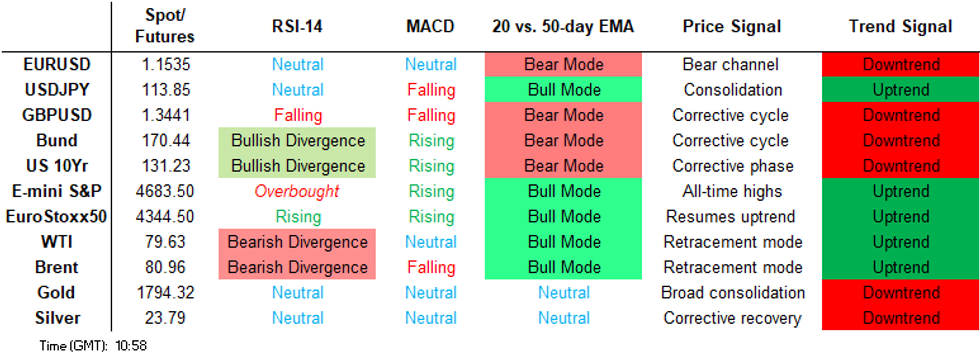
Price Signal Summary - Sterling Still Under Pressure
- In the equity space, S&P E-minis continue to defy gravity and have registered another all-time high. The focus is on 4687.32 next, 1.382 projection of Jul 19 - Aug 16 - Aug 19 price swing. EUROSTOXX 50 futures maintain a bullish tone. Attention is on 4371.00, 1.236 projection of Jul 19-Sep 6-Oct 6 2020 swing (cont)
- In FX, EURUSD remains below recent highs and the outlook is bearish. The move lower on Oct 29 - a bearish engulfing candle - highlights a failure to clear the 50-day EMA and means the bear channel top at 1.1686 today, remains intact. The channel is drawn off the Jun 1 high. The focus is on 1.1524, Oct 12 low and bear trigger. GBPUSD remains under pressure. The deeper pullback has exposed the next key support at 1.3412, Sep 29 low. Yesterday's strong rally in EURGBP and today's follow through has exposed 0.8598, 76.4% retracement of the Sep 29 - Oct 26 sell-off and 0.8658 further out, Sep 29 high. USDJPY remains below recent highs but above support at 113.45-00, the 20-day EMA and Oct 12 low respectively. A break would signal scope for a deeper pullback. The trend for now remains up.
- On the commodity front, Gold reversed course yesterday and has rebounded off Wednesday's low of $1759.0. The turnaround reinstates a potential bullish outlook and exposes resistance at $1813.8, Oct 22 high. This week's sell-off in WTI resulted in a breach of $80.58, Oct 28 low and the contract cleared the 20-day EMA. This has opened the 50-day EMA at $77.17. Key resistance has been defined at $85.41, the Oct 25 high.
- In the FI space, short-term gains in Bund futures traded higher yesterday and breached resistance at 169.83, Oct 27 high. Note too that futures have also probed the 50-day EMA at 170.06. A clear break of both these levels would open 171.14, 50.0% retracement of the Aug - Nov sell-off. Gilts are rallying and the recent double bottom reversal is playing out. The focus is on 127.09 next, 61.8% retracement of the Aug - Oct downleg.
FOREIGN EXCHANGE
EURUSD TECHS: Bearish Risk Still Present
- RES 4: 1.1821 High Sep 16
- RES 3: 1.17155 / High Sep 22
- RES 2: 1.1681 Bear channel top drawn from the Jun 1 high
- RES 1: 1.1617/92 High Nov 4 / High Oct 28
- PRICE: 1.1551 @ 06:06 GMT Nov 5
- SUP 1: 1.1524 Low Oct 12 and the bear trigger
- SUP 2: 1.1493 50.0% retracement of the Mar '20 - Jan '21 bull phase
- SUP 3: 1.1469 1.236 proj of the Jan 6 - Mar 31 - May 25 price swing
- SUP 4: 1.1341 Bear channel base drawn from the Jun 1 high
EURUSD traded lower Thursday. The move lower reinforces a bearish theme following the Oct 29 sharp sell-off that highlighted a failure to clear the 50-day EMA and means the bear channel top - a key resistance - at 1.1681 today, remains intact. A channel breakout is needed to signal a trend reversal. The focus is on 1.1524, Oct 12 low and the bear trigger. A break of this level would confirm a resumption of the downtrend.
GBPUSD TECHS: Approaching Key Support
- RES 4: 1.3913 High Sep 14 and a key resistance
- RES 3: 1.3835 High Oct 20
- RES 2: 1.3710 50-day EMA
- RES 1: 1.3606 Low Nov 2
- PRICE: 1.3431 @ 10:27 GMT Nov 5
- SUP 1: 1.3423 2.0% 10-dma env
- SUP 2: 1.3412 Low Sep 29 and bear trigger
- SUP 3: 1.3354 Low Dec 23, 2020
- SUP 4: 1.3334 1.00 proj of the Sep 14 - 29 - Oct 20 price swing
GBPUSD traded sharply lower Thursday and remains under pressure today.. The break lower confirms a resumption of the recent sell-off and resulted in a break of support at 1.3544., Oct 6 low. The breach of this level strengthens the short-term case for bears and highlights a likely resumption of the broader downtrend. Key support and the bear trigger lies at 1.3412. The 50-day EMA at 1.3710 marks initial resistance.
EURGBP TECHS: Rally Extends
- RES 4: 0.8670 High Jul 20
- RES 3: 0.8658 High Sep 29 and key resistance
- RES 2: 0.8624 High Oct 1
- RES 1: 0.8598 76.4% retracement of the Sep 29 - Oct 26 sell-off
- PRICE: 0.8589 @ 10:30 GMT Nov 5
- SUP 1: 0.8509 50-day EMA
- SUP 2: 0.8463/41 Low Nov 3 / Low Nov 1
- SUP 3: 0.8403 Low Oct 26 and the bear trigger
- SUP 4: 0.8388/56 1.0% 10-dma envelope / Low Feb 26, 2020
EURGBP bids returned Thursday and the cross continues to push higher. The break to the upside highlights a breach of the 50-day EMA at 0.8507. The clear break of this EMA further improves short-term conditions for bulls and signals scope for an extension. 0.8561, 61.8% of the Sep 29 - Oct 26 sell-off, has been cleared. The breach opens 0.8598, the 76.4% retracement. Initial firm support lies Thursday's intraday low of 0.8463.
USDJPY TECHS: Still In A Range
- RES 4: 116.08 1.764 proj of Apr 23 - Jul 2 - Aug 4 price swing
- RES 3: 115.51 High Mar 10, 2017
- RES 2: 114.99 1.50 proj of Apr 23 - Jul 2 - Aug 4 price swing
- RES 1: 114.70/73 High Oct 20 / High Nov 6, 2017
- PRICE: 113.67 @ 06:16 GMT Nov 5
- SUP 1: 113.45/00 20-day EMA / Low Oct 12
- SUP 2: 112.08 High Sep 30 and a recent breakout level
- SUP 3: 111.51 Low Oct 8
- SUP 4: 110.82/80 Low Oct 4 / High Aug 11
USDJPY remains in a consolidation mode. Attention is still on 113.45, the 20-day EMA and 113.00, the Oct 12 low. Clearance of this support zone would signal scope for a deeper pullback and open 112.08, Sep 30 high and a recent breakout level. Any deeper short-term sell-off however would be considered corrective. Primary trend conditions remain bullish and the trigger for a resumption of the uptrend is unchanged at 114.70, Oct 20 high.
EURJPY TECHS: Trades Through The 20-Day EMA
- RES 4: 134.40 2.382 proj of the Sep 22 - 29 - Oct 6 price swing
- RES 3: 134.13 High Jun 1 and a key resistance
- RES 2: 133.76 High Jun 10
- RES 1: 132.92/133.48 High Oct 29 / High Oct 20
- PRICE: 131.34 @ 06:19 GMT Nov 5
- SUP 1: 130.94 50-Day EMA
- SUP 2: 130.75 High Sep 3 and a recent breakout level
- SUP 3: 129.28 Low Oct 11
- SUP 4: 128.94 Low Oct 8
EURJPY traded lower Thursday and the cross has breached its 20-day EMA. The clear break of this EMA suggests scope for a deeper corrective pullback and exposes 130.75, Sep3 high and a recent key breakout level. Note that 130.94 is where the 50-day EMA intersects - a key short-term support. Broader trend signals continue to point north however, the trigger for a resumption of gains is 133.48.
AUDUSD TECHS: Probes Its 50-Day EMA
- RES 4: 0.7630 1.236 proj of the Aug 20 - Sep 3 - Sep 29 price swing
- RES 3: 0.7599 High Jul 6
- RES 2: 0.7552/57 200-dma / 50.0% of the Feb - Aug sell-off
- RES 1: 0.7471 High Nov 4
- PRICE: 0.7385 @ 06:24 GMT Nov 5
- SUP 1: 0.7397/79 50-day EMA / Intraday low
- SUP 2: 0.7324 Low Oct 13
- SUP 3: 0.7288 Low Oct 8
- SUP 4: 0.7226/7170 Low Oct 6 / Low Sep 29
AUDUSD traded lower yesterday and the pair appears vulnerable for now. Dips though are still considered corrective. Last week's breach of 0.7546, Oct 21 high confirmed a resumption of the uptrend and opens the 200-dma at 0.7552. Clearance of this average would strengthen bullish conditions and extend the positive price sequence of higher highs and higher lows. For bears, a clear break of the 50-day EMA at 0.7397 would alter the picture.
USDCAD TECHS: Gains Considered Corrective
- RES 4: 1.2648 High Oct 6
- RES 3: 1.2562 High Oct 8
- RES 2: 1.2494 Low Sep 3 and recent breakout level and 50-day EMA
- RES 1: 1.2472 High Nov 4
- PRICE: 1.2466 @ 06:28 GMT Nov 5
- SUP 1: 1.2352 Low Nov 1
- SUP 2: 1.2288 Low Oct 21 and the bear trigger
- SUP 3: 1.2253 Low Jun 23
- SUP 4: 1.2229 76.4% retracement of the Jun - Aug rally
USDCAD maintains this week's firmer tone. Recent gains are considered corrective and recent activity still appears to be a bear flag. If correct, it reinforces the underlying bearish conditions and signals scope for a break lower near-term. A bearish theme follows the recent breach of the Jul 30 low of 1.2422 that has opened 1.2253 next, Jun 23 low. Moving average conditions remain in a bear mode. Initial firm resistance is seen at 1.2494.
FIXED INCOME
BUND TECHS: (Z1) Through Resistance
- RES 4: 171.95 61.8% retracement of the Aug - Nov sell-off
- RES 3: 171.14 50.0% retracement of the Aug - Nov sell-off
- RES 2: 170.55 High Oct 4
- RES 1: 170.33 High Nov 4
- PRICE: 170.15 @ 05:11 GMT Nov 5
- SUP 1: 168.98 Low Nov 3
- SUP 2: 167.69 Low Nov 1 and the bear trigger
- SUP 3: 167.52 Low Mar 19 2020 (cont)
- SUP 4: 166.33 Low May 21 2019 (cont)
Bund futures traded higher yesterday and in the process breached resistance at 169.83, Oct 27 high. Note too that futures have also probed the 50-day EMA at 170.06. A clear break of both these levels would suggest scope for a stronger short-term corrective bounce. This would open 171.14, a Fibonacci retracement. On the downside, key support has been defined at 167.69, Nov 1 low. Initial support is at 168.98.
BOBL TECHS: (Z1) Short-Term Correction Established
- RES 4: 135.540 High Sep 21
- RES 3: 135.380 High Sep 23
- RES 2: 135.200 Low Sep 17, high Oct 4 and recent breakout level
- RES 1: 135.060 High Nov 4
- PRICE: 135.000 @ 05:22 GMT Nov 5
- SUP 1: 134.320 Low Nov 3
- SUP 2: 133.900/690 Low Nov 2
- SUP 3: 133.340 Low Mar 19 and key medium-term support (cont)
- SUP 4: 133.308 1.764 proj of the Oct 4 - 13 - 14 price swing
A sharp rally in Bobl futures yesterday means the contract has established a bullish short-term tone. Gains are still considered corrective however and the primary trend direction remains down. Attention for now is on resistance at 135.20, the Sep 17 low and Oct 4 high. Clearance of this level would pave the way for strength towards 135.540, Sep 21 high. On the downside, initial support lies at 134.320, Nov 3 low.
SCHATZ TECHS: (Z1) Strong Rally Extends
- RES 4: 112.340 Aug 31 high
- RES 3: 112.305 High Sep 3
- RES 2: 112.290 High Sep 20
- RES 1: 112.280 High Nov 4
- PRICE: 112.245 @ 05:10 GMT Nov 5
- SUP 1: 112.100 Low Nov 3
- SUP 2: 112.050/111.945 Low Nov 2 / Low Oct 28
- SUP 3: 111.925 1.236 proj of the Oct 14 - 19 - 26 price swing
- SUP 4: 111.897 1.382 proj of the Oct 14 - 19 - 26 price swing
A sharp rally in Schatz futures yesterday means the contract has entered and established a corrective bullish short-term cycle. Attention is on resistance at 112.290, the Sep 20 high where a break would pave the way for strength towards 112.340, Aug 31 high. Gains are still considered corrective and the broader trend direction remains down. Initial support lies at 112.100, Nov 3 low.
GILT TECHS: (Z1) Double Bottom Still In Play
- RES 4: 127.95 76.4% retracement of the Aug - Oct downleg
- RES 3: 127.69 High Sep 21
- RES 2: 127.09 61.8% retracement of the Aug - Oct downleg
- RES 1: 126.64 Intraday high
- PRICE: 126.46@ 10:26 GMT Nov 5
- SUP 1: 124.79/25 Low Nov 4 / Low Nov 1
- SUP 2: 123.43 Low Oct 21 and the bear trigger
- SUP 3: 123.16 Low Feb 27, 2019 (cont)
- SUP 4: 122.75 2.236 proj of the Aug 31 - Sep 17 - 21 price swing
Gilt futures traded sharply higher yesterday. This reinforces a recent bullish signal that highlighted a potential base - the recent break and close above 125.27, Oct 14 high confirmed a double bottom reversal pattern. Yesterday's break of 125.87, Oct 27 high and today's follow through signals scope for stronger short-term gains. The focus is on 127.09, a retracement level. Initial key support has been defined at 124.25, Nov 1 low.
BTP TECHS: (Z1) Strong Corrective Rally
- RES 4: 154.64 High Sep 22 / 23
- RES 3: 153.59 High Sep 24
- RES 2: 152.54/87 High Oct 14 / High Oct 1
- RES 1: 151.95 High Nov 4
- PRICE: 151.79 @ Close Nov 4
- SUP 1: 149.89 Nov 3 low
- SUP 2: 148.14/147.12 Low Nov 2 / Low Nov 1 and the bear trigger
- SUP 3: 146.65 1.618 proj of the Sep 23 - Oct 6 - 14 price swing
- SUP 4: 146.12 1.764 proj of the Sep 23 - Oct 6 - 14 price swing
BTP futures found some support this week and again traded higher yesterday. Gains this week means the contract has established a short-term bullish corrective cycle. Attention is on 152.54 next, the Oct 14 high where a break would strengthen the current bullish theme. The broader trend direction remains bearish though. Initial support is seen at 149.89, the Nov 3 low. Key support lies at 147.12, Nov 1 low.
EQUITIES
EUROSTOXX 50 TECHS: (Z1) Trend Needle Points North
- RES 4: 4448.00 High Jan 2, 2008 (cont)
- RES 3: 4400.00 Round number resistance
- RES 2: 4371.00 1.236 proj of Jul 19-Sep 6-Oct 6 2020 swing (cont)
- RES 1: 4333.00 High Nov 4
- PRICE: 4327.50 @ 06:03 GMT Nov 5
- SUP 1: 4223.50 High Sep 6 and a recent breakout level
- SUP 2: 4178.00/4151.20 Low Oct 29 / 50-day EMA
- SUP 3: 4004.00 / 3949.50 Low Oct 12 / Low Oct 6 and bear trigger
- SUP 4: 3902.50 Low Jul 20
The EUROSTOXX 50 futures uptrend remains firmly intact. The contract has recently cleared former key resistance at 4223.00, Sep 6 high and a key bull trigger. The break of this hurdle confirmed a resumption of the underlying uptrend and attention is on 4371.00 next, a Fibonacci projection. On the downside, the 50-day EMA, at 4151.20, remains a key support. A break would signal a potential short-term top.
E-MINI S&P (Z1): Still Heading North
- RES 4: 4717.00 1.50 proj of Jul 19 - Aug 16 - Aug 19 price swing
- RES 1: 4700.00 Round number resistance
- RES 3: 4687.32 1.382 proj of Jul 19 - Aug 16 - Aug 19 price swing
- RES 1: 4677.50 Intraday high
- PRICE: 4671.50 @ 07:04 GMT Nov 5
- SUP 1: 4586.50 Low Nov 1
- SUP 2: 4543.75/4472.00 Low Oct 27 / High Sep 27
- SUP 3: 4471.67 50-day EMA and key near-term support
- SUP 4: 4317.25/4260.00 Low Oct 12 / Low Oct 1 and the bear trigger
S&P E-minis maintain a bullish tone. The contract continues to head north and deliver fresh all-time highs. These fresh highs confirm a resumption of the uptrend and the focus is on 4687.32 next, a Fibonacci projection. Trend signals such as moving average studies remain in a bull mode, reinforcing current conditions and market sentiment. The 50-day EMA at 4463.44 continues to represent a firm support handle.
COMMODITIES
BRENT TECHS: (F2) Eyeing The 50-Day EMA
- RES 4: $90.00 - Psychological round number
- RES 3: $87.73 - 2.00 proj of the Aug 23 - Sep 3 - Sep 9 price swing
- RES 2: $85.77/87.00 - High Oct 25 / Round number resistance
- RES 1: $84.49 - High Nov 4
- PRICE: $80.38 @ 06:23 GMT Nov 5
- SUP 1: $80.20 - Low Nov 4
- SUP 2: $79.15 - 50-day EMA
- SUP 3: $78.42 - Low Oct 7
- SUP 4: $75.80 - Low Sep 30
Brent futures faced selling pressure again yesterday. Bearish conditions prevail following this week's breach of support at $81.61, Oct 28 low and the move lower suggests a short-term corrective cycle has unfolded. The focus is on the 50-day EMA at $79.15. This is seen as a key short-term support and a clear break would suggest scope for a deeper pullback. Key resistance has been defined at $85.77, the Oct 25 high.
WTI TECHS: (Z1) Weaker Short-Term Outlook
- RES 4: $88.96 - 1.382 proj of the Sep 21 - Oct 6 - 7 price swing
- RES 3: $87.45 - 1.236 proj of the Sep 21 - Oct 6 - 7 price swing
- RES 2: $86.00 - Round number resistance
- RES 1: $83.42/85.41 - High Nov 4 / High Oct 25 and the bull trigger
- PRICE: $79.33 @ 06:46 GMT Nov 5
- SUP 1: $78.25 - Low Nov 4
- SUP 2: $77.17 - 50-day EMA
- SUP 3: $74.67 - Low Oct 7 and key near-term support
- SUP 4: $72.82 - Low Sep 30
WTI futures are weaker. Wednesday's sell-off resulted in a breach of support at $80.58, Oct 28 low and note that price has also cleared the 20-day EMA. This suggests scope for a deeper corrective pullback. The move lower has opened the 50-day EMA at $77.17. This EMA is seen as a key short-term support and a clear break would suggest scope for a deeper pullback. Key resistance has been defined at $85.41, the Oct 25 high.
GOLD TECHS: Short-Term Outlook Appears Bearish
- RES 4: $1863.3 - 76.4% retracement of the Jun - Aug sell-off
- RES 3: $1844.9 - Low Jun 14
- RES 2: $1834.0 - High Sep 3 and the bull trigger
- RES 1: $1801.2/1813.8 - High )ct 29 / High Oct 22 and key resistance
- PRICE: $1797.3 @ 07:15 GMT Nov 5
- SUP 1: $1781.5/1759.0 - 50-day EMA / Low Nov 3 and a key support
- SUP 2: $1746.0 - Low Oct 6
- SUP 3: $1721.7 - Low Sep 29 and the bear trigger
- SUP 4: $1717.8 - Low Aug 10
Gold reversed course yesterday and has rebounded off Wednesday's low of $1759.0. The turnaround reinstates a potential bullish outlook and exposes once again, resistance at $1813.8, Oct 22 high. A break of this level would strengthen a short-term bullish case and signal scope for a climb towards $1834.0, the Sep 3 high. Key short-term support is at $1759.0, a break would be bearish.
SILVER TECHS: Watching Support
- RES 4: $26.002 - High Aug 4
- RES 3: $25.206 - High Jun 8
- RES 2: $24.867 - High Sep 3 and the reversal trigger
- RES 1: $24.094/828 - High Oct 29 / High Oct 22
- PRICE: $23.876 @ 07:21 GMT Nov 5
- SUP 1: $23.015 - Low Oct 18
- SUP 2: $22.213 - Low Oct 6
- SUP 3: $21.423 - Low Sep 29 and key support
- SUP 4: $20.871 - 50.0% retracement of the Mar '20 - Feb '21 rally
Recent Silver weakness is weighing on the metal. The move lower has exposed support at $23.015, Oct 18 low. A break of this level would threaten the recent bullish theme and allow for a deeper pullback. This would open $22.213, Oct 6 low and suggest potential for weakness towards $21.423, the Sep 29 low. Key resistance has been defined at $24.828, the Oct 22 high. A break would instead strengthen the case for bulls.
Why MNI
MNI is the leading provider
of intelligence and analysis on the Global Fixed Income, Foreign Exchange and Energy markets. We use an innovative combination of real-time analysis, deep fundamental research and journalism to provide unique and actionable insights for traders and investors. Our "All signal, no noise" approach drives an intelligence service that is succinct and timely, which is highly regarded by our time constrained client base.Our Head Office is in London with offices in Chicago, Washington and Beijing, as well as an on the ground presence in other major financial centres across the world.