
Why MNI
MNI is the leading provider
of intelligence and analysis on the Global Fixed Income, Foreign Exchange and Energy markets. We use an innovative combination of real-time analysis, deep fundamental research and journalism to provide unique and actionable insights for traders and investors. Our "All signal, no noise" approach drives an intelligence service that is succinct and timely, which is highly regarded by our time constrained client base.Our Head Office is in London with offices in Chicago, Washington and Beijing, as well as an on the ground presence in other major financial centres across the world.
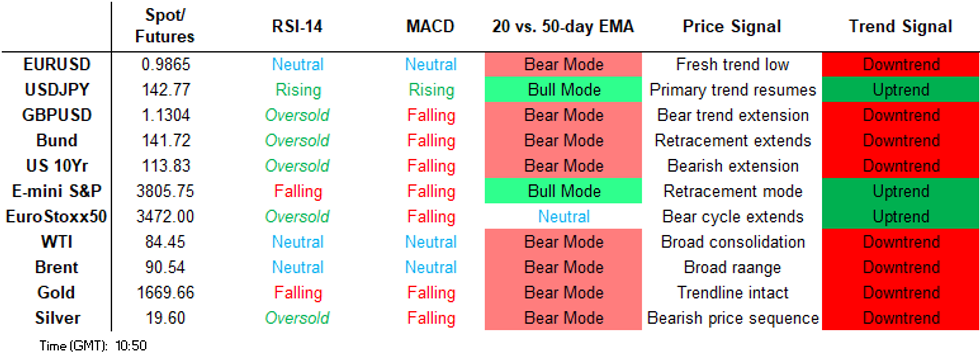
Price Signal Summary - Volatile JPY Price Action
- In the equity space, S&P E-Minis traded lower Wednesday and cleared recent lows to confirm a resumption of the bear cycle that started mid-August. This strengthens bearish conditions and opens 3741.75, Jul 14 low. The key support at 3657.00, Jun 17 low, has also been exposed. EUROSTOXX 50 futures remain soft following the reversal last week from 3678.00, Jun 13 high. Attention is on a key short-term support at 3423.00, the Sep 5 low. This level has been pierced, a clear break would strengthen bearish conditions and open 3360.00, the Jul 14 low. Short-term gains are considered corrective, first resistance is at 3543.60, the 20-day EMA.
- In FX, the EURUSD traded lower Wednesday, resuming the downtrend following the break of support at 0.9864, Sep 6 low. The move lower maintains the bearish price sequence of lower lows and lower highs - the definition of a bear trend. The focus is on 0.9694, a Fibonacci projection. Resistance is seen at 0.9945, the Sep 16 low. The GBPUSD downtrend remains intact. The reversal lower last week reinforced bearish conditions and the continued weakness maintains the bearish price sequence of lower lows and lower highs, signalling scope for a continuation. The focus is on the 1.1153, 1.764 proj of the Jun 16 - Jul 14 - Aug 1 price swing. USDJPY has staged a sharp reversal following today’s BOJ intervention. The pullback resulted in a print below 141.68, the 20-day EMA. The trend structure remains bullish and it is too early to tell whether today’s price action is the start of a more meaningful reversal. A daily close below the 20-day EMA and below 140.00 would strengthen a bearish threat. A resumption of gains however, would refocus attention on the 145.00 handle and beyond.
- On the commodity front, Gold is consolidating and the recent pause in the downtrend appears to be a bear flag formation. This pattern reinforces a bearish theme. The recent break of support at $1681.0, the Jul 21 low, confirmed a resumption of the downtrend that started early March. Attention is on $1640.9 next, the Aug 8 2020 low. In the Oil space, the WTI futures outlook is bearish and yesterday’s gains are considered corrective. The recent break of support at $85.37, Aug 16 low, confirmed a resumption of the downtrend that started Jun 8. A resumption of weakness would open $79.83 next, the Feb 18 low. Firm resistance is at $89.59, the 50-day EMA.
- In the FI space, Bund futures remain in a clear downtrend and Tuesday’s extension lower confirmed a resumption of the bear leg that started early August. 140.67, the Jun 16 low (cont), has been pierced. A clear break would open the psychological 140.00 handle. Gilts remain vulnerable and futures touched a fresh trend low of 103.32 on Wednesday. Attention is on 103.05 2.236 projection of the Aug 22 - 24 - 26 price swing.
FOREIGN EXCHANGE
EURUSD TECHS: Bear Trend Resumes
- RES 4: 1.0198/0249 High Sep 12 / 76.4% of Aug 10 - Sep 6 downleg
- RES 3: 1.0078 Bear channel top drawn from the Feb 10 high
- RES 2: 1.0001 20-day EMA
- RES 1: 0.9945 Low Sep 16
- PRICE: 0.9827 @ 05:57 BST Sep 22
- SUP 1: 0.9800 Round number support
- SUP 2: 0.9785 2.00 projection of the Jun 9 - 15 - 27 price swing
- SUP 3: 0.9694 1.00 projection of the Aug 10 - Sep 6 - 12 price swing
- SUP 4: 0.9613 Low Sep 2002
EURUSD traded lower Wednesday, resuming the downtrend following the break of support at 0.9864, Sep 6 low. The move lower maintains the bearish price sequence of lower lows and lower highs - the definition of a bear trend. Price is also lower inside the bear channel drawn from the Feb 10 high. The focus is on 0.9694, a Fibonacci projection. Resistance is seen at 0.9945, the Sep 16 low.
GBPUSD TECHS: Fresh Cycle Lows Once Again
- RES 4: 1.1810 50-day EMA
- RES 3: 1.1783 High Aug 29
- RES 2: 1.1558/1738 20-day EMA / High Sep 13 and key resistance
- RES 1: 1.1461 High Sep 20
- PRICE: 1.1329 @ 09:48 BST Sep 22
- SUP 1: 1.1212 Intraday low
- SUP 2: 1.1153 1.764 proj of the Jun 16 - Jul 14 - Aug 1 price swing
- SUP 3: 1.1100 Round number support
- SUP 4: 1.1001 2.00 proj of the Jun 16 - Jul 14 - Aug 1 price swing
The GBPUSD downtrend remains intact and the pair has again resumed its downtrend. The reversal lower last week reinforced bearish conditions and the continued weakness maintains the bearish price sequence of lower lows and lower highs, signalling scope for a continuation. Note that moving average studies are in a bear mode set-up too. The focus is on the 1.1153, a Fibonacci projection. Firm resistance is at 1.1558, the 20-day EMA.
EURGBP TECHS: Uptrend Remains Intact
- RES 4: 0.8852 50.0% retracement of the 2020 - 2022 downleg
- RES 3: 0.8840 High Feb 2
- RES 2: 0.8811 1.236 proj of the Apr 14 - Jun 15 - Aug 2 price swing
- RES 1: 0.8788 High Sep 19
- PRICE: 0.8727 @ 09:49 BST Sep 22
- SUP 1: 0.8708 Intraday low
- SUP 2: 0.8655 20-day EMA
- SUP 3: 0.8575 50-day EMA
- SUP 4: 0.8522 Low Aug 30
EURGBP is holding on to the bulk of its recent gains. The short-term outlook is bullish. Last week’s gains confirmed a break of key resistance at 0.8721, the Jun 15 high and an important bull trigger. The climb resumes the bull cycle that started early March and the focus is on 0.8811 next, a Fibonacci projection. On the downside, initial firm support is seen at 0.8655, the 20-day EMA. A pullback would be considered corrective.
USDJPY TECHS: Finding Support At The Day Low - For Now
- RES 4: 146.52 1.236 proj of the May 24 - Jul 14 - Aug 2 price swing
- RES 3: 146.03 2.764 proj of the Aug 2 - 8 - 11 price swing
- RES 2: 145.90 Intraday high
- RES 1: 143.30 50.0% retracement of today’s range
- PRICE: 142.19 @ 09:58 BST Sep 22
- SUP 1: 141.68 20-day EMA
- SUP 2: 140.70 Intraday low
- SUP 3: 139.87 Low Sep 2
- SUP 4: 138.72 50-day EMA
USDJPY has staged a sharp reversal following today’s BOJ intervention. The pullback has resulted in a print below 141.68, the 20-day EMA. The trend structure remains bullish and it is too early to tell whether today’s price action is the start of a more meaningful reversal. A daily close below the 20-day EMA and below 140.00 would strengthen a bearish threat. A resumption of gains however, would refocus attention on the 145.00 handle and beyond.
EURJPY TECHS: Reversal Or Correction?
- RES 4: 146.23 2.236 proj of the Aug 2- 10 - 16 price swing
- RES 3: 145.64 High Sep 12 and the bull trigger
- RES 2: 144.04 High Sep 20
- RES 1: 141.69 20-day EMA
- PRICE: 140.47 @ 10:08 BST Sep 22
- SUP 1: 140.09 50-day EMA
- SUP 2: 139.28 Intraday low
- SUP 3: 138.69 Low Sep 5
- SUP 4: 137.47 76.4% retracement of the Aug 16 - Sep 12 rally
A sharp volatile reversal lower in EURJPY has resulted in a print below the 50-day EMA, at 140.09. At this stage, weakness in the cross is considered corrective and despite today’s BOJ intervention, technical trend signals continue to highlight a bull cycle. That said, price action is likely to remain volatile. A daily close below the 50-day EMA would strengthen a bearish threat. Initial key resistance is at 144.04, the Sep 20 high.
AUDUSD TECHS: Clears Key Support
- RES 4: 0.6956 High Aug 30
- RES 3: 0.6916 High Sep 13 and a key resistance
- RES 2: 0.6747/79 High Sep 20 / 20-day EMA
- RES 1: 0.6682 Low Jul 14 and a recent breakout level
- PRICE: 0.6649 @ 10:15 BST Sep 22
- SUP 1: 0.6574 Intraday low
- SUP 2: 0.6568 Low May 27 2020
- SUP 3: 0.6538 Low May 26 2020
- SUP 4: 0.6464 61.8% retracement of the 2020 - 2021 bull leg
AUDUSD has resumed its downtrend - the pair has cleared support at 0.6682, the Jul 14 low and bear trigger. The break strengthens bearish conditions and maintains the broader bearish price sequence of lower lows and lower highs. This has opened 0.6868 next, the May 27 2020 low ahead of 0.6464, a Fibonacci retracement. Initial firm resistance has been defined at 0.6747, the Sep 20 high.
USDCAD TECHS: Impulsive Rally Extends
- RES 4: 1.3716 High Jun 26 2020
- RES 3: 1.3702 2.382 proj of the Aug 25 - Sep 7 - 13 price swing
- RES 2: 1.3651 61.8% retracement of the 2020 - 2021 bear leg
- RES 1: 1.3582 2.00 proj of the Aug 25 - Sep 7 - 13 price swing
- PRICE: 1.3541 @ 08:00 BST Sep 22
- SUP 1: 1.3358/3227 Low Sep 21 / 20
- SUP 2: 1.3163/2954 20-day EMA / Low Sep 13
- SUP 3: 1.2895 Low Aug 25 and key near-term support
- SUP 4: 1.2828 Low Aug 17
USDCAD maintains a clear bullish tone and the pair continues to climb. The extension reinforces bullish conditions and maintains the positive price sequence of higher highs and higher lows. Moving average studies are in a bull mode position, highlighting current market sentiment. Sights are set on 1.3582 next, a Fibonacci projection. On the downside, initial firm support is at 1.3227, Tuesday's low.
FIXED INCOME
BUND TECHS: (Z2) Bear Trend Intact
- RES 4: 146.81 High Sep 5 and a key resistance
- RES 3: 144.53 20-day EMA
- RES 2: 143.87 High Sep 14
- RES 1: 142.58 High Sep 20
- PRICE: 141.04 @ 05:07 BST Sep 22
- SUP 1: 140.67/53 Low Jun 16 2022 / Low Sep 20
- SUP 2: 140.00 Psychological round number
- SUP 3: 139.20 3.382 proj of the Aug 2 - 12 - 15 price swing
- SUP 4: 138.68 Low Jan 2014
Bund futures remain in a clear downtrend and the extension lower earlier this week confirmed a resumption of the bear leg that started early August. The 142.00 handle has been cleared and attention is on the next major support at 140.67, the Jun 16 low (cont). This level has been pierced, a clear break would strengthen the broader bearish outlook and open the psychological 140.00 handle. The 20-day EMA, at 144.53 is a firm resistance.
BOBL TECHS: (Z2) Key Support Cleared
- RES 4: 123.160 High Sep 8
- RES 3: 122.293 20-day EMA
- RES 2: 121.570 High Sep 16 / 19
- RES 1: 121.120 High Sep 20
- PRICE: 120.160 @ 10:14 BST Sep 22
- SUP 1: 119.670 Intraday low
- SUP 2: 119.426 1.764 proj of the Aug 25 - Sep 1 - Sep 6 price swing
- SUP 3: 119.260 Low Aug 2011
- SUP 4: 118.850 2.000 proj of the Aug 25 - Sep 1 - Sep 6 price swing
The trend needle in Bobl futures still points south and the contract has traded lower today, reinforcing bearish conditions. A key support at 119.940, the Jun 16 low (cont) and the bear trigger, has been cleared. The break of this level confirms a resumption of the broader downtrend and opens 119.426 next, a Fibonacci projection ahead of 119.260, the Aug 2011 low (cont). Firm resistance is seen at 122.293, the 20-day EMA.
SCHATZ TECHS: (Z2) Bearish Extension
- RES 4: 108.045 High Sep 9
- RES 3: 107.899 20-day EMA
- RES 2: 107.585 High Sep 19
- RES 1: 107.380 High Sep 20
- PRICE: 106.940 @ 10:15 BST Sep 22
- SUP 1: 106.790 Intraday low
- SUP 2: 106.730 2.00 proj of the Aug 25 - Sep 1 - Sep 6 price swing
- SUP 3: 106.513 2.236 proj of the Aug 25 - Sep 1 - Sep 6 price swing
- SUP 4: 106.379 2.382 proj of the Aug 25 - Sep 1 - Sep 6 price swing
The Schatz futures trend direction remains down and the contract has traded to a fresh trend low once again today confirming an extension of the bear cycle. This also maintains the current bearish price sequence of lower lows and lower highs with moving average studies in a bear mode position. The focus is on 106.730 next, a Fibonacci projection. On the upside, initial firm resistance is seen at 107.899, the 20-day EMA.
GILT TECHS: (Z2) Southbound
- RES 4: 107.93 High Sep 1
- RES 3: 106.73 20-day EMA
- RES 2: 106.84 High Sep 8 and a key near-term resistance
- RES 1: 105.77 High Sep 15
- PRICE: 103.58 @ Close Sep 21
- SUP 1: 103.31 Low Jun 2008
- SUP 2: 103.05 2.236 projection of the Aug 22 - 24 - 26 price swing
- SUP 3: 102.90 Low Jul 2007
- SUP 4: 102.54 2.382 projection of the Aug 22 - 24 - 26 price swing
Gilt futures resumed their downtrend Wednesday, extending the move through last week’s low of 104.47 on Sep 14. The break lower maintains the bearish price sequence of lower lows and lower highs and this has resulted in a break of the 103.87 objective, 2.00 projection of the Aug 22 - 24 - 26 price swing. The move lower exposes 103.05, the 2.236 projection. Key short-term resistance is seen at 106.84, the Sep 8 high.
BTP TECHS: (Z2) Trend Needle Still Points South
- RES 4: 122.59 High Aug 19
- RES 3: 121.32 High Aug 25
- RES 2: 120.00 Round number resistance
- RES 1: 117.76/119.06 20-day EMA / High Sep 8 and key resistance
- PRICE: 115.67 @ Close Sep 21
- SUP 1: 114.67 Low Sep 22
- SUP 2: 113.78 Low Jun 14 and key support
- SUP 3: 112.94 1.236 proj of the Aug 25 - Sep 1 - 8 price swing
- SUP 4: 112.22 1.382 proj of the Aug 25 - Sep 1 - 8 price swing
BTP futures remain bearish and Wednesday’s move lower confirmed a resumption of the bear cycle. The contract has traded below last week’s lows and the break maintains the bearish price sequence of lower lows and lower highs. The focus is on the major support at 113.78, Jun 14 low (cont). Clearance of this level would strengthen the broader bearish theme. On the upside, initial firm resistance is seen at 119.06, the Sep 8 high.
US 10YR FUTURE TECHS: (Z2) Trend Needle Still Points South
- RES 4: 118-00 High Aug 26
- RES 3: 117-08 50 day EMA values
- RES 2: 115-29+/116-26 20-day EMA / High Sep 2
- RES 1: 114.17/115-01 High Sep 20 / 15
- PRICE: 114-03+ @ 20:59 BST Sep 21
- SUP 1: 113-09+ Low Sep 21
- SUP 2: 113-06 2.236 proj of the Mar ‘20 - Apr ‘21 - Aug ‘21 swing
- SUP 3: 113-00 Round nu,ber support
- SUP 4: 112-25+ Low Jun 11 2009
Treasuries remain soft and the contract traded lower Wednesday. Importantly for bears, price has breached key support at 114-06, the Jun 14 low. This confirms a resumption of the broader downtrend and strengthens the underlying bearish condition. The 114.00 handle has been cleared, the focus is on 113-06, a Fibonacci projection. Initial firm resistance is at 115-24+, the 20-day EMA.
EQUITIES
EUROSTOXX50 TECHS: (Z2) Bearish Price Activity
- RES 4: 3810.00 High Aug 17 and key resistance zone
- RES 3: 3753.00 High Aug 19
- RES 2: 3692.00 High Aug 26
- RES 1: 3543.60/3678.00 20-day EMA / High Sep 13 and bull trigger
- PRICE: 3426.00 @ 06:08 BST Sep 22
- SUP 1: 3405.00 Intraday low
- SUP 2: 3360.00 Low Jul 16
- SUP 3: 3341.00 Low Jul 5 and a key support
- SUP 4: 3300.00 Round number support
EUROSTOXX 50 futures remain soft following the reversal last week from 3678.00, the Jun 13 high. Attention is on a key short-term support at 3423.00, the Sep 5 low. This level has been pierced, a clear break would strengthen bearish conditions and open 3360.00, the Jul 14 low. 3678.00 is the short-term bull trigger where a break would reinstate a bullish theme. Initial resistance is seen at 3543.60, the 20-day EMA.
E-MINI S&P (Z2): Bear Trend Extension
- RES 4: 4313.50 High Aug 18
- RES 3: 4234.25 High Aug 26
- RES 2: 4032.28/4175.00/47 50-day EMA / High Sep 13
- RES 1: 3936.25 High Sep 20
- PRICE: 3790.00 @ 06:52 BST Sep 22
- SUP 1: 3766.75 Intraday low
- SUP 2: 3741.75 Low Jul 14
- SUP 3: 3657.00 Low Jun 17 and a major support
- SUP 4: 3600.00 Round number support
S&P E-Minis traded lower Wednesday and has cleared recent lows to confirm a resumption of the bear cycle that started mid-August. The break lower strengthens bearish conditions and paves the way for a move towards 3741.75, the Jul 14 low. The key support at 3657.00, Jun 17 low, has also been exposed. On the upside, initial firm resistance has been defined at 3936.25, the Sep 20 high.
COMMODITIES
BRENT TECHS: (X2) Bearish Outlook
- RES 4: $107.30 - High Jul 5
- RES 3: $103.86 - High Jul 29 and key resistance
- RES 2: $95.55 - 50-day EMA
- RES 1: $93.50 - High Sep 21
- PRICE: $90.36 @ 06:59 BST Sep 22
- SUP 1: $88.50/87.24 - Low Sep 19 / 8 and the bear trigger
- SUP 2: $86.54 - Low Mar 9 and a key support
- SUP 3: $82.59 - 1.618 proj of the Jul 29 - Aug 17 - 30 price swing
- SUP 4: $80.71 - 1.764 proj of the Jul 29 - Aug 17 - 30 price swing
The outlook in Brent futures remains bearish and the contract found resistance at yesterday’s intraday high - short-term gains are considered corrective. The recent break of $89.06, Jul 14 low and a bear trigger highlights a continuation of the broader downtrend that started early June. A resumption of weakness would open $86.54, the Mar 9 low. Firm resistance is seen at the 50-day EMA which intersects at $95.55.
WTI TECHS: (X2) Bear Threat Remains Present
- RES 4: $97.91 - High Jul 29 and a reversal trigger
- RES 3: $96.82 - High Aug 30 and key resistance
- RES 2: $89.59 - 50-day EMA
- RES 1: $86.68 - High Sep 21
- PRICE: $83.66 @ 07:03 BST Sep 22
- SUP 1: $81.73/80.89 - Low Sep 19/ 8 and the bear trigger
- SUP 2: $79.31 - Low Feb 18
- SUP 3: $77.86 - Low Feb 1
- SUP 4: $75.70 - Low Jan 24
A bearish threat in WTI futures remains present and yesterday’s pullback reinforces this theme. The recent break of support at $84.25, the Jul 14 low, confirmed a resumption of the downtrend that started Jun 8 and marks the end of a broad sideways move that has been in place since mid-July. A continuation lower would open $79.31 next, the Feb 18 low. Key short-term resistance is unchanged at $89.59, the 50-day EMA.
GOLD TECHS: Bear Flag
- RES 4: $1783.2 - High Aug 16
- RES 3: $1765.5 - High Aug 25 and a key resistance
- RES 2: $1735.1 - High Sep 12 and 50-day EMA
- RES 1: $1688.9/1707.1 - Low Sep 1 / High Sep 14
- PRICE: $1660.2 @ 07:19 BST Sep 22
- SUP 1: $1654.2 - Low Sep 16
- SUP 2: $1640.9 - Low Aug 8 2020
- SUP 3: $1610.5 - 1.00 proj of the Jun 13 - Jul 21 - Aug 10 swing
- SUP 4: $1569.1 - Low Apr 1 2020
Gold is consolidating and the recent pause in the downtrend appears to be a bear flag formation. This pattern reinforces a bearish theme. The recent break of support at $1681.0, the Jul 21 low, confirmed a resumption of the downtrend that started early March. Attention is on $1640.9 next, the Aug 8 2020 low. Key trend resistance has been defined at $1735.1, the Sep 12 high. Initial resistance is at $1688.9, the Sep 1 low.
SILVER TECHS: Remains Below Recent Highs
- RES 4: $21.967 - High Jun 17
- RES 3: $21.540 - High Jun 27
- RES 2: $20.876 - High Aug 15 and the bull trigger
- RES 1: $20.014 - High Sep 12
- PRICE: $19.405 @ 07:21 BST Sep 22
- SUP 1: $18.782/17.562 - Low Sep 16 / Low Sep 1 and bear trigger
- SUP 2: $16.955 - Low Jun 15 2020
- SUP 3: $16.473 - 1.00 proj of the Jun 6 - Jul 14 - Aug 10 price swing
- SUP 4: $15.998 - 76.4% retracement of the 2020 - 2021 bull leg
Silver is consolidating and remains below its recent highs. Last Friday’s print below $18.845, Sep 12 low, signals the end of the recent corrective recovery between Sep 1 - 12. An extension lower would pave the way for a move towards the key support and bear trigger at $17.562, the Sep 1 low. Clearance of this level would confirm a resumption of the broader downtrend. A break of $20.014, Sep 12 high, is required to reinstate a bullish theme.
Why MNI
MNI is the leading provider
of intelligence and analysis on the Global Fixed Income, Foreign Exchange and Energy markets. We use an innovative combination of real-time analysis, deep fundamental research and journalism to provide unique and actionable insights for traders and investors. Our "All signal, no noise" approach drives an intelligence service that is succinct and timely, which is highly regarded by our time constrained client base.Our Head Office is in London with offices in Chicago, Washington and Beijing, as well as an on the ground presence in other major financial centres across the world.