
Why MNI
MNI is the leading provider
of intelligence and analysis on the Global Fixed Income, Foreign Exchange and Energy markets. We use an innovative combination of real-time analysis, deep fundamental research and journalism to provide unique and actionable insights for traders and investors. Our "All signal, no noise" approach drives an intelligence service that is succinct and timely, which is highly regarded by our time constrained client base.Our Head Office is in London with offices in Chicago, Washington and Beijing, as well as an on the ground presence in other major financial centres across the world.
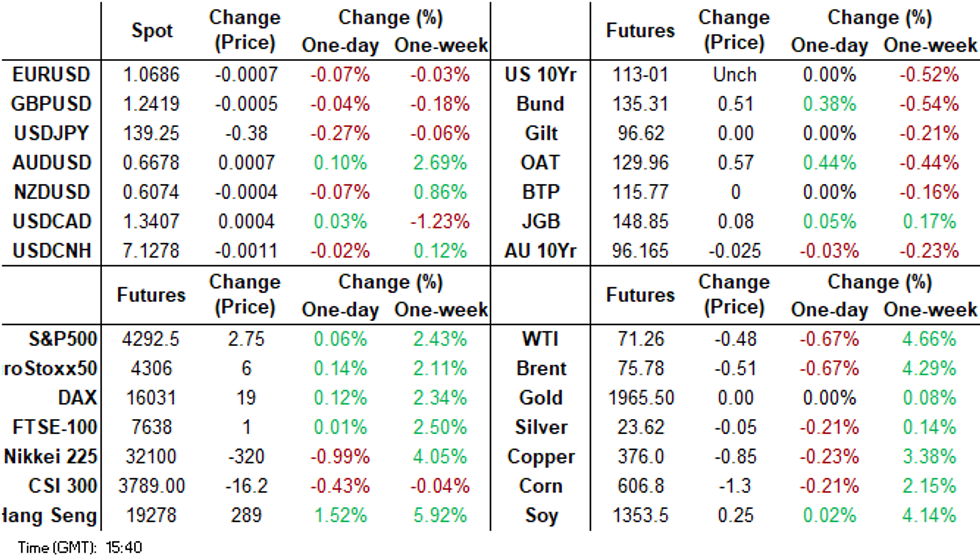
- ACGBs are sitting cheaper (YM -6.0 & XM -1.5) as local participants consider RBA Governor Lowe's speech, a Q1 GDP miss and troubling productivity and unit labour costs (ULC) updates. RBA dated OIS pricing is 1-5bp firmer across meetings after the data with December leading.
- China's May trade data saw export growth catch up to the downside. Base effects from last year, coupled with softer global growth has weighed on external demand momentum. On the import side, things were a little bit better relative to expectations, with commodity imports rising.
- China aggregate equity indices have still struggled today, while property sub-indices are higher, amid further stimulus speculation. Iron ore prices are around 7 week highs, but oil is tracking lower. USD/CNH got above 7.1300 post the export miss, but sits slightly lower now. In the G10 FX space, yen is an outperformer, tight ranges prevail elsewhere. The A$ is also slightly better bid at the margins, with yield and iron ore moves helping.
- Looking ahead, US trade and consumer credit data for April are due. German April IP prints and the ECB’s De Guindos, Fernandez-Bollo and Panetta speak. The Bank of Canada meeting is also coming up and rates are expected to be held at 4.5%.
MARKETS
US TSYS: Curve Marginally Flatter In Asia
TYU3 deals at 114-01, +0-08, a 0-04 range has been observed on volume of ~56k.
- Cash tsys sit 1bp cheaper to 1bp richer across the major benchmarks, the curve has twist flattened pivoting on 10s.
- Tsys were marginally pressured as spillover from ACGBs, in lieu of RBA Gov Lowe's remarks this morning as he noted further tightening may be needed due to wage gains and persistent service price pressures.
- A bid in JGBs and the Yen, which saw pressure on Japanese equities, facilitated a recovery off session lows. The move didn't follow through and tsys respected narrow ranges for the remainder of the Asian session.
- FOMC dated OIS price ~6bps of hikes into next week's meeting, a terminal rate of ~5.25% is seen in July with ~30bps of cuts priced for 2023.
- German Industrial Production and ECB-speak from de Guindos headlines the European session. Further out we have US Trade Balance and the latest monetary policy decision from the Bank of Canada.
JGBS: Light Calendar, Narrow Range, JGB Curve Twist Flattens
In afternoon Tokyo trading, JGB futures are holding in the middle of a narrow range, +9 compared to settlement levels.
- With the local calendar light, local participants are likely on headlines watch and monitoring US tsys after the US cash curve twist flattened on Tuesday. The cash tsy curve has twist flattened further in Asia-Pac trade with yields +2.1bp to -0.5bp, pivoting at the 10s.
- BoJ Governor Ueda states in parliament that how the exit from easy policy could affect BoJ’s finances will depend on economic, price and financial developments – Reuters.
- The cash JGB curve has maintained the morning’s twist flattening in Tokyo afternoon trade, pivoting at the 4-year zone. Yields are however lower in line with US tsys moving away from Asia-Pac session cheaps. The benchmark 10-year yield is 0.8bp lower at 0.418%.
- Swaps curve twist flattens as well with swap spreads wider apart from the 10-year zone.
- The local calendar is heavy tomorrow with the release of GDP (Q1 final), Trade Balance (Apr), Bank Lending (May), International Investment Flows (June 2) and Tokyo Office Vacancies (May).
- The MoF plans to sell Y500bn of JGBs with 5-15.5 years until maturity in a liquidity enhancement auction tomorrow.
AUSSIE BONDS: Q1 GDP Misses But Productivity & ULCs Will Be A Concern For The RBA
ACGBs are sitting cheaper (YM -6.0 & XM -1.5) as local participants consider RBA Governor Lowe's speech, a Q1 GDP miss and troubling productivity and unit labour costs (ULC) updates.
- Cash ACGBs are 2-5bp cheaper with the AU-US 10-year yield differential 4bp higher at +16bp.
- Swap rates are 1-5bp higher on the day.
- The bills strip is lower with pricing -2 to -10, late whites leading.
- RBA dated OIS pricing is 1-5bp firmer across meetings after the data with December leading.
- While Q1 GDP undershot expectations, it also revealed a 4.5% y/y fall in productivity, the lowest annual rate since the series began in 1979. Moreover, ULCs rose from 6.9% y/y in Q4 to 7.9%, the highest annual rate since 1990 outside the pandemic. This data is only going to increase inflation risks and the RBA’s concerns.
- Goldman Sachs has raised its terminal rate hike expectation for the RBA (to 4.85% from 4.35%) after RBA Lowe's speech earlier today. The bank now expects hikes in July, August and September. Previously it had expected a 25bp hike in July.
- The global economic calendar is light today, with the highlight being the BoC Policy Decision. The market has assigned a 46% probability of a 25bp rate hike.
RBA: Lowe: Upside Inflation Risks Increased Since April Pause
In the Q&A session following Governor Lowe’s prepared remarks he reiterated the Board’s commitment to returning inflation to target but also noted that the fundamentals of the Australian economy are “very positive”. He also said that the current 2-3% target band is appropriate for Australia and that QT is not an effective policy tool when rates are available.
- He commented that the decision to increase minimum award wages by 5.75% was only one factor in the Board’s June decision to hike. It was higher than the RBA was forecasting but he said that it only impacted a small share of employees and thus is only a concern if it becomes a benchmark for wage increases generally. This didn’t occur after last year’s minimum wage rise, but the risk is that the longer these levels of increase go on, then the harder it will be for them not to become a benchmark.
- In terms of wages, he reiterated that increases should be in line with 2.5% plus productivity growth and so the latter is key in making larger pay rises sustainable and not inflationary. He observed that strong services inflation is linked to current high unit labour cost growth.
- The other factors considered in June along with the minimum wage decision were overseas developments, domestic inflation, house prices, AUD, and Federal and state wage policies.
- The May/June tightening following the April pause didn’t reflect a shift in inflation tolerance but an increase in inflation risks. There had been upside surprises on wages, house prices and foreign & domestic inflation, which have a high correlation. These risks were testing the limit of the RBA’s patience.
AUSTRALIAN DATA: Growth Slows But Domestic Demand Strengthens
Q1 GDP was slightly lower than expected at 0.2% q/q and 2.3% y/y after an upwardly-revised 0.6% q/q and 2.6% y/y in Q4. The headline looks weaker than the details with domestic demand rising 0.6% q/q, driven by capex. GDP was impacted by detractions from net exports driven by higher imports and from the statistical discrepancy. While quarterly growth was the slowest since the pandemic, solid domestic growth is likely to maintain pressure on domestically-driven prices.
- Household consumption rose 0.2% q/q after 0.3% in Q4 to be up 3.5% y/y, driven by spending on essential goods & services. Given that real retail sales fell 0.6% q/q, services remained robust in the quarter. Government spending was +0.1% q/q after +0.6% in Q4 to be down 0.1% y/y.
- The household savings ratio fell to 3.7% in Q1 from 4.4%, the lowest since 2.6% in Q2 2008 during the financial crisis. As inflation, higher income tax and rates bite, households are saving significantly less.
- Private GFCF contributed 0.2pp to growth as it rose 1.4% q/q but is only up 0.9% y/y and public GFCF added 0.15pp. There was a 6%q/q increase in machinery investment while dwellings fell 1.2% q/q and -4.4% y/y. The inventory contribution was flat.
- Exports rose a solid 1.8% q/q to be up an impressive 10.8% y/y but were outpaced by imports +3.2% q/q. Consumption goods imports increased 4.9% q/q and capex goods +5.3% q/q, another sign of robust domestic demand. Thus net exports detracted 0.2pp from growth.
- The statistical discrepancy detracted 0.1pp from GDP.

Source: MNI - Market News/ABS
Australia domestic demand y/y%

Source: MNI - Market News/ABS
AUSTRALIAN DATA: Q1 Productivity Growth New Record Low
Today’s Q1 national accounts included updated data on productivity and unit labour costs (ULC), which the RBA has become increasingly concerned about and Governor Lowe noted is having a direct impact on services prices. Productivity fell another 0.2% q/q to be down 4.5% y/y, the lowest annual rate since the series began in 1979. Hours worked rose 0.6% q/q to be up 7.1% y/y. ULC rose 2% q/q to be up 7.9% y/y from Q4’s 6.9% y/y, the highest annual rate since 1990 outside the pandemic. This data is only going to increase inflation risks and the RBA’s concerns.
- Total compensation of employees rose 2.4% q/q to be up 10.8% y/y, the highest annual rate since Q2 2007.
- There is a long way to go before productivity growth returns to +1%, the RBA’s forecast and desired rate. If hours worked decline to zero by Q2 2024 and using the RBA’s GDP forecasts, productivity reaches 1% in Q3 2024, and if hours worked fall to zero by Q3 2023 and stay there end-2024, this is achieved in Q1 2024. The first scenario is likely to mean more tightening, while the second one is more drastic it would be more in line with the RBA’s wish.
- Real unit labour costs rose 0.1% q/q to be up 1.1% y/y from -2% y/y in Q4, signalling that the loss of competitiveness stopped in Q1.

Source: MNI - Market News/ABS/RBA
Australia nominal vs real ULC y/y%

Source: MNI - Market News/ABS
NZGBS: Twist Flattening, Local Market Weighs ACGB & US Tsy Movements
NZGBs closed with the 2s10s cash curve bear flattening. This occurred as the local market considered the negative impact stemming from an ACGB sell-off triggered by yesterday's surprise 25bp rate hike, which took place after the local market had closed. However, the positive performance of longer-dated US tsys overnight provided a contrasting influence. These divergent factors have persisted during Asia-Pac trading today.
- As a result, NZGBs have shown weaker performance compared to US tsys, with the NZ/US 10-year yield differential +5bp. Conversely, NZGBs have exhibited stronger performance when compared to ACGBs, resulting in a 5bp point narrowing of the NZ/AU 10-year yield differential.
- Swap rates closed 2-4bp higher with the curve flatter and implied swap spreads slightly wider.
- RBNZ dated OIS closed flat to 4bp firmer across meeting with Feb’24 leading.
- The local calendar sees Mfg Activity (Q1) and the NZ Government’s 10-month Financial Statement tomorrow.
- The global economic calendar is light today, with the highlight being the BoC Policy Decision. The market has assigned a 46% probability of a 25bp rate hike.
- The NZ Treasury announced that they plan to sell NZ$200mn of the 4.50% May-30 bond, NZ$150mn of the 3.50% Apr-33 bond and NZ$50mn of the 2.75% Apr-37 bond tomorrow.
FOREX: Yen Moderately Firmer In Asia
The yen is the best performer in the G-10 space at the margins on Wednesday. USD/JPY was offered as Japanese equities fell, there was no obvious headline driver for the move, and the Yen held its gains through the session.
- USD/JPY prints at ¥139.20/30 down ~0.3%, however Tuesday's lows remain intact for now. Support comes in at the low from June 1 at ¥138.45.
- AUD is marginally firmer, the pair rose ~0.3% briefly breaching post Tuesday's RBA highs as RBA Gov Lowe noted that further tightening may be needed due to wage gains and persistent service price pressures. Gains were pared as Q1 GDP was softer than expected and AUD/USD sits at $0.6675/80.
- Kiwi is little changed in Asia, NZD/USD prints at $0.6075/80. A narrow ~20 pip range has been observed thus far today.
- Elsewhere in G-10 SEK is pressured, however liquidity is generally poor through the Asia session. EUR and GBP are little changed and were unable to follow through on an early move higher.
- Cross asset wise; E-minis are marginally firmer and BBDXY is a touch softer. US Treasury Yields are little changed.
- The Bank of Canada's monetary policy decision provides the highlight of today's docket, the bank is expected to hold rates steady at 4.50%.
EQUITIES: Japan Equity Rally Loses Momentum, China Property Stocks Still Pushing Higher
Regional equities are mixed. Japan equity weakness was a feature early, but these markets have pared losses. China and HK are showing contrasting trends, with further chat in onshore media of China property market support. Most SEA markets are lower. US futures have largely been on the sidelines. Eminis last around 4294, +0.10% so far for the session.
- The early weakness in Japan stocks didn't appear fundamentally driven, with some consoldiation evident after an impressive 4 day rally. The Nikkei 225 last sat around 32270, against early lows of 32000. This is still around 0.75% sub yesterday's closing levels.
- The headline CSI 300 is down by 0.36% at the break, although the property sub index is up 0.92%. A local media report highlighted that further stimulus may come for the sector in June.
- The HSI is up nearly 1% at the break, the HS TECH index up 2%, with a potential Blinken trip to China in coming weeks a sign of some thawing in US-China tensions, a positive catalyst.
- The Taiex is +0.80% following the positive lead from the SOX in Tuesday US trade, while the Kospi is around 0.30% firmer as South Korean markets return from yesterday's holiday.
- In SEA, only the Philippines bourse is higher at this stage.
OIL: Prices Keep Falling As Demand Worries Outweigh Saudi Output Cut
Oil prices are down a further 0.4% after falling on Tuesday, as demand concerns came to the fore again following weak China export data. Gains following the further OPEC output cut were brief. WTI is down 0.4% to $71.44/bbl, close to the intraday low of $71.32. Brent is 0.5% lower to $75.94 just off the low of $75.83. The USD index is down 0.1%.
- China’s export growth fell 7.5% y/y in May and while it was impacted by base effects, it signals that global demand is soft. Import growth was better than expected at -4.5% y/y and crude imports rose 6.2% y/y. Also on the demand side, the US expects its 2023 oil consumption to be half of 2022’s.
- Russian output in May only fell to 9.66mbd from 9.67mbd after it promised a 500kbd reduction and now Saudi Arabia is telling Russia to be more transparent.
- Later there is US EIA crude inventory data trade data for April and earlier Bloomberg reported that API US crude inventories fell 1.71mn barrels in the latest week after a 5.2mn build, according to people familiar with the data.
- US trade and consumer credit data for April are due. German April IP prints and the ECB’s De Guindos, Fernandez-Bollo and Panetta speak. The Bank of Canada meeting is also coming up and rates are expected to be held at 4.5%.
GOLD: Treads Water As Market Considers Next Week’s FOMC Outcome
Gold is unchanged in the Asia-Pacific session, after treading water on Tuesday. The precious metal closed +0.1% at 1963.52 as the US tsy yield curve twist flattened and the market considered the Federal Reserve’s interest rate path, ahead of next week’s FOMC meeting.
- Traders have shown a growing inclination towards the belief that the US central bank will maintain interest rates at their current level at the upcoming June meeting while remaining open to the possibility of future rate hikes. The pricing of FOMC-dated OIS contracts has an expectation of approximately 6bp of rate hikes factored in for next week's meeting, with a projected terminal rate of around 5.25% by July. Additionally, the market has priced in approximately 25bp of rate cuts for 2023.
- In a quiet day data-wise, tsys were pressured to session lows on spillover from EGBs, rate locking tied to incoming corporate debt issuance early in the NY session. Higher US tsy yields are typically negative for non-yielding bullion.
- However, cash tsys finished the NY session 1bp cheaper to 4bps richer across the major benchmarks with the curve twist flattening, pivoting on 3s.
CHINA DATA: Export Growth Unhelpful For The Yuan, Imports Still Negative But Above Expectations
China's May trade data saw export growth catch up to the downside. Base effects from last year, coupled with softer global growth has weighed on external demand momentum. At -7.5% y/y, export growth back close to late 2022/early 2023 lows. It remains above the pace of other NEA economies though, where export growth is still running at a negative double digit pace.
- The first chart below overlays export growth against CNY NEER (J.P. Morgan Index) y/y changes, with this series inverted on the chart. The NEER fall looks too weak relative to the export trend, but there are other factors at play in terms of weaker growth conditions more broadly, which is fueling easing expectations.
- In any case, weaker than expected export growth will be difficult to be seen as a positive for the local FX. Also, the export miss helped weaken the trade surplus position, back to $65.81bn, which is still very elevated by historical standards but was below expectations.
Fig 1: China Exports Y/Y & CNY NEER Y/Y (Inverted)
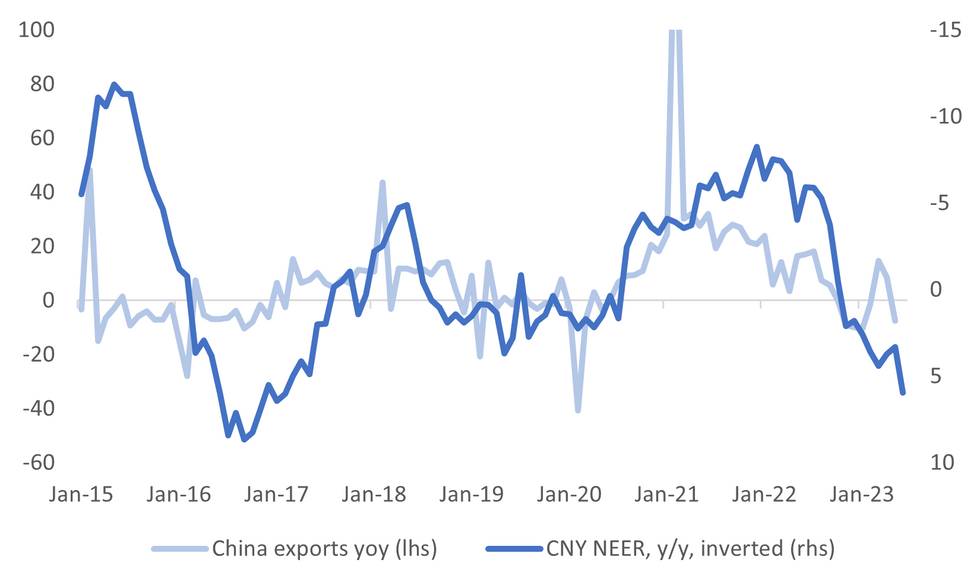
Source: J.P. Morgan/MNI - Market News/Bloomberg
- On the import side, things were a little bit better relative to expectations, growth at -4.5% y/y, versus -8.0% forecast. Some of the headlines showed impressive y/y bounces in commodity imports (such as iron ore and oil), but coal imports were still reportedly down versus April levels.
- The second chart below overlays China import growth against the spot commodity price changes. The two series are reasonably linked with each other.
- The market may want to see further improvement in domestic demand indicators/and or fresh stimulus measures before it turns more constructive on the China demand outlook than just a modest import beat.
Fig 2: China Import Growth & Global Spot Commodity Prices (Y/Y)
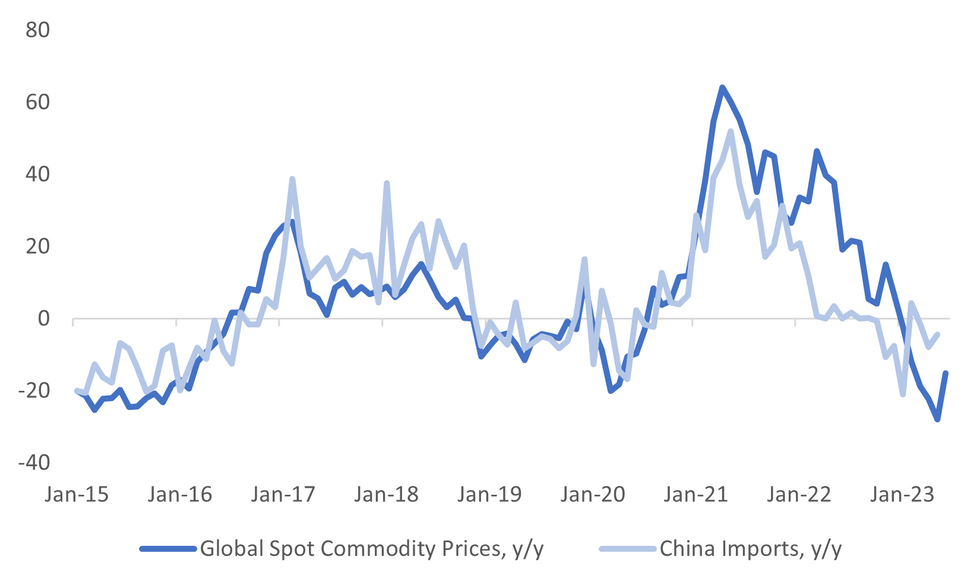
Source: MNI - Market News/Bloomberg
ASIA FX: Export Dip Weighs On CNH, USD/KRW Back Above 1300
USD/Asia pairs are mixed today, with dips in USD/CNH and USD/KRW both supported. China trade figures created fresh concerns over the growth outlook, although commodity import demand appeared firm. Other pairs tracked recent ranges. Still to come is Taiwan export data for May, while tomorrow the main focus will be on the RBI decision, no change is expected. Also out is Thailand consumer confidence.
- USD/CNH dips towards 7.1100 were supported, the pair moving back above 7.1300 post weaker than expected export data. Imports were firmer, with commodity demand picking up, but this also weighed on the trade surplus position. The CNY fixing was neutral, while onshore equities are trying to climb. Property stimulus talks continue, while talk of Blinken trip to China may help lower US-China tensions.
- 1 month USD/KRW couldn't sustain a move sub 1295, the pair tracking back to 1300 at the time of writing. Weaker China export growth data has likely weighed at the margins, along with negative spill over from higher USD/CNH levels. Onshore equities are firmer, but the rate of offshore buying has slowed so far this week. Spot USD/KRW is back to 1302.
- USD/TWD is stuck in the middle of its recent range, last ~30.71. On the topside, the 200-day MA near 30.835 is offering resistance, while support is evident at the 50-day MA around 30.63/64, and below that is the 100-day MA at 30.52. TWD looks cheap relative to the continued strengthening in onshore equities, with the TWSE last near 16900, amid on-going tech optimism. The pace of equity inflows has slowed from offshore investors though. Another offset is coming from more elevated USD/CNY levels, with China still an important trading partner. Trade figures for May print later.
- USD/INR has opened dealing ~0.1% softer printing at 82.55/60 as broader USD trends dominate flows. The pair remains in a technical up-trend, bulls look to target a break of the 83 handle. The RBI intervened in the FX market earlier in the year when we came close to the handle. Bear's immediate focus is on the 20-Day EMA (82.4919), from there they look to target the low from May 4 at 81.6563. Global Investors sold $62.11mn of Indian equities on June 5, this was the first net outflow since late April.
- USD/MYR is ~0.1% softer this morning as the Ringgit pares some of Tuesday's losses. The pair is holding above 4.60 having been unable to sustain a recent break below the handle and last prints at 4.6040/60. Palm Oil Futures are a touch firmer today, the contract sits ~4% above cycle lows seen on 1 June. The local docket is empty today, on Thursday we have May 3 Foreign Reserves before Industrial Production crosses on Friday.
- The SGD NEER (per Goldman Sachs estimates) is firmer this morning, we sit a touch off the top of the recent range. We now sit ~0.7% below the upper end of the band. USD/SGD is ~0.1% lower this morning, last printing at $0.1.3470/80 as broader USD trends continue to dominate flows. May Foreign Reserves is the only data of note today, there is no estimate and the prior read was $312.01bn.
UP TODAY (TIMES GMT/LOCAL)
| Date | GMT/Local | Impact | Flag | Country | Event |
| 07/06/2023 | 0545/0745 | ** |  | CH | Unemployment |
| 07/06/2023 | 0600/0800 | ** |  | DE | Industrial Production |
| 07/06/2023 | 0645/0845 | * |  | FR | Foreign Trade |
| 07/06/2023 | 0750/0950 |  | EU | ECB de Guindos Speech at EC/ECB Conference | |
| 07/06/2023 | 0800/1000 | * |  | IT | Retail Sales |
| 07/06/2023 | 0900/1000 | ** |  | UK | Gilt Outright Auction Result |
| 07/06/2023 | 0910/1110 | | EU | ECB Panetta Moderates EC/ECB Conference Panel | |
| 07/06/2023 | 1100/0700 | ** |  | US | MBA Weekly Applications Index |
| 07/06/2023 | - | *** |  | CN | Trade |
| 07/06/2023 | 1230/0830 | ** |  | CA | International Merchandise Trade (Trade Balance) |
| 07/06/2023 | 1230/0830 | ** | | US | Trade Balance |
| 07/06/2023 | 1400/1000 | *** | | CA | Bank of Canada Policy Decision |
| 07/06/2023 | 1430/1030 | ** | | US | DOE Weekly Crude Oil Stocks |
| 07/06/2023 | 1900/1500 | * | | US | Consumer Credit |
Why MNI
MNI is the leading provider
of intelligence and analysis on the Global Fixed Income, Foreign Exchange and Energy markets. We use an innovative combination of real-time analysis, deep fundamental research and journalism to provide unique and actionable insights for traders and investors. Our "All signal, no noise" approach drives an intelligence service that is succinct and timely, which is highly regarded by our time constrained client base.Our Head Office is in London with offices in Chicago, Washington and Beijing, as well as an on the ground presence in other major financial centres across the world.